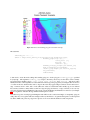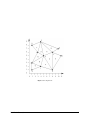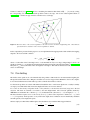
1
ANUGA User Manual Release 1.2.1 Geoscience Australia and the Australian National University Friday 26th November, 2010, Three minutes past Six in the afternoon Geoscience Australia Email: [email protected] c Commonwealth of Australia (Geoscience Australia) and the Australian National University 2004-2010. Permission to use, copy, modify, and distribute this software for any purpose without fee is hereby granted under the terms of the GNU General Public License as published by the Free Software Foundation; either version 2 of the License, or (at your option) any later version, provided that this entire notice is included in all copies of any software which is or includes a copy or modification of this software and in all copies of the supporting documentation for such software. This program is distributed in the hope that it will be useful, but WITHOUT ANY WARRANTY; without even the implied warranty of MERCHANTABILITY or FITNESS FOR A PARTICULAR PURPOSE. See the GNU General Public License (http://www.gnu.org/copyleft/gpl. html) for more details. You should have received a copy of the GNU General Public License along with this program; if not, write to the Free Software Foundation, Inc., 59 Temple Place, Suite 330, Boston, MA 02111-1307 This work was produced at Geoscience Australia and the Australian National University funded by the Commonwealth of Australia. Neither the Australian Government, the Australian National University, Geoscience Australia nor any of their employees, makes any warranty, express or implied, or assumes any liability or responsibility for the accuracy, completeness, or usefulness of any information, apparatus, product, or process disclosed, or represents that its use would not infringe privately-owned rights. Reference herein to any specific commercial products, process, or service by trade name, trademark, manufacturer, or otherwise, does not necessarily constitute or imply its endorsement, recommendation, or favoring by the Australian Government, Geoscience Australia or the Australian National University. The views and opinions of authors expressed herein do not necessarily state or reflect those of the Australian Government, Geoscience Australia or the Australian National University, and shall not be used for advertising or product endorsement purposes. This document does not convey a warranty, express or implied, of merchantability or fitness for a particular purpose. ANUGA Manual typeset with LATEX Credits: • ANUGA was developed by Stephen Roberts, Ole Nielsen, Duncan Gray and Jane Sexton. It is currently being developed and maintained by Nariman Habili and Stephen Roberts. License: • ANUGA is freely available and distributed under the terms of the GNU General Public Licence. Acknowledgments: • Ole Nielsen, James Hudson, John Jakeman, Rudy van Drie, Ted Rigby, Petar Milevski, Joaquim Luis, Nils Goseberg, William Power, Trevor Dhu, Linda Stals, Matt Hardy, Jack Kelly and Christopher Zoppou who contributed to this project at various times. • A stand alone visualiser (anuga viewer) based on Open-scene-graph was developed by Darran Edmundson and James Hudson. • The mesh generator engine was written by Jonathan Richard Shewchuk and made freely available under the following license. See source code triangle.c for more details on the origins of this code. The license reads /*****************************************************************************/ /* */ /* 888888888 ,o, / 888 */ /* 888 88o88o " o8888o 88o8888o o88888o 888 o88888o */ /* 888 888 888 88b 888 888 888 888 888 d888 88b */ /* 888 888 888 o88ˆo888 888 888 "88888" 888 8888oo888 */ /* 888 888 888 C888 888 888 888 / 888 q888 */ /* 888 888 888 "88oˆ888 888 888 Cb 888 "88oooo" */ /* "8oo8D */ /* */ /* A Two-Dimensional Quality Mesh Generator and Delaunay Triangulator. */ /* (triangle.c) */ /* */ /* Version 1.6 */ /* July 28, 2005 */ /* */ /* Copyright 1993, 1995, 1997, 1998, 2002, 2005 */ /* Jonathan Richard Shewchuk */ /* 2360 Woolsey #H */ /* Berkeley, California 94705-1927 */ /* [email protected] */ /* */ /* This program may be freely redistributed under the condition that the */ /* copyright notices (including this entire header and the copyright */ /* notice printed when the ‘-h’ switch is selected) are not removed, and */ /* no compensation is received. Private, research, and institutional */ /* use is free. You may distribute modified versions of this code UNDER */ /* THE CONDITION THAT THIS CODE AND ANY MODIFICATIONS MADE TO IT IN THE */ /* SAME FILE REMAIN UNDER COPYRIGHT OF THE ORIGINAL AUTHOR, BOTH SOURCE */ /* AND OBJECT CODE ARE MADE FREELY AVAILABLE WITHOUT CHARGE, AND CLEAR */ /* NOTICE IS GIVEN OF THE MODIFICATIONS. Distribution of this code as */ /* part of a commercial system is permissible ONLY BY DIRECT ARRANGEMENT */ /* WITH THE AUTHOR. (If you are not directly supplying this code to a */ /* customer, and you are instead telling them how they can obtain it for */ /* free, then you are not required to make any arrangement with me.) */ /*****************************************************************************/ • Pmw is a toolkit for building high-level compound widgets in Python using the Tkinter module. Parts of Pmw have been incorpoated into the graphical mesh generator. The license for Pmw reads """ Pmw copyright Copyright 1997-1999 Telstra Corporation Limited, Australia Copyright 2000-2002 Really Good Software Pty Ltd, Australia Permission is hereby granted, free of charge, to any person obtaining a copy of this software and associated documentation files (the "Software"), to deal in the Software without restriction, including without limitation the rights to use, copy, modify, merge, publish, distribute, sublicense, and/or sell copies of the Software, and to permit persons to whom the Software is furnished to do so, subject to the following conditions: The above copyright notice and this permission notice shall be included in all copies or substantial portions of the Software. THE SOFTWARE IS PROVIDED "AS IS", WITHOUT WARRANTY OF ANY KIND, EXPRESS OR IMPLIED, INCLUDING BUT NOT LIMITED TO THE WARRANTIES OF MERCHANTABILITY, FITNESS FOR A PARTICULAR PURPOSE AND NONINFRINGEMENT. IN NO EVENT SHALL THE AUTHORS OR COPYRIGHT HOLDERS BE LIABLE FOR ANY CLAIM, DAMAGES OR OTHER LIABILITY, WHETHER IN AN ACTION OF CONTRACT, TORT OR OTHERWISE, ARISING FROM, OUT OF OR IN CONNECTION WITH THE SOFTWARE OR THE USE OR OTHER DEALINGS IN THE SOFTWARE. """ Abstract ANUGA is a hydrodynamic modelling tool that allows users to model realistic flow problems in complex 2D geometries. Examples include dam breaks or the effects of natural hazards such as riverine flooding, storm surges and tsunami. The user must specify a study area represented by a mesh of triangular cells, the topography and bathymetry, frictional resistance, initial values for water level (called stage within ANUGA ), boundary conditions and forces such as rainfall, stream flows, windstress or pressure gradients if applicable. ANUGA tracks the evolution of water depth and horizontal momentum within each cell over time by solving the shallow water wave equation governing equation using a finite-volume method. ANUGA also incorporates a mesh generator that allows the user to set up the geometry of the problem interactively as well as tools for interpolation and surface fitting, and a number of auxiliary tools for visualising and interrogating the model output. Most ANUGA components are written in the object-oriented programming language Python and most users will interact with ANUGA by writing small Python programs based on the ANUGA library functions. Computationally intensive components are written for efficiency in C routines working directly with Python numpy structures. CONTENTS 1 Introduction 1.1 Purpose . . . . . . . . . . . . . . . . . . . . . . . . . . . . . . . . . . . . . . . . . . . . . . . . . . 1.2 Scope . . . . . . . . . . . . . . . . . . . . . . . . . . . . . . . . . . . . . . . . . . . . . . . . . . . 1.3 Audience . . . . . . . . . . . . . . . . . . . . . . . . . . . . . . . . . . . . . . . . . . . . . . . . . 1 1 1 1 2 Background 3 3 Restrictions and limitations on ANUGA 5 4 Getting Started 4.1 A Simple Example . . . . . . . . . . . . . . . . . 4.1.1 Overview . . . . . . . . . . . . . . . . . 4.1.2 Outline of the Program . . . . . . . . . . 4.1.3 The Code . . . . . . . . . . . . . . . . . 4.1.4 Establishing the Mesh . . . . . . . . . . . 4.1.5 Initialising the Domain . . . . . . . . . . 4.1.6 Initial Conditions . . . . . . . . . . . . . 4.1.6.1 Elevation . . . . . . . . . . . . . 4.1.6.2 Friction . . . . . . . . . . . . . 4.1.6.3 Stage . . . . . . . . . . . . . . . 4.1.7 Boundary Conditions . . . . . . . . . . . 4.1.8 Evolution . . . . . . . . . . . . . . . . . 4.1.9 Output . . . . . . . . . . . . . . . . . . . 4.2 How to Run the Code . . . . . . . . . . . . . . . 4.3 Exploring the Model Output . . . . . . . . . . . . 4.4 A slightly more complex example . . . . . . . . . 4.4.1 Overview . . . . . . . . . . . . . . . . . 4.4.2 Overview . . . . . . . . . . . . . . . . . 4.4.3 The Code . . . . . . . . . . . . . . . . . 4.4.4 Establishing the Mesh . . . . . . . . . . . 4.5 Model Output . . . . . . . . . . . . . . . . . . . . 4.5.1 Changing boundary conditions on the fly . 4.5.2 Output . . . . . . . . . . . . . . . . . . . 4.5.3 Flow through more complex topographies 4.6 An Example with Real Data . . . . . . . . . . . . 4.6.1 Overview . . . . . . . . . . . . . . . . . 4.6.2 The Code . . . . . . . . . . . . . . . . . 4.6.3 Establishing the Mesh . . . . . . . . . . . 4.6.4 Initialising the Domain . . . . . . . . . . . . . . . . . . . . . . . . . . . . . . . . . . . . . . . . . . . . . . . . . . . . . . . . . . . . . . . . . . . . . . . . . . . . . . . . . . . . . . . . . . . . . . . . . . . . . . . . . . . . . . . . . . . . . . . . . . . . . . . . . . . . . . . . . . . . . . . . . . . . . . . . . . . . . . . . . . . . . . . . . . . . . . . . . . . . . . . . . . . . . . . . . . . . . . . . . . . . . . . . . . . . . . . . . . . . . . . . . . . . . . . . . . . . . . . . . . . . . . . . . . . . . . . . . . . . . . . . . . . . . . . . . . . . . . . . . . . . . . . . . . . . . . . . . . . . . . . . . . . . . . . . . . . . . . . . . . . . . . . . . . . . . . . . . . . . . . . . . . . . . . . . . . . . . . . . . . . . . . . . . . . . . . . . . . . . . . . . . . . . . . . . . . . . . . . . . . . . . . . . . . . . . . . . . . . . . . . . . . . . . . . . . . . . . . . . . . . . . . . . . . . . . . . . . . . . . . . . . . . . . . . . . . . . . . . . . . . . . . . . . . . . . . . . . . . . . . . . . . . . . . . . . . . . . . . . . . . . . . . . . . . . . . . . . . . . . . . . . . . . . . . . . . . . . . . . . . . . . . . . . . . . . . . . . . . . . . . . . . . . . . . . . . . . . . . . . . . . . . . . . . . . . . . . . . . . . . . . . . . . . . . . . . . . . . . . . . . . . . . . . . . . . . . . . . . . . . . . . . . . . . . . . . . . . . . . . . . . . . . . . . . . . . . . . . . . . . . . . . . . . . . . . . . . . . . . . . . . . . . . . . . . . . . . . . . . . . . . . . . . . . . . . . . . . . . . . . . . . . . . . . . . . . . . . . . . . . . . . . . . . . . . . 7 7 7 7 8 9 9 10 10 10 10 11 13 13 13 13 15 15 15 15 16 16 17 18 19 21 21 21 24 29 i 4.6.5 . . . . . . . . . . . . . . . . . . . . . . . . . . . . . . . . . . . . . . . . . . . . . . . . . . . . . . . . . . . . . . . . . . . . . . . . . . . . . . . . . . . . . . . . . . . . . . . . . . . . . . . . . . . . . . . . . . . . . . . . . . . . . . . . . . . . . . . . . . . . . . . . . . . . . . . . . . . . . . . . . . . . . . . . . . . . . . . . . . . . . . . . . . . . . . . . . . . . . . . . . . . . . . . . . . . . . . . . . 29 29 29 29 30 30 31 ANUGA Public Interface 5.1 Documentation . . . . . . . . . . . . . . . . 5.2 Public vs Private Interface . . . . . . . . . . 5.3 Mesh Generation . . . . . . . . . . . . . . . 5.3.1 Advanced mesh generation . . . . . 5.3.1.1 Key Methods of Class Mesh 5.4 Initialising the Domain . . . . . . . . . . . . 5.4.1 Key Methods of Domain . . . . . . 5.5 Initial Conditions . . . . . . . . . . . . . . . 5.6 Boundary Conditions . . . . . . . . . . . . . 5.6.1 Predefined boundary conditions . . 5.6.2 User-defined boundary conditions . 5.7 Forcing Terms . . . . . . . . . . . . . . . . 5.8 Evolution . . . . . . . . . . . . . . . . . . . 5.8.1 Diagnostics . . . . . . . . . . . . . 5.9 Queries of SWW model output files . . . . . 5.10 Other . . . . . . . . . . . . . . . . . . . . . . . . . . . . . . . . . . . . . . . . . . . . . . . . . . . . . . . . . . . . . . . . . . . . . . . . . . . . . . . . . . . . . . . . . . . . . . . . . . . . . . . . . . . . . . . . . . . . . . . . . . . . . . . . . . . . . . . . . . . . . . . . . . . . . . . . . . . . . . . . . . . . . . . . . . . . . . . . . . . . . . . . . . . . . . . . . . . . . . . . . . . . . . . . . . . . . . . . . . . . . . . . . . . . . . . . . . . . . . . . . . . . . . . . . . . . . . . . . . . . . . . . . . . . . . . . . . . . . . . . . . . . . . . . . . . . . . . . . . . . . . . . . . . . . . . . . . . . . . . . . . . . . . . . . . . . . . . . . . . . . . . . . . . . . . . . . . . . . . . . . . . . . . . . . . . . . . . . . . . . . . . . . . . . . . . . . . . . . . . . . . . . . . . . . . . . . . . . . . . . . . . . . . . . . . . . . . . . . . . . . . . . . . . . . . . . . . . . . . . . . . . . . . . . . . . . . . . . . . . . . . . . . . . . . . . . . . . . . . . . . 39 39 39 40 44 44 46 46 49 52 52 54 54 57 58 61 62 ANUGA System Architecture 6.1 File Formats . . . . . . . . . . . . . . . . . . . . . . . . . 6.1.1 Manually Created Files . . . . . . . . . . . . . . . 6.1.2 Automatically Created Files . . . . . . . . . . . . 6.1.3 SWW, STS and TMS Formats . . . . . . . . . . . 6.1.4 Mesh File Formats . . . . . . . . . . . . . . . . . 6.1.5 Formats for Storing Arbitrary Points and Attributes 6.1.6 ArcView Formats . . . . . . . . . . . . . . . . . . 6.1.7 DEM Format . . . . . . . . . . . . . . . . . . . . 6.1.8 Other Formats . . . . . . . . . . . . . . . . . . . . 6.1.9 Basic File Conversions . . . . . . . . . . . . . . . . . . . . . . . . . . . . . . . . . . . . . . . . . . . . . . . . . . . . . . . . . . . . . . . . . . . . . . . . . . . . . . . . . . . . . . . . . . . . . . . . . . . . . . . . . . . . . . . . . . . . . . . . . . . . . . . . . . . . . . . . . . . . . . . . . . . . . . . . . . . . . . . . . . . . . . . . . . . . . . . . . . . . . . . . . . . . . . . . . . . . . . . . . . . . . . . . . . . . . . . . . . . . . . . . . . . . . . . . . . . 63 63 63 64 64 66 67 67 67 67 67 ANUGA mathematical background 7.1 Introduction . . . . . . . . . . 7.2 Model . . . . . . . . . . . . . . 7.3 Finite Volume Method . . . . . 7.4 Flux limiting . . . . . . . . . . 7.5 Slope limiting . . . . . . . . . . . . . . . . . . . . . . . . . . . . . . . . . . . . . . . . . . . . . . . . . . . . . . . . . . . . . . . . . . . . . . . . . . . . . . . . . . . . . . . . . . . . . . . . . . . . . . . . . . . . . . . . . . . . . . . . . . . . . . . . . . . . . . . . . . . . . . . . . . . . . . . . . . . . . . . . . . . . . . . . . . . . . . . . . . . . . . . . . . . . . . . . . . 69 69 69 69 71 72 Basic ANUGA Assumptions 8.1 Time . . . . . . . . . . . . 8.2 Spatial data . . . . . . . . . 8.2.1 Projection . . . . . 8.2.2 Internal coordinates 8.2.3 Polygons . . . . . . . . . . . . . . . . . . . . . . . . . . . . . . . . . . . . . . . . . . . . . . . . . . . . . . . . . . . . . . . . . . . . . . . . . . . . . . . . . . . . . . . . . . . . . . . . . . . . . . . . . . . . . . . . . . . . . . . . . . . . . . . . . . . . . . . . . . . . . . . . . . . . . . . . . . . . . . . . . . . . . . . . . . . . . . . . . . . . . . . . . . . . . . 75 75 75 75 75 76 A Supporting Tools A.1 caching . . . . . . . . . . . . . . . . . . . . . . . . . . . . . . . . . . . . . . . . . . . . . . . . . . A.2 anuga viewer . . . . . . . . . . . . . . . . . . . . . . . . . . . . . . . . . . . . . . . . . . . . . . . 77 77 78 4.7 5 6 7 8 ii Initial Conditions . . 4.6.5.1 Stage . . . . 4.6.5.2 Friction . . 4.6.5.3 Elevation . . 4.6.6 Boundary Conditions 4.6.7 Evolution . . . . . . Exploring the Model Output . . . . . . . . . . . . . . . . . . . . . . . . . . . . . . . . . . . . . . . . . . . . . . . . . . . . . . . . . . . . A.3 A.4 A.5 . . . . . . . . 79 82 83 85 87 88 89 89 B ANUGA Full-scale Validations B.1 Overview . . . . . . . . . . . . . . . . . . . . . . . . . . . . . . . . . . . . . . . . . . . . . . . . . B.2 Patong Beach . . . . . . . . . . . . . . . . . . . . . . . . . . . . . . . . . . . . . . . . . . . . . . . 91 91 91 C Frequently Asked Questions 93 D Glossary 95 Index 97 A.6 A.7 A.8 A.9 utilities/polygons . . . . . . . . . coordinate transforms . . . . . . geospatial data . . . . . . . . . . A.5.1 Miscellaneous Functions Graphical Mesh Generator GUI . class Alpha Shape . . . . . . . . Numerical Tools . . . . . . . . . Finding the Optimal Alpha Value . . . . . . . . . . . . . . . . . . . . . . . . . . . . . . . . . . . . . . . . . . . . . . . . . . . . . . . . . . . . . . . . . . . . . . . . . . . . . . . . . . . . . . . . . . . . . . . . . . . . . . . . . . . . . . . . . . . . . . . . . . . . . . . . . . . . . . . . . . . . . . . . . . . . . . . . . . . . . . . . . . . . . . . . . . . . . . . . . . . . . . . . . . . . . . . . . . . . . . . . . . . . . . . . . . . . . . . . . . . . . . . . . . . . . . . . . . . . . . . . . . . . . . . . . . . . . . . . . . . . . . . . . . . . . . . . . . . . . . . . iii iv CHAPTER ONE Introduction 1.1 Purpose The purpose of this user manual is to introduce the new user to the inundation software system, describe what it can do and give step-by-step instructions for setting up and running hydrodynamic simulations. The stable release of ANUGA and this manual are available on sourceforge at http://sourceforge.net/projects/anuga. A snapshot of work in progress is available through the ANUGA software repository at http://datamining.anu. edu.au/svn/anuga/trunk/anuga core/source/anuga where the more adventurous reader might like to go. This manual describes ANUGA version 1.2.1. datamining.anu.edu.au/anuga. 1.2 To check for later versions of this manual go to http:// Scope This manual covers only what is needed to operate the software after installation and configuration. It does not include instructions for installing the software or detailed API documentation, both of which will be covered in separate publications and by documentation in the source code. The latest installation instructions may be found at: http://datamining.anu.edu.au/anuga/ attachment/wiki/WikiStart/anuga installation guide-1.2.0.pdf. 1.3 Audience Readers are assumed to be familiar with the Python Programming language and its object oriented approach. Python tutorials include http://docs.python.org/tut and http://www.sthurlow.com/python. Readers also need to have a general understanding of scientific modelling, as well as enough programming experience to adapt the code to different requirements. 1 2 CHAPTER TWO Background Modelling the effects on the built environment of natural hazards such as riverine flooding, storm surges and tsunami is critical for understanding their economic and social impact on our urban communities. Geoscience Australia and the Australian National University are developing a hydrodynamic inundation modelling tool called ANUGA to help simulate the impact of these hazards. The core of ANUGA is the fluid dynamics module, called shallow_water, which is based on a finite-volume method for solving the Shallow Water Wave Equation. The study area is represented by a mesh of triangular cells. By solving the governing equation within each cell, water depth and horizontal momentum are tracked over time. A major capability of ANUGA is that it can model the process of wetting and drying as water enters and leaves an area. This means that it is suitable for simulating water flow onto a beach or dry land and around structures such as buildings. ANUGA is also capable of modelling hydraulic jumps due to the ability of the finite-volume method to accommodate discontinuities in the solution1 . To set up a particular scenario the user specifies the geometry (bathymetry and topography), the initial water level (stage), boundary conditions such as tide, and any forcing terms that may drive the system such as rainfall, abstraction of water, wind stress or atmospheric pressure gradients. Gravity and frictional resistance from the different terrains in the model are represented by predefined forcing terms. See section 5.7 for details on forcing terms available in ANUGA . The built-in mesh generator, called graphical_mesh_generator, allows the user to set up the geometry of the problem interactively and to identify boundary segments and regions using symbolic tags. These tags may then be used to set the actual boundary conditions and attributes for different regions (e.g. the Manning friction coefficient) for each simulation. Most ANUGA components are written in the object-oriented programming language Python. Software written in Python can be produced quickly and can be readily adapted to changing requirements throughout its lifetime. Computationally intensive components are written for efficiency in C routines working directly with Python numeric structures. The animation tool developed for ANUGA is based on OpenSceneGraph, an Open Source Software (OSS) component allowing high level interaction with sophisticated graphics primitives. See [nielsen2005] for more background on ANUGA . 1 While ANUGA works with discontinuities in the conserved quantities stage, xmomentum and ymomentum, it does not allow discontinuities in the bed elevation. 3 4 CHAPTER THREE Restrictions and limitations on ANUGA Although a powerful and flexible tool for hydrodynamic modelling, ANUGA has a number of limitations that any potential user needs to be aware of. They are: • The mathematical model is the 2D shallow water wave equation. As such it cannot resolve vertical convection and consequently not breaking waves or 3D turbulence (e.g. vorticity). • All spatial coordinates are assumed to be UTM (meters). As such, ANUGA is unsuitable for modelling flows in areas larger than one UTM zone (6 degrees wide). • Fluid is assumed to be inviscid – i.e. no kinematic viscosity included. • The finite volume is a very robust and flexible numerical technique, but it is not the fastest method around. If the geometry is sufficiently simple and if there is no need for wetting or drying, a finite-difference method may be able to solve the problem faster than ANUGA . • Frictional resistance is implemented using Manning’s formula, but ANUGA has not yet been fully validated in regard to bottom roughness. 5 6 CHAPTER FOUR Getting Started This section is designed to assist the reader to get started with ANUGA by working through some examples. Two examples are discussed; the first is a simple example to illustrate many of the concepts, and the second is a more realistic example. 4.1 4.1.1 A Simple Example Overview What follows is a discussion of the structure and operation of a script called ‘runup.py’. This example carries out the solution of the shallow-water wave equation in the simple case of a configuration comprising a flat bed, sloping at a fixed angle in one direction and having a constant depth across each line in the perpendicular direction. The example demonstrates the basic ideas involved in setting up a complex scenario. In general the user specifies the geometry (bathymetry and topography), the initial water level, boundary conditions such as tide, and any forcing terms that may drive the system such as rainfall, abstraction of water, wind stress or atmospheric pressure gradients. Frictional resistance from the different terrains in the model is represented by predefined forcing terms. In this example, the boundary is reflective on three sides and a time dependent wave on one side. The present example represents a simple scenario and does not include any forcing terms, nor is the data taken from a file as it would typically be. The conserved quantities involved in the problem are stage (absolute height of water surface), x-momentum and ymomentum. Other quantities involved in the computation are the friction and elevation. Water depth can be obtained through the equation: depth = stage - elevation 4.1.2 Outline of the Program In outline, ‘runup.py’ performs the following steps: 1. Sets up a triangular mesh. 2. Sets certain parameters governing the mode of operation of the model, specifying, for instance, where to store the model output. 7 3. Inputs various quantities describing physical measurements, such as the elevation, to be specified at each mesh point (vertex). 4. Sets up the boundary conditions. 5. Carries out the evolution of the model through a series of time steps and outputs the results, providing a results file that can be viewed. 4.1.3 The Code For reference we include below the complete code listing for ‘runup.py’. Subsequent paragraphs provide a ’commentary’ that describes each step of the program and explains it significance. """Simple water flow example using ANUGA Water driven up a linear slope and time varying boundary, similar to a beach environment """ #-----------------------------------------------------------------------------# Import necessary modules #-----------------------------------------------------------------------------import anuga from math import sin, pi, exp #-----------------------------------------------------------------------------# Setup computational domain #-----------------------------------------------------------------------------points, vertices, boundary = anuga.rectangular_cross(10, 10) # Basic mesh domain = anuga.Domain(points, vertices, boundary) domain.set_name(’runup’) domain.set_datadir(’.’) # Create domain # Output to file runup.sww # Use current folder #-----------------------------------------------------------------------------# Setup initial conditions #-----------------------------------------------------------------------------def topography(x, y): return -x/2 # linear bed slope #return x*(-(2.0-x)*.5) # curved bed slope domain.set_quantity(’elevation’, topography) # Use function for elevation domain.set_quantity(’friction’, 0.1) # Constant friction domain.set_quantity(’stage’, -0.4) # Constant negative initial stage #-----------------------------------------------------------------------------# Setup boundary conditions #-----------------------------------------------------------------------------Br = anuga.Reflective_boundary(domain) # Solid reflective wall Bt = anuga.Transmissive_boundary(domain) # Continue all values on boundary Bd = anuga.Dirichlet_boundary([-0.2,0.,0.]) # Constant boundary values Bw = anuga.Time_boundary(domain=domain, # Time dependent boundary f=lambda t: [(0.1*sin(t*2*pi)-0.3)*exp(-t), 0.0, 0.0]) # Associate boundary tags with boundary objects domain.set_boundary({’left’: Br, ’right’: Bw, ’top’: Br, ’bottom’: Br}) 8 Chapter 4. Getting Started #-----------------------------------------------------------------------------# Evolve system through time #-----------------------------------------------------------------------------for t in domain.evolve(yieldstep=0.1, finaltime=10.0): print domain.timestepping_statistics() 4.1.4 Establishing the Mesh The first task is to set up the triangular mesh to be used for the scenario. This is carried out through the statement: points, vertices, boundary = anuga.rectangular_cross(10, 10) The function rectangular_cross is imported from a module mesh_factory defined elsewhere. (ANUGA also contains several other schemes that can be used for setting up meshes, but we shall not discuss these.) The above assignment sets up a 10 × 10 rectangular mesh, triangulated in a regular way. The assignment: points, vertices, boundary = anuga.rectangular_cross(m, n) returns: • a list points giving the coordinates of each mesh point, • a list vertices specifying the three vertices of each triangle, and • a dictionary boundary that stores the edges on the boundary and associates each with one of the symbolic tags ’left’, ’right’, ’top’ or ’bottom’. The edges are represented as pairs (i, j) where i refers to the triangle id and j to the edge id of that triangle. Edge ids are enumerated from 0 to 2 based on the id of the vertex opposite. (For more details on symbolic tags, see page 11.) An example of a general unstructured mesh and the associated data structures points, vertices and boundary is given in Section 5.3. 4.1.5 Initialising the Domain These variables are then used to set up a data structure domain, through the assignment: domain = anuga.Domain(points, vertices, boundary) This creates an instance of the Domain class, which represents the domain of the simulation. Specific options are set at this point, including the basename for the output file and the directory to be used for data: domain.set_name(’runup’) domain.set_datadir(’.’) In addition, the following statement could be used to state that quantities stage, xmomentum and ymomentum are to be stored at every timestep and elevation only once at the beginning of the simulation: 4.1. A Simple Example 9 domain.set_quantities_to_be_stored({’stage’: 2, ’xmomentum’: 2, ’ymomentum’: 2, ’elevation’: 1}) However, this is not necessary, as the above is the default behaviour. 4.1.6 Initial Conditions The next task is to specify a number of quantities that we wish to set for each mesh point. The class Domain has a method set_quantity, used to specify these quantities. It is a flexible method that allows the user to set quantities in a variety of ways – using constants, functions, numeric arrays, expressions involving other quantities, or arbitrary data points with associated values, all of which can be passed as arguments. All quantities can be initialised using set_quantity. For a conserved quantity (such as stage, xmomentum, ymomentum) this is called an initial condition. However, other quantities that aren’t updated by the equation are also assigned values using the same interface. The code in the present example demonstrates a number of forms in which we can invoke set_quantity. 4.1.6.1 Elevation The elevation, or height of the bed, is set using a function defined through the statements below, which is specific to this example and specifies a particularly simple initial configuration for demonstration purposes: def topography(x, y): return -x/2 This simply associates an elevation with each point (x, y) of the plane. It specifies that the bed slopes linearly in the x direction, with slope − 12 , and is constant in the y direction. Once the function topography is specified, the quantity elevation is assigned through the simple statement: domain.set_quantity(’elevation’, topography) NOTE: If using function to set elevation it must be vector compatible. For example, using square root will not work. 4.1.6.2 Friction The assignment of the friction quantity (a forcing term) demonstrates another way we can use set_quantity to set quantities – namely, assign them to a constant numerical value: domain.set_quantity(’friction’, 0.1) This specifies that the Manning friction coefficient is set to 0.1 at every mesh point. 4.1.6.3 Stage The stage (the height of the water surface) is related to the elevation and the depth at any time by the equation: 10 Chapter 4. Getting Started stage = elevation + depth For this example, we simply assign a constant value to stage, using the statement: domain.set_quantity(’stage’, -0.4) which specifies that the surface level is set to a height of −0.4, i.e. 0.4 units (metres) below the zero level. Although it is not necessary for this example, it may be useful to digress here and mention a variant to this requirement, which allows us to illustrate another way to use set_quantity – namely, incorporating an expression involving other quantities. Suppose, instead of setting a constant value for the stage, we wished to specify a constant value for the depth. For such a case we need to specify that stage is everywhere obtained by adding that value to the value already specified for elevation. We would do this by means of the statements: h = 0.05 # Constant depth domain.set_quantity(’stage’, expression=’elevation + %f’ % h) That is, the value of stage is set to h = 0.05 plus the value of elevation already defined. The reader will probably appreciate that this capability to incorporate expressions into statements using set_quantity greatly expands its power. See Section 5.5 for more details. 4.1.7 Boundary Conditions The boundary conditions are specified as follows: Br Bt Bd Bw = = = = anuga.Reflective_boundary(domain) anuga.Transmissive_boundary(domain) anuga.Dirichlet_boundary([0.2, 0.0, 0.0]) anuga.Time_boundary(domain=domain, f=lambda t: [(0.1*sin(t*2*pi)-0.3)*exp(-t), 0.0, 0.0]) The effect of these statements is to set up a selection of different alternative boundary conditions and store them in variables that can be assigned as needed. Each boundary condition specifies the behaviour at a boundary in terms of the behaviour in neighbouring elements. The boundary conditions introduced here may be briefly described as follows: • Reflective boundary Returns same stage as in its neighbour volume but momentum vector reversed 180 degrees (reflected). Specific to the shallow water equation as it works with the momentum quantities assumed to be the second and third conserved quantities. A reflective boundary condition models a solid wall. • Transmissive boundary Returns same conserved quantities as those present in its neighbour volume. This is one way of modelling outflow from a domain, but it should be used with caution if flow is not steady state as replication of momentum at the boundary may cause numerical instabilities propagating into the domain and eventually causing ANUGA to crash. If this occurs, consider using e.g. a Dirichlet boundary condition with a stage value less than the elevation at the boundary. • Dirichlet boundary Specifies constant values for stage, x-momentum and y-momentum at the boundary. • Time boundary Like a Dirichlet boundary but with behaviour varying with time. Before describing how these boundary conditions are assigned, we recall that a mesh is specified using three variables points, vertices and boundary. In the code we are discussing, these three variables are returned by the 4.1. A Simple Example 11 function rectangular. The example given in Section 4.6 illustrates another way of assigning the values, by means of the function create_mesh_from_regions. These variables store the data determining the mesh as follows. (You may find that the example given in Section 5.3 helps to clarify the following discussion, even though that example is a non-rectangular mesh.) • The variable points stores a list of 2-tuples giving the coordinates of the mesh points. • The variable vertices stores a list of 3-tuples of numbers, representing vertices of triangles in the mesh. In this list, the triangle whose vertices are points[i], points[j], points[k] is represented by the 3-tuple (i, j, k). • The variable boundary is a Python dictionary that not only stores the edges that make up the boundary but also assigns symbolic tags to these edges to distinguish different parts of the boundary. An edge with endpoints points[i] and points[j] is represented by the 2-tuple (i, j). The keys for the dictionary are the 2-tuples (i, j) corresponding to boundary edges in the mesh, and the values are the tags are used to label them. In the present example, the value boundary[(i, j)] assigned to (i, j)] is one of the four tags ’left’, ’right’, ’top’ or ’bottom’, depending on whether the boundary edge represented by (i, j) occurs at the left, right, top or bottom of the rectangle bounding the mesh. The function rectangular automatically assigns these tags to the boundary edges when it generates the mesh. The tags provide the means to assign different boundary conditions to an edge depending on which part of the boundary it belongs to. (In Section 4.6 we describe an example that uses different boundary tags – in general, the possible tags are entirely selectable by the user when generating the mesh and not limited to ’left’, ’right’, ’top’ and ’bottom’ as in this example.) All segments in bounding polygon must be tagged. If a tag is not supplied, the default tag name ’exterior’ will be assigned by ANUGA . Using the boundary objects described above, we assign a boundary condition to each part of the boundary by means of a statement like: domain.set_boundary({’left’: Br, ’right’: Bw, ’top’: Br, ’bottom’: Br}) It is critical that all tags are associated with a boundary condition in this statement. If not the program will halt with a statement like: Traceback (most recent call last): File "mesh_test.py", line 114, in ? domain.set_boundary({’west’: Bi, ’east’: Bo, ’north’: Br, ’south’: Br}) File "X:\inundation\sandpits\onielsen\anuga_core\source\anuga\abstract_2d_finite_volumes\domai raise msg ERROR (domain.py): Tag "exterior" has not been bound to a boundary object. All boundary tags defined in domain must appear in the supplied dictionary. The tags are: [’ocean’, ’east’, ’north’, ’exterior’, ’south’] The command set_boundary stipulates that, in the current example, the right boundary varies with time, as defined by the lambda function, while the other boundaries are all reflective. The reader may wish to experiment by varying the choice of boundary types for one or more of the boundaries. (In the case of Bd and Bw, the three arguments in each case represent the stage, x-momentum and y-momentum, respectively.) Bw = anuga.Time_boundary(domain=domain, f=lambda t: [(0.1*sin(t*2*pi)-0.3), 0.0, 0.0]) 12 Chapter 4. Getting Started 4.1.8 Evolution The final statement: for t in domain.evolve(yieldstep=0.1, duration=10.0): print domain.timestepping_statistics() causes the configuration of the domain to ’evolve’, over a series of steps indicated by the values of yieldstep and duration, which can be altered as required. The value of yieldstep controls the time interval between successive model outputs. Behind the scenes more time steps are generally taken. 4.1.9 Output The output is a NetCDF file with the extension .sww. It contains stage and momentum information and can be used with the ANUGA viewer anuga_viewer to generate a visual display (see Section A.2). See Section 6.1 (page 63) for more on NetCDF and other file formats. The following is a listing of the screen output seen by the user when this example is run: $ python runup.py Time = 0.0000, steps=0 Time = 0.1000, delta t Time = 0.2000, delta t Time = 0.3000, delta t Time = 0.4000, delta t ... 4.2 (0) in [0.01373568, in [0.01203520, in [0.01144234, in [0.01141301, 0.01683588], 0.01357912], 0.01193508], 0.01152065], steps=7 steps=8 steps=9 steps=9 (7) (8) (9) (9) How to Run the Code The code can be run in various ways: • from a Windows or Unix command line as in python runup.py • within the Python IDLE environment • within emacs • within Windows, by double-clicking the runup.py file. 4.3 Exploring the Model Output The following figures are screenshots from the ANUGA visualisation tool anuga_viewer. Figure 4.1 shows the domain with water surface as specified by the initial condition, t = 0. Figure 4.2 shows later snapshots for t = 2.3 and t = 4 where the system has been evolved and the wave is encroaching on the previously dry bed. anuga_viewer is described in more detail in Section A.2. 4.2. How to Run the Code 13 Figure 4.1: Runup example viewed with the ANUGA viewer Figure 4.2: Runup example viewed with ANGUA viewer 14 Chapter 4. Getting Started 4.4 4.4.1 A slightly more complex example Overview The next example is about water-flow in a channel with varying boundary conditions and more complex topographies. These examples build on the concepts introduced through the ‘runup.py’ in Section 4.1. The example will be built up through three progressively more complex scripts. 4.4.2 Overview As in the case of ‘runup.py’, the actions carried out by the program can be organised according to this outline: 1. Set up a triangular mesh. 2. Set certain parameters governing the mode of operation of the model – specifying, for instance, where to store the model output. 3. Set up initial conditions for various quantities such as the elevation, to be specified at each mesh point (vertex). 4. Set up the boundary conditions. 5. Carry out the evolution of the model through a series of time steps and output the results, providing a results file that can be viewed. 4.4.3 The Code Here is the code for the first version of the channel flow ‘channel1.py’: """Simple water flow example using ANUGA Water flowing down a channel """ #-----------------------------------------------------------------------------# Import necessary modules #-----------------------------------------------------------------------------# Import standard shallow water domain and standard boundaries. import anuga #-----------------------------------------------------------------------------# Setup computational domain #-----------------------------------------------------------------------------points, vertices, boundary = anuga.rectangular_cross(10, 5, len1=10.0, len2=5.0) # Mesh domain = anuga.Domain(points, vertices, boundary) # Create domain domain.set_name(’channel1’) # Output name #-----------------------------------------------------------------------------# Setup initial conditions #-----------------------------------------------------------------------------def topography(x, y): return -x/10 # linear bed slope 4.4. A slightly more complex example 15 domain.set_quantity(’elevation’, topography) # Use function for elevation domain.set_quantity(’friction’, 0.01) # Constant friction domain.set_quantity(’stage’, # Dry bed expression=’elevation’) #-----------------------------------------------------------------------------# Setup boundary conditions #-----------------------------------------------------------------------------Bi = anuga.Dirichlet_boundary([0.4, 0, 0]) # Inflow Br = anuga.Reflective_boundary(domain) # Solid reflective wall domain.set_boundary({’left’: Bi, ’right’: Br, ’top’: Br, ’bottom’: Br}) #-----------------------------------------------------------------------------# Evolve system through time #-----------------------------------------------------------------------------for t in domain.evolve(yieldstep=0.2, finaltime=40.0): print domain.timestepping_statistics() In discussing the details of this example, we follow the outline given above, discussing each major step of the code in turn. 4.4.4 Establishing the Mesh In this example we use a similar simple structured triangular mesh as in ‘runup.py’ for simplicity, but this time we will use a symmetric one and also change the physical extent of the domain. The assignment: points, vertices, boundary = anuga.rectangular_cross(m, n, len1=length, len2=width) returns an mxn mesh similar to the one used in the previous example, except that now the extent in the x and y directions are given by the value of length and width respectively. Defining m and n in terms of the extent as in this example provides a convenient way of controlling the resolution: By defining dx and dy to be the desired size of each hypotenuse in the mesh we can write the mesh generation as follows: length = 10.0 width = 5.0 dx = dy = 1 # Resolution: Length of subdivisions on both axes points, vertices, boundary = anuga.rectangular_cross(int(length/dx), int(width/dy), len1=length, len2=width) which yields a mesh of length=10m, width=5m with 1m spacings. To increase the resolution, as we will later in this example, one merely decreases the values of dx and dy. The rest of this script is similar to the previous example on page 8. 4.5 Model Output The following figure is a screenshot from the ANUGA visualisation tool anuga_viewer of output from this example. 16 Chapter 4. Getting Started Figure 4.3: Simple channel example viewed with the ANUGA viewer. 4.5.1 Changing boundary conditions on the fly Here is the code for the second version of the channel flow ‘channel2.py’: """Simple water flow example using ANUGA Water flowing down a channel with changing boundary conditions """ #-----------------------------------------------------------------------------# Import necessary modules #-----------------------------------------------------------------------------import anuga #-----------------------------------------------------------------------------# Setup computational domain #-----------------------------------------------------------------------------length = 10. width = 5. dx = dy = 1 # Resolution: Length of subdivisions on both axes points, vertices, boundary = anuga.rectangular_cross(int(length/dx), int(width/dy), len1=length, len2=width) domain = anuga.Domain(points, vertices, boundary) domain.set_name(’channel2’) # Output name #-----------------------------------------------------------------------------# Setup initial conditions #-----------------------------------------------------------------------------def topography(x,y): return -x/10 # linear bed slope domain.set_quantity(’elevation’, topography) # Use function for elevation domain.set_quantity(’friction’, 0.01) # Constant friction 4.5. Model Output 17 domain.set_quantity(’stage’, expression=’elevation’) # Dry initial condition #-----------------------------------------------------------------------------# Setup boundary conditions #-----------------------------------------------------------------------------Bi = anuga.Dirichlet_boundary([0.4, 0, 0]) # Inflow Br = anuga.Reflective_boundary(domain) # Solid reflective wall Bo = anuga.Dirichlet_boundary([-5, 0, 0]) # Outflow domain.set_boundary({’left’: Bi, ’right’: Br, ’top’: Br, ’bottom’: Br}) #-----------------------------------------------------------------------------# Evolve system through time #-----------------------------------------------------------------------------for t in domain.evolve(yieldstep=0.2, finaltime=40.0): print domain.timestepping_statistics() if domain.get_quantity(’stage’).\ get_values(interpolation_points=[[10, 2.5]]) > 0: print ’Stage > 0: Changing to outflow boundary’ domain.set_boundary({’right’: Bo}) This example differs from the first version in that a constant outflow boundary condition has been defined: Bo = anuga.Dirichlet_boundary([-5, 0, 0]) # Outflow and that it is applied to the right hand side boundary when the water level there exceeds 0m. for t in domain.evolve(yieldstep=0.2, finaltime=40.0): domain.write_time() if domain.get_quantity(’stage’).get_values(interpolation_points=[[10, 2.5]]) > 0: print ’Stage > 0: Changing to outflow boundary’ domain.set_boundary({’right’: Bo}) The if statement in the timestepping loop (evolve) gets the quantity stage and obtains the interpolated value at the point (10m, 2.5m) which is on the right boundary. If the stage exceeds 0m a message is printed and the old boundary condition at tag ’right’ is replaced by the outflow boundary using the method: domain.set_boundary({’right’: Bo}) This type of dynamically varying boundary could for example be used to model the breakdown of a sluice door when water exceeds a certain level. 4.5.2 Output The text output from this example looks like this: 18 Chapter 4. Getting Started ... Time = 15.4000, delta t in [0.03789902, Time = 15.6000, delta t in [0.03789896, Time = 15.8000, delta t in [0.03789891, Stage > 0: Changing to outflow boundary Time = 16.0000, delta t in [0.02709050, Time = 16.2000, delta t in [0.03789892, ... 4.5.3 0.03789916], steps=6 (6) 0.03789908], steps=6 (6) 0.03789903], steps=6 (6) 0.03789898], steps=6 (6) 0.03789904], steps=6 (6) Flow through more complex topographies Here is the code for the third version of the channel flow ‘channel3.py’: """Simple water flow example using ANUGA Water flowing down a channel with more complex topography """ #-----------------------------------------------------------------------------# Import necessary modules #-----------------------------------------------------------------------------import anuga #-----------------------------------------------------------------------------# Setup computational domain #-----------------------------------------------------------------------------length = 40. width = 5. dx = dy = .1 # Resolution: Length of subdivisions on both axes points, vertices, boundary = anuga.rectangular_cross(int(length/dx), int(width/dy), len1=length, len2=width) domain = anuga.Domain(points, vertices, boundary) domain.set_name(’channel3’) # Output name print domain.statistics() #-----------------------------------------------------------------------------# Setup initial conditions #-----------------------------------------------------------------------------def topography(x,y): """Complex topography defined by a function of vectors x and y.""" z = -x/10 N = len(x) for i in range(N): # Step if 10 < x[i] < 12: z[i] += 0.4 - 0.05*y[i] # Constriction if 27 < x[i] < 29 and y[i] > 3: z[i] += 2 # Pole 4.5. Model Output 19 if (x[i] - 34)**2 + (y[i] - 2)**2 < 0.4**2: z[i] += 2 return z domain.set_quantity(’elevation’, topography) domain.set_quantity(’friction’, 0.01) domain.set_quantity(’stage’, expression=’elevation’) # elevation is a function # Constant friction # Dry initial condition #-----------------------------------------------------------------------------# Setup boundary conditions #-----------------------------------------------------------------------------Bi = anuga.Dirichlet_boundary([0.4, 0, 0]) # Inflow Br = anuga.Reflective_boundary(domain) # Solid reflective wall Bo = anuga.Dirichlet_boundary([-5, 0, 0]) # Outflow domain.set_boundary({’left’: Bi, ’right’: Bo, ’top’: Br, ’bottom’: Br}) #-----------------------------------------------------------------------------# Evolve system through time #-----------------------------------------------------------------------------for t in domain.evolve(yieldstep=0.1, finaltime=16.0): print domain.timestepping_statistics() if domain.get_quantity(’stage’).\ get_values(interpolation_points=[[10, 2.5]]) > 0: print ’Stage > 0: Changing to outflow boundary’ domain.set_boundary({’right’: Bo}) This example differs from the first two versions in that the topography contains obstacles. This is accomplished here by defining the function topography as follows: def topography(x,y): """Complex topography defined by a function of vectors x and y.""" z = -x/10 N = len(x) for i in range(N): # Step if 10 < x[i] < 12: z[i] += 0.4 - 0.05*y[i] # Constriction if 27 < x[i] < 29 and y[i] > 3: z[i] += 2 # Pole if (x[i] - 34)**2 + (y[i] - 2)**2 < 0.4**2: z[i] += 2 return z In addition, changing the resolution to dx = dy = 0.1 creates a finer mesh resolving the new features better. A screenshot of this model at time 15s is: 20 Chapter 4. Getting Started Figure 4.4: More complex flow in a channel 4.6 An Example with Real Data The following discussion builds on the concepts introduced through the ‘runup.py’ example and introduces a second example, ‘runcairns.py’. This refers to a hypothetical scenario using real-life data, in which the domain of interest surrounds the Cairns region. Two scenarios are given; firstly, a hypothetical tsunami wave is generated by a submarine mass failure situated on the edge of the continental shelf, and secondly, a fixed wave of given amplitude and period is introduced through the boundary. Each scenario has been designed to generate a tsunami which will inundate the Cairns region. To achieve this, suitably large parameters were chosen and were not based on any known tsunami sources or realistic amplitudes. 4.6.1 Overview As in the case of ‘runup.py’, the actions carried out by the program can be organised according to this outline: 1. Set up a triangular mesh. 2. Set certain parameters governing the mode of operation of the model – specifying, for instance, where to store the model output. 3. Input various quantities describing physical measurements, such as the elevation, to be specified at each mesh point (vertex). 4. Set up the boundary conditions. 5. Carry out the evolution of the model through a series of time steps and output the results, providing a results file that can be visualised. 4.6.2 The Code Here is the code for ‘runcairns.py’: 4.6. An Example with Real Data 21 """Script for running a tsunami inundation scenario for Cairns, QLD Australia. Source data such as elevation and boundary data is assumed to be available in directories specified by project.py The output sww file is stored in directory named after the scenario, i.e slide or fixed_wave. The scenario is defined by a triangular mesh created from project.polygon, the elevation data and a tsunami wave generated by a submarine mass failure. Geoscience Australia, 2004-present """ #-----------------------------------------------------------------------------# Import necessary modules #-----------------------------------------------------------------------------# Standard modules import os import time import sys # Related major packages import anuga # Application specific imports import project # Definition of file names and polygons #-----------------------------------------------------------------------------# Preparation of topographic data # Convert ASC 2 DEM 2 PTS using source data and store result in source data #-----------------------------------------------------------------------------# Create DEM from asc data anuga.asc2dem(project.name_stem+’.asc’, use_cache=True, verbose=True) # Create pts file for onshore DEM anuga.dem2pts(project.name_stem+’.dem’, use_cache=True, verbose=True) #-----------------------------------------------------------------------------# Create the triangular mesh and domain based on # overall clipping polygon with a tagged # boundary and interior regions as defined in project.py #-----------------------------------------------------------------------------domain = anuga.create_domain_from_regions(project.bounding_polygon, boundary_tags={’top’: [0], ’ocean_east’: [1], ’bottom’: [2], ’onshore’: [3]}, maximum_triangle_area=project.default_res, mesh_filename=project.meshname, interior_regions=project.interior_regions, use_cache=True, verbose=True) # Print some stats about mesh and domain print ’Number of triangles = ’, len(domain) print ’The extent is ’, domain.get_extent() print domain.statistics() #------------------------------------------------------------------------------ 22 Chapter 4. Getting Started # Setup parameters of computational domain #-----------------------------------------------------------------------------domain.set_name(’cairns_’ + project.scenario) # Name of sww file domain.set_datadir(’.’) # Store sww output here domain.set_minimum_storable_height(0.01) # Store only depth > 1cm #-----------------------------------------------------------------------------# Setup initial conditions #-----------------------------------------------------------------------------tide = 0.0 domain.set_quantity(’stage’, tide) domain.set_quantity(’friction’, 0.0) domain.set_quantity(’elevation’, filename=project.name_stem + ’.pts’, use_cache=True, verbose=True, alpha=0.1) #-----------------------------------------------------------------------------# Setup information for slide scenario (to be applied 1 min into simulation #-----------------------------------------------------------------------------if project.scenario == ’slide’: # Function for submarine slide tsunami_source = anuga.slide_tsunami(length=35000.0, depth=project.slide_depth, slope=6.0, thickness=500.0, x0=project.slide_origin[0], y0=project.slide_origin[1], alpha=0.0, domain=domain, verbose=True) #-----------------------------------------------------------------------------# Setup boundary conditions #-----------------------------------------------------------------------------print ’Available boundary tags’, domain.get_boundary_tags() Bd = anuga.Dirichlet_boundary([tide, 0, 0]) # Mean water level Bs = anuga.Transmissive_stage_zero_momentum_boundary(domain) # Neutral boundary if project.scenario == ’fixed_wave’: # Huge 50m wave starting after 60 seconds and lasting 1 hour. Bw = anuga.Time_boundary(domain=domain, function=lambda t: [(60<t<3660)*50, 0, 0]) domain.set_boundary({’ocean_east’: Bw, ’bottom’: Bs, ’onshore’: Bd, ’top’: Bs}) if project.scenario == ’slide’: # Boundary conditions for slide scenario domain.set_boundary({’ocean_east’: Bd, ’bottom’: Bd, ’onshore’: Bd, ’top’: Bd}) #-----------------------------------------------------------------------------# Evolve system through time 4.6. An Example with Real Data 23 #-----------------------------------------------------------------------------import time t0 = time.time() from numpy import allclose if project.scenario == ’slide’: # Initial run without any event for t in domain.evolve(yieldstep=10, finaltime=60): print domain.timestepping_statistics() print domain.boundary_statistics(tags=’ocean_east’) # Add slide to water surface if allclose(t, 60): domain.add_quantity(’stage’, tsunami_source) # Continue propagating wave for t in domain.evolve(yieldstep=10, finaltime=5000, skip_initial_step=True): print domain.timestepping_statistics() print domain.boundary_statistics(tags=’ocean_east’) if project.scenario == ’fixed_wave’: # Save every two mins leading up to wave approaching land for t in domain.evolve(yieldstep=120, finaltime=5000): print domain.timestepping_statistics() print domain.boundary_statistics(tags=’ocean_east’) # Save every 30 secs as wave starts inundating ashore for t in domain.evolve(yieldstep=10, finaltime=10000, skip_initial_step=True): print domain.timestepping_statistics() print domain.boundary_statistics(tags=’ocean_east’) print ’That took %.2f seconds’ %(time.time()-t0) In discussing the details of this example, we follow the outline given above, discussing each major step of the code in turn. 4.6.3 Establishing the Mesh One obvious way that the present example differs from ‘runup.py’ is in the use of a more complex method to create the mesh. Instead of imposing a mesh structure on a rectangular grid, the technique used for this example involves building mesh structures inside polygons specified by the user, using a mesh-generator. The mesh-generator creates the mesh within a single polygon whose vertices are at geographical locations specified by the user. The user specifies the resolution – that is, the maximal area of a triangle used for triangulation – and a triangular mesh is created inside the polygon using a mesh generation engine. On any given platform, the same mesh will be returned each time the script is run. Boundary tags are not restricted to ’left’, ’bottom’, ’right’ and ’top’, as in the case of ‘runup.py’. Instead the user specifies a list of tags appropriate to the configuration being modelled. In addition, the mesh-generator provides a way to adapt to geographic or other features in the landscape, whose presence may require an increase in resolution. This is done by allowing the user to specify a number of interior polygons, each with a specified resolution. It is also possible to specify one or more ’holes’ – that is, areas bounded by polygons in which no triangulation is required. 24 Chapter 4. Getting Started In its general form, the mesh-generator takes for its input a bounding polygon and (optionally) a list of interior polygons. The user specifies resolutions, both for the bounding polygon and for each of the interior polygons. Given this data, the mesh-generator first creates a triangular mesh with varying resolution. The function used to implement this process is create_domain_from_regions which creates a Domain object as well as a mesh file. Its arguments include the bounding polygon and its resolution, a list of boundary tags, and a list of pairs [polygon, resolution] specifying the interior polygons and their resolutions. The resulting mesh is output to a mesh file. This term is used to describe a file of a specific format used to store the data specifying a mesh. (There are in fact two possible formats for such a file: it can either be a binary file, with extension .msh, or an ASCII file, with extension .tsh. In the present case, the binary file format .msh is used. See Section 6.1 (page 63) for more on file formats. In practice, the details of the polygons used are read from a separate file ‘project.py’. Here is a complete listing of ‘project.py’: """ Common filenames and locations for topographic data, meshes and outputs. This file defines the parameters of the scenario you wish to run. """ import anuga #-----------------------------------------------------------------------------# Define scenario as either slide or fixed_wave. Choose one. #-----------------------------------------------------------------------------scenario = ’fixed_wave’ # Huge wave applied at the boundary #scenario = ’slide’ # Slide wave form applied inside the domain #-----------------------------------------------------------------------------# Filenames #-----------------------------------------------------------------------------name_stem = ’cairns’ meshname = name_stem + ’.msh’ # Filename for locations where timeseries are to be produced gauge_filename = ’gauges.csv’ #-----------------------------------------------------------------------------# Domain definitions #-----------------------------------------------------------------------------# bounding polygon for study area bounding_polygon = anuga.read_polygon(’extent.csv’) A = anuga.polygon_area(bounding_polygon) / 1000000.0 print ’Area of bounding polygon = %.2f kmˆ2’ % A #-----------------------------------------------------------------------------# Interior region definitions #-----------------------------------------------------------------------------# Read interior polygons poly_cairns = anuga.read_polygon(’cairns.csv’) poly_island0 = anuga.read_polygon(’islands.csv’) poly_island1 = anuga.read_polygon(’islands1.csv’) poly_island2 = anuga.read_polygon(’islands2.csv’) poly_island3 = anuga.read_polygon(’islands3.csv’) poly_shallow = anuga.read_polygon(’shallow.csv’) # Optionally plot points making up these polygons #plot_polygons([bounding_polygon, poly_cairns, poly_island0, poly_island1, 4.6. An Example with Real Data 25 # # poly_island2, poly_island3, poly_shallow], style=’boundingpoly’, verbose=False) # Define resolutions (max area per triangle) for each polygon # Make these numbers larger to reduce the number of triangles in the model, # and hence speed up the simulation default_res = 10000000 # Background resolution islands_res = 100000 cairns_res = 100000 shallow_res = 500000 # Define list of interior regions with associated resolutions interior_regions = [[poly_cairns, cairns_res], [poly_island0, islands_res], [poly_island1, islands_res], [poly_island2, islands_res], [poly_island3, islands_res], [poly_shallow, shallow_res]] #-----------------------------------------------------------------------------# Data for exporting ascii grid #-----------------------------------------------------------------------------eastingmin = 363000 eastingmax = 418000 northingmin = 8026600 northingmax = 8145700 #-----------------------------------------------------------------------------# Data for landslide #-----------------------------------------------------------------------------slide_origin = [451871, 8128376] # Assume to be on continental shelf slide_depth = 500. Figure 4.5 illustrates the landscape of the region for the Cairns example. Understanding the landscape is important in determining the location and resolution of interior polygons. The supporting data is found in the ASCII grid, cairns.asc, which has been sourced from the publically available Australian Bathymetry and Topography Grid 2005, [grid250]. The required resolution for inundation modelling will depend on the underlying topography and bathymetry; as the terrain becomes more complex, the desired resolution would decrease to the order of tens of metres. 26 Chapter 4. Getting Started Figure 4.5: Landscape of the Cairns scenario. The following statements are used to read in the specific polygons from project.cairns and assign a defined resolution to each polygon. islands_res = 100000 cairns_res = 100000 shallow_res = 500000 interior_regions = [[project.poly_cairns, [project.poly_island0, [project.poly_island1, [project.poly_island2, [project.poly_island3, [project.poly_shallow, cairns_res], islands_res], islands_res], islands_res], islands_res], shallow_res]] Figure 4.6 illustrates the polygons used for the Cairns scenario. 4.6. An Example with Real Data 27 Figure 4.6: Interior and bounding polygons for the Cairns example. The statement: remainder_res = 10000000 domain = anuga.create_domain_from_regions(project.bounding_polygon, boundary_tags={’top’: [0], ’ocean_east’: [1], ’bottom’: [2], ’onshore’: [3]}, maximum_triangle_area=project.default_res, mesh_filename=project.meshname, interior_regions=project.interior_regions, use_cache=True, verbose=True) is then used to create the mesh, taking the bounding polygon to be the polygon bounding_polygon specified in ‘project.py’. The argument boundary_tags assigns a dictionary, whose keys are the names of the boundary tags used for the bounding polygon – ’top’, ’ocean_east’, ’bottom’, and ’onshore’ – and whose values identify the indices of the segments associated with each of these tags. The polygon may be arranged either clock-wise or counter clock-wise and the indices refer to edges in the order they appear: Edge 0 connects vertex 0 and vertex 1, edge 1 connects vertex 1 and 2; and so forth. (Here, the values associated with each boundary tag are one-element lists, but they can have as many indices as there are edges) If polygons intersect, or edges coincide (or are even very close) the resolution may be undefined in some regions. Use the underlying mesh interface for such cases (see Chapter 5.2). If a segment is omitted in the tags definition an Exception is raised. Note that every point on each polygon defining the mesh will be used as vertices in triangles. Consequently, polygons with points very close together will cause triangles with very small areas to be generated irrespective of the requested resolution. Make sure points on polygons are spaced to be no closer than the smallest resolution requested. 28 Chapter 4. Getting Started 4.6.4 Initialising the Domain Since we used create_domain_from_regions to create the mesh file, we do not need to create the domain explicitly, as the above function does both mesh and domain creation. The following statements specify a basename and data directory, and sets a minimum storable height, which helps with visualisation and post-processing if one wants to remove water less than 1cm deep (for instance). domain.set_name(’cairns_’ + project.scenario) # Name of SWW file domain.set_datadir(’.’) # Store SWW output here domain.set_minimum_storable_height(0.01) # Store only depth > 1cm 4.6.5 Initial Conditions Quantities for ‘runcairns.py’ are set using similar methods to those in ‘runup.py’. However, in this case, many of the values are read from the auxiliary file ‘project.py’ or, in the case of elevation, from an auxiliary points file. 4.6.5.1 Stage The stage is initially set to 0.0 (i.e. Mean Sea Level) by the following statements: tide = 0.0 domain.set_quantity(’stage’, tide) It could also take the value of the highest astronomical tide. 4.6.5.2 Friction We assign the friction exactly as we did for ‘runup.py’: domain.set_quantity(’friction’, 0.0) 4.6.5.3 Elevation The elevation is specified by reading data from a file with a name derived from project.demname with the .pts extension: domain.set_quantity(’elevation’, filename=project.demname + ’.pts’, use_cache=True, verbose=True, alpha=0.1) The alpha parameter controls how smooth the elevation surface should be. See section A.7, page 88. Setting cache=True allows ANUGA to save the result in order to make subsequent runs faster. Using verbose=True tells the function to write diagnostics to the screen. 4.6. An Example with Real Data 29 4.6.6 Boundary Conditions Setting boundaries follows a similar pattern to the one used for ‘runup.py’, except that in this case we need to associate a boundary type with each of the boundary tag names introduced when we established the mesh. In place of the four boundary types introduced for ‘runup.py’, we use the reflective boundary for each of the tagged segments defined by create_domain_from_regions: Bd = anuga.Dirichlet_boundary([tide,0,0]) # Mean water level Bs = anuga.Transmissive_stage_zero_momentum_boundary(domain) # Neutral boundary if project.scenario == ’fixed_wave’: # Huge 50m wave starting after 60 seconds and lasting 1 hour. Bw = anuga.Time_boundary(domain=domain, function=lambda t: [(60<t<3660)*50, 0, 0]) domain.set_boundary({’ocean_east’: Bw, ’bottom’: Bs, ’onshore’: Bd, ’top’: Bs}) if project.scenario == ’slide’: # Boundary conditions for slide scenario domain.set_boundary({’ocean_east’: Bd, ’bottom’: Bd, ’onshore’: Bd, ’top’: Bd}) Note that we use different boundary conditions depending on the scenario defined in ‘project.py’. It is not a requirement in ANUGA to have this code structure, just an example of how the script can take different actions depending on a variable. 4.6.7 Evolution With the basics established, the running of the ’evolve’ step is very similar to the corresponding step in ‘runup.py’, except we have different evolve loops for the two scenarios. For the slide scenario, the simulation is run for an intial 60 seconds, at which time the slide occurs. We use the function tsunami_source to adjust stage values. We then run the simulation until 5000 seconds with the output stored every ten seconds: 30 Chapter 4. Getting Started if project.scenario == ’slide’: # Initial run without any event for t in domain.evolve(yieldstep=10, finaltime=60): print domain.timestepping_statistics() print domain.boundary_statistics(tags=’ocean_east’) # Add slide to water surface if allclose(t, 60): domain.add_quantity(’stage’, tsunami_source) # Continue propagating wave for t in domain.evolve(yieldstep=10, finaltime=5000, skip_initial_step=True): print domain.timestepping_statistics() print domain.boundary_statistics(tags=’ocean_east’) if project.scenario == ’fixed_wave’: # Save every two mins leading up to wave approaching land for t in domain.evolve(yieldstep=120, finaltime=5000): print domain.timestepping_statistics() print domain.boundary_statistics(tags=’ocean_east’) # Save every 30 secs as wave starts inundating ashore for t in domain.evolve(yieldstep=10, finaltime=10000, skip_initial_step=True): print domain.timestepping_statistics() print domain.boundary_statistics(tags=’ocean_east’) For the fixed wave scenario, the simulation is run to 10000 seconds, with the first half of the simulation stored at two minute intervals, and the second half of the simulation stored at ten second intervals. This functionality is especially convenient as it allows the detailed parts of the simulation to be viewed at higher time resolution. This also demonstrates the ability of ANUGA to dynamically override values. The method add_quantity() works like set_quantity() except that it adds the new surface to what exists already. In this case it adds the initial shape of the water displacement to the water level. 4.7 Exploring the Model Output Now that the scenario has been run, the user can view the output in a number of ways. As described earlier, the user may run anuga_viewer to view a three-dimensional representation of the simulation. The user may also be interested in a maximum inundation map. This simply shows the maximum water depth over the domain and is achieved with the function sww2dem described in Section 6.1.9). ‘ExportResults.py’ demonstrates how this function can be used: import os import sys import project import anuga scenario = ’slide’ name = ’cairns_’ + scenario print ’output dir:’, name 4.7. Exploring the Model Output 31 which_var = 3 if which_var == 0: # Stage outname = name + ’_stage’ quantityname = ’stage’ if which_var == 1: # Absolute Momentum outname = name + ’_momentum’ quantityname = ’(xmomentum**2 + ymomentum**2)**0.5’ if which_var == 2: # Depth outname = name + ’_depth’ quantityname = ’stage-elevation’ #Absolute momentum #Depth if which_var == 3: # Speed outname = name + ’_speed’ quantityname = ’(xmomentum**2 + ymomentum**2)**0.5/(stage-elevation+1.e-30)’ if which_var == 4: # Elevation outname = name + ’_elevation’ quantityname = ’elevation’ #Elevation print ’start sww2dem’ anuga.sww2dem(name+’.sww’, outname+’.asc’, quantity=quantityname, cellsize=100, easting_min=project.eastingmin, easting_max=project.eastingmax, northing_min=project.northingmin, northing_max=project.northingmax, reduction=max, verbose=True) The script generates a maximum water depth ASCII grid at a defined resolution (here 100 m2 ) which can then be viewed in a GIS environment, for example. The parameters used in the function are defined in ‘project.py’. Figures 4.7 and 4.8 show the maximum water depth within the defined region for the slide and fixed wave scenario respectively. Note, these inundation maps have been based on purely hypothetical scenarios and were designed explicitly for demonstration purposes only. The user could develop a maximum absolute momentum or other expressions which can be derived from the quantities. It must be noted here that depth is more meaningful when the elevation is positive (depth = stage − elevation) as it describes the water height above the available elevation. When the elevation is negative, depth is meauring the water height from the sea floor. With this in mind, maximum inundation maps are typically ”clipped” to the coastline. However, the data input here did not contain a coastline. 32 Chapter 4. Getting Started #Speed Figure 4.7: Maximum inundation map for the Cairns slide scenario. Note, this inundation map has been based on a purely hypothetical scenario which was designed explictiy for demonstration purposes only. 4.7. Exploring the Model Output 33 Figure 4.8: Maximum inundation map for the Cairns fixed wave scenario. Note, this inundation map has been based on a purely hypothetical scenario which was designed explictiy for demonstration purposes only. 34 Chapter 4. Getting Started The user may also be interested in interrogating the solution at a particular spatial location to understand the behaviour of the system through time. To do this, the user must first define the locations of interest. A number of locations have been identified for the Cairns scenario, as shown in Figure 4.9. Figure 4.9: Point locations to show time series information for the Cairns scenario. These locations must be stored in either a .csv or .txt file. The corresponding .csv file for the gauges shown in Figure 4.9 is ‘gauges.csv’: easting,northing,name,elevation 367622.63,8128196.42,Cairns,0 360245.11,8142280.78,Trinity Beach,0 386133.51,8131751.05,Cairns Headland,0 430250,8128812.23,Elford Reef,0 367771.61,8133933.82,Cairns Airport,0 Header information has been included to identify the location in terms of eastings and northings, and each gauge is given a name. The elevation column can be zero here. This information is then passed to the function sww2csv_gauges (shown in ‘GetTimeseries.py’ which generates the csv files for each point location. The CSV files can then be used in csv2timeseries_graphs to create the timeseries plot for each desired quantity. csv2timeseries_graphs relies on pylab to be installed which is not part of the standard anuga release, however it can be downloaded and installed from http://matplotlib.sourceforge.net/ """ Generate time series of nominated "gauges" read from project.gauge_filename. This is done by first running sww2csv_gauges on two different directories to make ’csv’ files. Then running csv2timeseries_graphs detailing the two directories containing the csv file and produces one set of graphs in the ’output_dir’ containing 4.7. Exploring the Model Output 35 the details at the gauges for both these sww files. Note, this script will only work if pylab is installed on the platform """ from os import sep import project import anuga anuga.sww2csv_gauges(’cairns_slide.sww’, project.gauge_filename, quantities=[’stage’,’speed’,’depth’,’elevation’], verbose=True) anuga.sww2csv_gauges(’cairns_fixed_wave.sww’, project.gauge_filename, quantities=[’stage’, ’speed’,’depth’,’elevation’], verbose=True) try: import pylab anuga.csv2timeseries_graphs(directories_dic={’slide’+sep: [’Slide’,0, 0], ’fixed_wave’+sep: [’Fixed Wave’,0,0]}, output_dir=’fixed_wave’+sep, base_name=’gauge_’, plot_numbers=’’, quantities=[’stage’,’speed’,’depth’], extra_plot_name=’’, assess_all_csv_files=True, create_latex=False, verbose=True) except ImportError: #ANUGA does not rely on pylab to work print ’must have pylab installed to generate plots’ Here, the time series for the quantities stage, depth and speed will be generated for each gauge defined in the gauge file. As described earlier, depth is more meaningful for onshore gauges, and stage is more appropriate for offshore gauges. As an example output, Figure 4.10 shows the time series for the quantity stage for the Elford Reef location for each scenario (the elevation at this location is negative, therefore stage is the more appropriate quantity to plot). Note the large negative stage value when the slide was introduced. This is due to the double Gaussian form of the initial surface displacement of the slide. By contrast, the time series for depth is shown for the onshore location of the Cairns Airport in Figure 4.11. 36 Chapter 4. Getting Started Figure 4.10: Time series information of the quantity stage for the Elford Reef location for the fixed wave and slide scenario. 4.7. Exploring the Model Output 37 Figure 4.11: Time series information of the quantity depth for the Cairns Airport location for the slide and fixed wave scenario. 38 Chapter 4. Getting Started CHAPTER FIVE ANUGA Public Interface This chapter gives an overview of the features of ANUGA available to the user at the public interface. These are grouped under the following headings, which correspond to the outline of the examples described in Chapter 4: • Establishing the Mesh: Section 5.3 • Initialising the Domain: Section 5.4 • Initial Conditions: Section 5.5 • Boundary Conditions: Section 5.6 • Forcing Terms: Section 5.7 • Evolution: Section 5.8 5.1 Documentation The listings here are intended merely to give the reader an idea of what each feature is and how it can be used – they do not give full specifications; for these the reader may consult the programmer’s guide. The code for every function or class contains a documentation string, or ’docstring’, that specifies the precise syntax for its use. This appears immediately after the line introducing the code, between two sets of triple quotes. Python has a handy tool that lets you easily navigate this documentation, called pydoc. In Linux, it runs as a server, which serves the documentation up to your web browser: 1. Open a terminal at your anuga_source/anuga folder 2. Start the python documentation server with pydoc -p 6767 3. Open a browser and type in http://localhost:6767/ Now you have a real-time programmers’ guide for ANUGA , and an easy way to find the functions you are interested in. Pydoctor and other Python doc generators look nicer and have graphs, etc, but pydoc works straight out of the box. 5.2 Public vs Private Interface To simplify the process of writing scripts, ANUGA has a public API which packages up all the commonly-used functionality of ANUGA in the one place. To use it, simply import the anuga module like so: import anuga You can now use the public API like so. Note the anuga. prefix: 39 anuga.sww2dem(’in.sww’, ’out.asc’) If you wish to delve ”under the hood” and modify the way ANUGA runs at a more advanced level, you need to specify the full location of the module like so: from anuga.fit_interpolate.interpolate import Interpolation_interface All modules are in the folder ‘inundation’ or one of its subfolders, and the location of each module is described relative to ‘inundation’. Rather than using pathnames, whose syntax depends on the operating system, we use the format adopted for importing the function or class for use in Python code. For example, suppose we wish to specify that the function create_mesh_from_regions is in a module called mesh_interface in a subfolder of inundation called pmesh. In Linux or Unix syntax, the pathname of the file containing the function, relative to ‘inundation’, would be: pmesh/mesh_interface.py while in Windows syntax it would be: pmesh\mesh_interface.py Rather than using either of these forms, in this chapter we specify the location simply as anuga.pmesh.mesh_interface, in keeping with the usage in the Python statement for importing the function, namely: from anuga.pmesh.mesh_interface import create_mesh_from_regions The following parameters are common to many functions and classes and are omitted from the descriptions given below: use cache verbose 5.3 Specifies whether caching is to be used for improved performance. See Section A.1 for details on the underlying caching functionality If True, provides detailed terminal output to the user Mesh Generation Before discussing the part of the interface relating to mesh generation, we begin with a description of a simple example of a mesh and use it to describe how mesh data is stored. Figure 5.1 represents a very simple mesh comprising just 11 points and 10 triangles. 40 Chapter 5. ANUGA Public Interface Figure 5.1: A simple mesh 5.3. Mesh Generation 41 The variables points, triangles and boundary represent the data displayed in Figure 5.1 as follows. The list points stores the coordinates of the points, and may be displayed schematically as in Table 5.1. index 0 1 2 3 4 5 6 7 8 9 10 x 1 4 8 1 5 8 11 3 1 4 10 y 1 2 1 3 5 6 5 6 8 9 7 Table 5.1: Point coordinates for mesh in Figure 5.1 The list triangles specifies the triangles that make up the mesh. It does this by specifying, for each triangle, the indices (the numbers shown in the first column above) that correspond to the three points at the triangles vertices, taken in an anti-clockwise order around the triangle. Thus, in the example shown in Figure 5.1, the variable triangles contains the entries shown in Table 5.2. The starting point is arbitrary so triangle (0, 1, 3) is considered the same as (1, 3, 0) and (3, 0, 1). index 0 1 2 3 4 5 6 7 8 9 points 0 1 3 1 2 4 2 5 4 2 6 5 4 5 9 4 9 7 3 4 7 7 9 8 1 4 3 5 10 9 Table 5.2: Triangles for mesh in Figure 5.1 Finally, the variable boundary identifies the boundary triangles and associates a tag with each. create_mesh_from_regions(bounding polygon, boundary tags, maximum triangle area=None, filename=None, interior regions=None, interior holes=None, hole tags=None, poly geo reference=None, mesh geo reference=None, minimum triangle angle=28.0, fail if polygons outside=True, breaklines=None, use cache=False, verbose=True) Module: pmesh.mesh_interface This function allows a user to initiate the automatic creation of a mesh inside a specified polygon (input bounding_polygon). Among the parameters that can be set are the resolution (maximal area for any triangle in the mesh) and the minimal angle allowable in any triangle. The user can specify a number of internal polygons within each of which the resolution of the mesh can be specified. interior_regions is a paired list containing the interior polygon and its resolution. Additionally, the user specifies a list of boundary tags, one for each edge of the bounding polygon. 42 Chapter 5. ANUGA Public Interface breaklines lets you force a split along a boundary within the mesh. For example, a kerb or the edge of a dyke could be specified here. (new in 1.2) interior_holes lets you specify polygons as empty holes in the mesh. This can be used to represent buildings, pylons and other immovable structures. These polygons do not need to be closed, but their points must be specified in a counter-clockwise order.(new in 1.2) WARNING. Note that the dictionary structure used for the parameter boundary_tags is different from that used for the variable boundary that occurs in the specification of a mesh. In the case of boundary, the tags are the values of the dictionary, whereas in the case of boundary_tags, the tags are the keys and the value corresponding to a particular tag is a list of numbers identifying boundary edges labelled with that tag. Because of this, it is theoretically possible to assign the same edge to more than one tag. However, an attempt to do this will cause an error. WARNING. Do not have polygon lines cross or be on-top of each other. This can result in regions of unspecified resolutions, and ANUGA will give you an error. Do not have polygon close to each other. This can result in the area between the polygons having small triangles. For more control over the mesh outline use the methods described below. create_domain_from_regions(bounding polygon, boundary tags, maximum triangle area=None, mesh filename=None, interior regions=None, interior holes=None, poly geo reference=None, mesh geo reference=None, minimum triangle angle=28.0, fail if polygons outside=True, use cache=False, verbose=True) Module: interface.py This higher-level function allows a user to create a domain (and associated mesh) inside a specified polygon. bounding_polygon is a list of points in Eastings and Northings, relative to the zone stated in poly_geo_reference if specified. Otherwise points are just x, y coordinates with no particular association to any location. boundary_tags is a dictionary of symbolic tags. For every tag there is a list of indices referring to segments associated with that tag. If a segment is omitted it will be assigned the default tag ”. maximum_triangle_area is the maximal area per triangle for the bounding polygon, excluding the interior regions. interior_holes lets you specify polygons as empty holes in the mesh. This can be used to represent buildings, pylons and other immovable structures. These polygons do not need to be closed, but their points must be specified in a counter-clockwise order.(new in 1.2) mesh_filename is the name of the file to contain the generated mesh data. interior_regions is a list of tuples consisting of (polygon, resolution) for each region to be separately refined. Do not have polygon lines cross or be on-top of each other. Also do not have polygons close to each other. poly_geo_reference is the geo reference of the bounding polygon and the interior polygons. If none, assume absolute. Please pass one though, since absolute references have a zone. mesh_geo_reference is the geo reference of the mesh to be created. If none is given one will be automatically generated. It will use the lower left hand corner of bounding polygon (absolute) as the x and y values for the geo ref. minimum_triangle_angle is the minimum angle allowed for each generated triangle. This controls the slimness allowed for a triangle. fail_if_polygons_outside – if True (the default) an Exception in thrown if interior polygons fall outside the bounding polygon. If False, these will be ignored and execution continues. WARNING. Note that the dictionary structure used for the parameter boundary_tags is different from that used for the variable boundary that occurs in the specification of a mesh. In the case of boundary, the tags are the values of the dictionary, whereas in the case of boundary_tags, the tags are the keys and the value corresponding to a particular tag is a list of numbers identifying boundary edges labelled with that tag. Because 5.3. Mesh Generation 43 of this, it is theoretically possible to assign the same edge to more than one tag. However, an attempt to do this will cause an error. WARNING. Do not have polygon lines cross or be on-top of each other. This can result in regions of unspecified resolutions. Do not have polygon close to each other. This can result in the area between the polygons having small triangles. For more control over the mesh outline use the methods described below. 5.3.1 Advanced mesh generation For more control over the creation of the mesh outline, use the methods of the class Mesh. class Mesh(userSegments=None, userVertices=None, holes=None, regions=None, geo reference=None) Module: pmesh.mesh A class used to build a mesh outline and generate a two-dimensional triangular mesh. The mesh outline is used to describe features on the mesh, such as the mesh boundary. Many of this class’s methods are used to build a mesh outline, such as add_vertices() and add_region_from_polygon(). userSegments and userVertices define the outline enclosing the mesh. holes describes any regions inside the mesh that are not to be included in the mesh. geo_reference defines the geo reference to which all point information is relative. If geo_reference is None then the default geo reference is used. 5.3.1.1 Key Methods of Class Mesh <mesh>.add_hole(x, y, geo reference=None) Module: pmesh.mesh This method adds a hole to the mesh outline. x and y define a point on the already defined hole boundary. If geo_reference is not supplied the points are assumed to be absolute. <mesh>.add_hole_from_polygon(polygon, segment tags=None, geo reference=None) Module: pmesh.mesh This method is used to add a ’hole’ within a region – that is, to define a interior region where the triangular mesh will not be generated – to a Mesh instance. The region boundary is described by the polygon passed in. Additionally, the user specifies a list of boundary tags, one for each edge of the bounding polygon. polygon is the polygon that defines the hole to be added to the <mesh>. segment_tags – ?? If geo_reference is None then the default geo_reference is used. <mesh>.add_points_and_segments(points, segments=None, segment tags=None) Module: pmesh.mesh This adds points and segments connecting the points to a mesh. points is a list of points. segments is a list of segments. Each segment is defined by the start and end of the line by its point index, e.g. use segments = [[0,1],[1,2]] to make a polyline between points 0, 1 and 2. segment_tags may be used to optionally define a tag for each segment. <mesh>.add_region(x,y, geo reference=None, tag=None) Module: pmesh.mesh This method adds a region to a mesh outline. x and y define a point on the already-defined region that is to be added to the mesh. 44 Chapter 5. ANUGA Public Interface If geo_reference is not supplied the points data is assumed to be absolute. tag – ?? A region instance is returned. This can be used to set the resolution of the added region. <mesh>.add_region_from_polygon(polygon, segment tags=None, max triangle area=None, geo reference=None, region tag=None) Module: pmesh.mesh This method adds a region to a Mesh instance. Regions are commonly used to describe an area with an increased density of triangles by setting max_triangle_area. polygon describes the region boundary to add to the <mesh>. segment_tags specifies a list of segment tags, one for each edge of the bounding polygon. If geo_reference is not supplied the points data is assumed to be absolute. region_tag sets the region tag. <mesh>.add_vertices(point data) Module: pmesh.mesh Add user vertices to a mesh. point_data is the list of point data, and can be a list of (x,y) values, a numeric array or a geospatial data instance. <mesh>.auto_segment(alpha=None, raw boundary=True, remove holes=False, smooth indents=False, expand pinch=False) Module: pmesh.mesh Add segments between some of the user vertices to give the vertices an outline. The outline is an alpha shape. This method is useful since a set of user vertices need to be outlined by segments before generate mesh is called. alpha determines the smoothness of the alpha shape. raw_boundary, if True instructs the function to return the raw boundary, i.e. the regular edges of the alpha shape. remove_holes, if True enables a filter to remove small holes (small is defined by boundary points fraction). smooth_indents, if True removes sharp triangular indents in the boundary. expand_pinch, if True tests for pinch-off and corrects (i.e. a boundary vertex with more than two edges). <mesh>.export_mesh_file(ofile) Module: pmesh.mesh This method is used to save a mesh to a file. ofile is the name of the mesh file to be written, including the extension. Use the extension .msh for the file to be in NetCDF format and .tsh for the file to be ASCII format. <mesh>.generate_mesh(maximum triangle area=””, minimum triangle angle=28.0, verbose=True) Module: pmesh.mesh This method is used to generate the triangular mesh. maximum_triangle_area sets the maximum area of any triangle in the mesh. minimum_triangle_angle sets the minimum area of any triangle in the mesh. These two parameters can be used to control the triangle density. <mesh>.import_ungenerate_file(ofile, tag=None, region tag=None) Module: pmesh.mesh This method is used to import a polygon file in the ungenerate format, which is used by arcGIS. The polygons from the file are converted to vertices and segments. ofile is the name of the polygon file. 5.3. Mesh Generation 45 tag is the tag given to all the polygon’s segments. If tag is not supplied then the segment will not effect the water flow, it will only effect the mesh generation. region_tag is the tag given to all the polygon’s segments. If it is a string the tag will be assigned to all regions. If it is a list the first value in the list will be applied to the first polygon etc. This function can be used to import building footprints. 5.4 Initialising the Domain class Domain(source=None, triangles=None, boundary=None, conserved quantities=None, other quantities=None, tagged elements=None, geo reference=None, use inscribed circle=False, mesh filename=None, use cache=False, verbose=False, full send dict=None, ghost recv dict=None, processor=0, numproc=1, number of full nodes=None, number of full triangles=None) Module: abstract_2d_finite_volumes.domain This class is used to create an instance of a structure used to store and manipulate data associated with a mesh. The mesh is specified either by assigning the name of a mesh file to source or by specifying the points, triangle and boundary of the mesh. 5.4.1 Key Methods of Domain <domain>.set_name(name) Module: abstract_2d_finite_volumes.domain, page ?? name is used to name the domain. The name is also used to identify the output SWW file. If no name is assigned to a domain, the assumed name is ’domain’. <domain>.get_name() Module: abstract_2d_finite_volumes.domain Returns the name assigned to the domain by set_name(). If no name has been assigned, returns ’domain’. <domain>.set_datadir(path) Module: abstract_2d_finite_volumes.domain path specifies the path to the directory used to store SWW files. Before this method is used to set the SWW directory path, the assumed directory path is default_datadir specified in config.py. Since different operating systems use different formats for specifying pathnames it is necessary to specify path separators using the Python code os.sep rather than the operating-specific ones such as ’/’ or ’\’. For this to work you will need to include the statement import os in your code, before the first use of set_datadir(). For example, to set the data directory to a subdirectory data of the directory project, you could use the statements: import os domain.set_datadir{’project’ + os.sep + ’data’} <domain>.get_datadir() Module: abstract_2d_finite_volumes.domain Returns the path to the directory where SWW files will be stored. If the path has not previously been set with set_datadir() this method will return the value default_datadir specified in config.py. 46 Chapter 5. ANUGA Public Interface <domain>.set_minimum_allowed_height(minimum allowed height) Module: shallow_water.shallow_water_domain Set the minimum depth (in metres) that will be recognised in the numerical scheme (including limiters and flux computations) minimum_allowed_height is the new minimum allowed height value. Default value is 10−3 metre, but by setting this to a greater value, e.g. for large scale simulations, the computation time can be significantly reduced. <domain>.set_minimum_storable_height(minimum storable height) Module: shallow_water.shallow_water_domain Sets the minimum depth that will be recognised when writing to an SWW file. This is useful for removing thin water layers that seems to be caused by friction creep. minimum_storable_height is the new minimum storable height value. <domain>.set_maximum_allowed_speed(maximum allowed speed) Module: shallow_water.shallow_water_domain Set the maximum particle speed that is allowed in water shallower than minimum_allowed_height. This is useful for controlling speeds in very thin layers of water and at the same time allow some movement avoiding pooling of water. maximum_allowed_speed sets the maximum allowed speed value. <domain>.set_time(time=0.0) Module: abstract_2d_finite_volumes.domain time sets the initial time, in seconds, for the simulation. The default is 0.0. <domain>.set_default_order(n) Module: abstract_2d_finite_volumes.domain Sets the default (spatial) order to the value specified by n, which must be either 1 or 2. (Assigning any other value to n will cause an error.) <domain>.set_store_vertices_uniquely(flag, reduction=None) Module: shallow_water.shallow_water_domain Decide whether vertex values should be stored uniquely as computed in the model or whether they should be reduced to one value per vertex using averaging. flag may be True (meaning allow surface to be discontinuous) or False (meaning smooth vertex values). reduction defines the smoothing operation if flag is False. If not supplied, reduction is assumed to be mean. Triangles stored in the SWW file can be discontinuous reflecting the internal representation of the finite-volume scheme (this is a feature allowing for arbitrary steepness of the water surface gradient as well as the momentum gradients). However, for visual purposes and also for use with Field_boundary (and File_boundary), it is often desirable to store triangles with values at each vertex point as the average of the potentially discontinuous numbers found at vertices of different triangles sharing the same vertex location. Storing one way or the other is controlled in ANUGA through the method <domain>.store_vertices_uniquely(). Options are: •<domain>.store_vertices_uniquely(True): Allow discontinuities in the SWW file •<domain>.store_vertices_uniquely(False): (Default). Average values to ensure continuity in SWW file. The latter also makes for smaller SWW files. Note that when model data in the SWW file are averaged (i.e. not stored uniquely), then there will most likely be a small discrepancy between values extracted from the SWW file and the same data stored in the model domain. This must be borne in mind when comparing data from the SWW files with that of the model internally. 5.4. Initialising the Domain 47 <domain>.set_quantities_to_be_stored(quantity dictionary) Module: shallow_water.shallow_water_domain Selects quantities that is to be stored in the sww files. The argument can be None, in which case nothing is stored. Otherwise, the argument must be a dictionary where the keys are names of quantities already defined within ANUGA and the values are either 1 or 2. If the value is 1, the quantity will be stored once at the beginning of the simulation, if the value is 2 it will be stored at each timestep. The ANUGA default is equivalent to the call domain.set_quantities_to_be_stored({’elevation’: 1, ’stage’: 2, ’xmomentum’: 2, ’ymomentum’: 2}) <domain>.get_nodes(absolute=False) Module: abstract_2d_finite_volumes.domain Return x,y coordinates of all nodes in the domain mesh. The nodes are ordered in an Nx2 array where N is the number of nodes. This is the same format they were provided in the constructor i.e. without any duplication. absolute is a boolean which determines whether coordinates are to be made absolute by taking georeference into account. Default is False as many parts of ANUGA expect relative coordinates. <domain>.get_vertex_coordinates(absolute=False) Module: abstract_2d_finite_volumes.domain Return vertex coordinates for all triangles as a 3*Mx2 array where the jth vertex of the ith triangle is located in row 3*i+j and M is the number of triangles in the mesh. absolute is a boolean which determines whether coordinates are to be made absolute by taking georeference into account. Default is False as many parts of ANUGA expect relative coordinates. <domain>.get_centroid_coordinates(absolute=False) Module: abstract_2d_finite_volumes.domain Return centroid coordinates for all triangles as an Mx2 array. absolute is a boolean which determines whether coordinates are to be made absolute by taking georeference into account. Default is False as many parts of ANUGA expect relative coordinates. <domain>.get_triangles(indices=None) Module: abstract_2d_finite_volumes.domain Return an Mx3 integer array where M is the number of triangles. Each row corresponds to one triangle and the three entries are indices into the mesh nodes which can be obtained using the method get_nodes(). indices, if specified, is the set of triangle ids of interest. <domain>.get_disconnected_triangles() Module: abstract_2d_finite_volumes.domain Get the domain mesh based on nodes obtained from get_vertex_coordinates(). Returns an Mx3 array of integers where each row corresponds to a triangle. A triangle is a triplet of indices into point coordinates obtained from get_vertex_coordinates() and each index appears only once. This provides a mesh where no triangles share nodes (hence the name disconnected triangles) and different nodes may have the same coordinates. This version of the mesh is useful for storing meshes with discontinuities at each node and is e.g. used for storing data in SWW files. The triangles created will have the format: 48 Chapter 5. ANUGA Public Interface [[0,1,2], [3,4,5], [6,7,8], ... [3*M-3 3*M-2 3*M-1]] 5.5 Initial Conditions In standard usage of partial differential equations, initial conditions refers to the values associated to the system variables (the conserved quantities here) for time = 0. In setting up a scenario script as described in Sections 4.1 and 4.6, set_quantity is used to define the initial conditions of variables other than the conserved quantities, such as friction. Here, we use the terminology of initial conditions to refer to initial values for variables which need prescription to solve the shallow water wave equation. Further, it must be noted that set_quantity() does not necessarily have to be used in the initial condition setting; it can be used at any time throughout the simulation. <domain>.set_quantity(numeric=None, quantity=None, function=None, geospatial data=None, filename=None, attribute name=None, alpha=None, location=’vertices’, polygon=None, indices=None, smooth=False, verbose=False, use cache=False) Module: abstract_2d_finite_volumes.domain (This method passes off to abstract_2d_finite_volumes.quantity.set_values()) This function is used to assign values to individual quantities for a domain. It is very flexible and can be used with many data types: a statement of the form <domain>.set_quantity(name, x) can be used to define a quantity having the name name, where the other argument x can be any of the following: •a number, in which case all vertices in the mesh gets that for the quantity in question •a list of numbers or a numeric array ordered the same way as the mesh vertices •a function (e.g. see the samples introduced in Chapter 2) •an expression composed of other quantities and numbers, arrays, lists (for example, a linear combination of quantities, such as <domain>.set_quantity(’stage’,’elevation’+x)) •the name of a file from which the data can be read. In this case, the optional argument attribute_name will select which attribute to use from the file. If left out, set_quantity() will pick one. This is useful in cases where there is only one attribute •a geospatial dataset (See Section A.5). Optional argument attribute_name applies here as with files Exactly one of the arguments numeric, quantity, function, geospatial_data and filename must be present. set_quantity() will look at the type of the numeric and determine what action to take. Values can also be set using the appropriate keyword arguments. If x is a function, for example, domain.set_quantity(name, x), domain.set_quantity(name, numeric=x), and domain.set_quantity(name, function=x) are all equivalent. Other optional arguments are: •indices which is a list of ids of triangles to which set_quantity() should apply its assignment of values. •location determines which part of the triangles to assign to. Options are ’vertices’ (the default), ’edges’, ’unique vertices’, and ’centroids’. If ’vertices’ is used, edge and centroid values are automatically computed as the appropriate averages. This option ensures continuity of the surface. If, on the other hand, ’centroids’ is used, vertex and edge values will be set to the same value effectively creating a piecewise constant surface with possible discontinuities at the edges. 5.5. Initial Conditions 49 ANUGA provides a number of predefined initial conditions to be used with set_quantity(). See for example callable object slump_tsunami below. <domain>.add_quantity(numeric=None, quantity=None, function=None, geospatial data=None, filename=None, attribute name=None, alpha=None, location=’vertices’, polygon=None, indices=None, smooth=False, verbose=False, use cache=False) Module: abstract_2d_finite_volumes.domain (passes off to abstract_2d_finite_volumes.domain.set_quantity()) This function is used to add values to individual quantities for a domain. <domain>.set_quantity(name, x). It has the same syntax as A typical use of this function is to add structures to an existing elevation model: # Create digital elevation model from points file domain.set_quantity(’elevation’, filename=’elevation_file.pts, verbose=True) # Add buildings from file building_polygons, building_heights = anuga.load_csv_as_building_polygons(building_file) B = [] for key in building_polygons: poly = building_polygons[key] elev = building_heights[key] B.append((poly, elev)) domain.add_quantity(’elevation’, Polygon_function(B, default=0.0)) <domain>.set_region(tag, quantity, X, location=’vertices’) Module: abstract_2d_finite_volumes.domain (see also abstract_2d_finite_volumes.quantity.set_values) This function is used to assign values to individual quantities given a regional tag. It is similar to set_quantity(). For example, if in the mesh-generator a regional tag of ’ditch’ was used, set_region() can be used to set elevation of this region to -10m. X is the constant or function to be applied to the quantity, over the tagged region. location describes how the values will be applied. Options are ’vertices’ (the default), ’edges’, ’unique vertices’, and ’centroids’. This method can also be called with a list of region objects. This is useful for adding quantities in regions, and having one quantity value based on another quantity. See abstract_2d_finite_volumes.region for more details. slump_tsunami(length, depth, slope, width=None, thickness=None, radius=None, dphi=0.48, x0=0.0, y0=0.0, alpha=0.0, gravity=9.8, gamma=1.85, massco=1, dragco=1, frictionco=0, dx=None, kappa=3.0, kappad=1.0, zsmall=0.01, scale=None, domain=None, verbose=False) Module: shallow_water.smf This function returns a callable object representing an initial water displacement generated by a submarine sediment failure. These failures can take the form of a submarine slump or slide. In the case of a slide, use slide_tsunami instead. length is the length of the slide or slump. depth is the water depth to the centre of the sediment mass. slope is the bathymetric slope. Other slump or slide parameters can be included if they are known. 50 Chapter 5. ANUGA Public Interface <callable_object> = file_function(filename, domain=None, quantities=None, interpolation points=None, time thinning=1, time limit=None, verbose=False, output centroids=False, use cache=False, boundary polygon=None) Module: abstract_2d_finite_volumes.util Reads the time history of spatial data for specified interpolation points from a NetCDF file and returns a callable object. Values returned from the <callable_object> are interpolated values based on the input file using the underlying interpolation_function. filename is the name of the input file. This would be either an SWW, TMS or STS file. quantities is either the name of a single quantity to be interpolated or a list of such quantity names. In the second case, the resulting function will return a tuple of values – one for each quantity. If the NetCDF file uses names other than ’stage’, ’xmomentum’, and ’ymomentum’ the name(s) appearing in the file must be explicitly stated using the quantities keyword. This is for example be the case if a ’tms’ file is used to specify time dependent precipitation. In this case the keyword might be called ’rainfall’ both in the call to file function and in the ’tms’ file. interpolation_points is a list of absolute coordinates or a geospatial object for points at which values are sought. boundary_polygon is a list of coordinates specifying the vertices of the boundary. This must be the same polygon as used when calling create_mesh_from_regions(). This argument can only be used when reading boundary data from an STS format file. output_centroids set to true to sample at the centre of the triangle containing the point. This may be useful for debugging. (new in 1.2) The model time stored within the file function can be accessed using the method <callable_object>.get_time() The underlying algorithm used is as follows: Given a time series (i.e. a series of values associated with different times), whose values are either just numbers, a set of numbers defined at the vertices of a triangular mesh (such as those stored in SWW files) or a set of numbers defined at a number of points on the boundary (such as those stored in STS files), Interpolation_function() is used to create a callable object that interpolates a value for an arbitrary time t within the model limits and possibly a point (x, y) within a mesh region. The actual time series at which data is available is specified by means of an array time of monotonically increasing times. The quantities containing the values to be interpolated are specified in an array – or dictionary of arrays (used in conjunction with the optional argument quantity_names) – called quantities. The optional arguments vertex_coordinates and triangles represent the spatial mesh associated with the quantity arrays. If omitted the function must be created using an STS file or a TMS file. Since, in practice, values need to be computed at specified points, the syntax allows the user to specify, once and for all, a list interpolation_points of points at which values are required. In this case, the function may be called using the form <callable_object>(t, id), where id is an index for the list interpolation_points. class <callable_object> = Interpolation_function(time, quantities, quantity names=None, vertex coordinates=None, triangles=None, interpolation points=None, time thinning=1, verbose=False, gauge neighbour id=None) Module: fit_interpolate.interpolate Given a time series (i.e. a series of values associated with different times) whose values are either just numbers or a set of numbers defined at the vertices of a triangular mesh (such as those stored in SWW files), Interpolation_function is used to create a callable object that interpolates a value for an arbitrary time t within the model limits and possibly a point (x, y) within a mesh region. The actual time series at which data is available is specified by means of an array time of monotonically increasing times. The quantities containing the values to be interpolated are specified in an array – or dictionary 5.5. Initial Conditions 51 of arrays (used in conjunction with the optional argument quantity_names) – called quantities. The optional arguments vertex_coordinates and triangles represent the spatial mesh associated with the quantity arrays. If omitted the function created by Interpolation_function will be a function of t only. Since, in practice, values need to be computed at specified points, the syntax allows the user to specify, once and for all, a list interpolation_points of points at which values are required. In this case, the function may be called using the form f(t, id), where id is an index for the list interpolation_points. 5.6 Boundary Conditions ANUGA provides a large number of predefined boundary conditions, represented by objects such as Reflective_boundary(domain) and Dirichlet_boundary([0.2, 0.0, 0.0]), described in the examples in Chapter 2. Alternatively, you may prefer to ”roll your own”, following the method explained in Section 5.6.2. These boundary objects may be used with the function set_boundary described below to assign boundary conditions according to the tags used to label boundary segments. <domain>.set_boundary(boundary map) Module: abstract_2d_finite_volumes.domain This function allows you to assign a boundary object (corresponding to a pre-defined or user-specified boundary condition) to every boundary segment that has been assigned a particular tag. boundary_map is a dictionary of boundary objects keyed by symbolic tags. <domain>.get_boundary_tags() Module: abstract_2d_finite_volumes.domain Returns a list of the available boundary tags. 5.6.1 Predefined boundary conditions class Reflective_boundary(domain=None) Module: shallow_water Reflective boundary returns same conserved quantities as those present in the neighbouring volume but reflected. This class is specific to the shallow water equation as it works with the momentum quantities assumed to be the second and third conserved quantities. class Transmissive_boundary(domain=None) Module: abstract_2d_finite_volumes.generic_boundary_conditions A transmissive boundary returns the same conserved quantities as those present in the neighbouring volume. The underlying domain must be specified when the boundary is instantiated. class Dirichlet_boundary(conserved quantities=None) Module: abstract_2d_finite_volumes.generic_boundary_conditions A Dirichlet boundary returns constant values for each of conserved quantities. In the example of Dirichlet_boundary([0.2, 0.0, 0.0]), the stage value at the boundary is 0.2 and the xmomentum and ymomentum at the boundary are set to 0.0. The list must contain a value for each conserved quantity. class Time_boundary(domain=None, function=None, default boundary=None, verbose=False) Module: abstract_2d_finite_volumes.generic_boundary_conditions A time-dependent boundary returns values for the conserved quantities as a function of time function(t). The user must specify the domain to get access to the model time. Optional argument default_boundary can be used to specify another boundary object to be used in case model time exceeds the time available in the file used by File_boundary. The default_boundary could 52 Chapter 5. ANUGA Public Interface be a simple Dirichlet condition or even another Time_boundary typically using data pertaining to another time interval. class File_boundary(filename, domain, time thinning=1, time limit=None, boundary polygon=None, default boundary=None, use cache=False, verbose=False) Module: abstract_2d_finite_volumes.generic_boundary_conditions This method may be used if the user wishes to apply a SWW file, STS file or a time series file (TMS) to a boundary segment or segments. The boundary values are obtained from a file and interpolated to the appropriate segments for each conserved quantity. Optional argument default_boundary can be used to specify another boundary object to be used in case model time exceeds the time available in the file used by File_boundary. The default_boundary could be a simple Dirichlet condition or even another File_boundary typically using data pertaining to another time interval. class Field_boundary(filename, domain, mean stage=0.0, time thinning=1, time limit=None, boundary polygon=None, default boundary=None, use cache=False, verbose=False) Module: shallow_water.shallow_water_domain This method works in the same way as File_boundary except that it allows for the value of stage to be offset by a constant specified in the keyword argument mean_stage. This functionality allows for models to be run for a range of tides using the same boundary information (from STS, SWW or TMS files). The tidal value for each run would then be specified in the keyword argument mean_stage. If mean_stage = 0.0, Field_boundary and File_boundary behave identically. Note that if the optional argument default_boundary is specified its stage value will be adjusted by mean_stage just like the values obtained from the file. See File_boundary for further details. class Transmissive_momentum_set_stage_boundary(domain=None, function=None) Module: shallow_water.shallow_water_domain This boundary returns the same momentum conserved quantities as those present in its neighbour volume but sets stage as in a Time_boundary. The underlying domain must be specified when boundary is instantiated. This type of boundary is useful when stage is known at the boundary as a function of time, but momenta (or speeds) aren’t. This class is specific to the shallow water equation as it works with the momentum quantities assumed to be the second and third conserved quantities. In some circumstances, this boundary condition may cause numerical instabilities for similar reasons as what has been observed with the simple fully transmissive boundary condition (see Page 52). This could for example be the case if a planar wave is reflected out through this boundary. class Transmissive_stage_zero_momentum_boundary(domain=None) Module: shallow_water This boundary returns same stage conserved quantities as those present in its neighbour volume but sets momentum to zero. The underlying domain must be specified when boundary is instantiated This type of boundary is useful when stage is known at the boundary as a function of time, but momentum should be set to zero. This is for example the case where a boundary is needed in the ocean on the two sides perpendicular to the coast to maintain the wave height of the incoming wave. This class is specific to the shallow water equation as it works with the momentum quantities assumed to be the second and third conserved quantities. This boundary condition should not cause the numerical instabilities seen with the transmissive momentum boundary conditions (see Page 52 and Page 53). class Dirichlet_discharge_boundary(domain=None, stage0=None, wh0=None) Module: shallow_water.shallow_water_domain 5.6. Boundary Conditions 53 stage0 sets the stage. wh0 sets momentum in the inward normal direction. 5.6.2 User-defined boundary conditions All boundary classes must inherit from the generic boundary class Boundary and have a method called evaluate() which must take as inputs self, vol_id and edge_id where self refers to the object itself and vol_id and edge_id are integers referring to particular edges. The method must return a list of three floating point numbers representing values for stage, xmomentum and ymomentum, respectively. The constructor of a particular boundary class may be used to specify particular values or flags to be used by the evaluate() method. Please refer to the source code for the existing boundary conditions for examples of how to implement boundary conditions. 5.7 Forcing Terms ANUGA provides a number of predefined forcing functions to be used with simulations. Gravity and friction are always calculated using the elevation and friction quantities, but the user may additionally add forcing terms to the list domain.forcing_terms and have them affect the model. Currently, predefined forcing terms are: class General_forcing(domain, quantity name, rate=0.0, center=None, radius=None, polygon=None, default rate=None, verbose=False) Module: shallow_water.shallow_water_domain This is a general class to modify any quantity according to a given rate of change. Other specific forcing terms are based on this class but it can be used by itself as well (e.g. to modify momentum). domain is the domain being evolved. quantity_name is the name of the quantity that will be affected by this forcing term. rate is the rate at which the quantity should change. This can be either a constant or a function of time. Positive values indicate increases, negative values indicate decreases. The parameter rate can be None at initialisation but must be specified before a forcing term is applied (i.e. simulation has started). The default value is 0.0 – i.e. no forcing. center and radius optionally restrict forcing to a circle with given center and radius. polygon optionally restricts forcing to an area enclosed by the given polygon. Note: specifying center, radius and polygon will cause an exception to be thrown. Moreover, if the specified polygon or circle does not lie fully within the mesh boundary an Exception will be thrown. Example: P = [[x0, y0], [x1, y0], [x1, y1], [x0, y1]] # Square polygon xmom = General_forcing(domain, ’xmomentum’, polygon=P) ymom = General_forcing(domain, ’ymomentum’, polygon=P) xmom.rate = f ymom.rate = g domain.forcing_terms.append(xmom) domain.forcing_terms.append(ymom) 54 Chapter 5. ANUGA Public Interface Here, f and g are assumed to be defined as functions of time providing a time dependent rate of change for xmomentum and ymomentum respectively. P is assumed to be the polygon, specified as a list of points. class Inflow(domain, rate=0.0, center=None, radius=None, polygon=None, default rate=None, verbose=False) Module: shallow_water.shallow_water_domain This is a general class for inflow and abstraction of water according to a given rate of change. This class will always modify the stage quantity. Inflow is based on the General_forcing class so the functionality is similar. domain is the domain being evolved. rate is the flow rate (m3 /s) at which the quantity should change. This can be either a constant or a function of time. Positive values indicate inflow, negative values indicate outflow. Note: The specified flow will be divided by the area of the inflow region and then applied to update the stage quantity. center and radius optionally restrict forcing to a circle with given center and radius. polygon optionally restricts forcing to an area enclosed by the given polygon. Example: hydrograph = Inflow(center=(320, 300), radius=10, rate=file_function(’QPMF_Rot_Sub13.tms’)) domain.forcing_terms.append(hydrograph) Here, ’QPMF_Rot_Sub13.tms’ is assumed to be a NetCDF file in the TMS format defining a timeseries for a hydrograph. class Rainfall(domain, rate=0.0, center=None, radius=None, polygon=None, default rate=None, verbose=False) Module: shallow_water.shallow_water_domain This is a general class for implementing rainfall over the domain, possibly restricted to a given circle or polygon. This class will always modify the stage quantity. Rainfall is based on the General_forcing class so the functionality is similar. domain is the domain being evolved. rate is the total rain rate over the specified domain. Note: Raingauge Data needs to reflect the time step. For example, if rain gauge is mm read every dt seconds, then the input here is as mm/dt so 10 mm in 5 minutes becomes 10/(5x60) = 0.0333mm/s. This parameter can be either a constant or a function of time. Positive values indicate rain being added (or be used for general infiltration), negative values indicate outflow at the specified rate (presumably this could model evaporation or abstraction). center and radius optionally restrict forcing to a circle with given center and radius. polygon optionally restricts forcing to an area enclosed by the given polygon. Example: catchmentrainfall = Rainfall(rate=file_function(’Q100_2hr_Rain.tms’)) domain.forcing_terms.append(catchmentrainfall) Here, ’Q100_2hr_Rain.tms’ is assumed to be a NetCDF file in the TMS format defining a timeseries for the rainfall. class Culvert_flow(domain, culvert description filename=None, culvert routine=None, end point0=None, end point1=None, enquiry point0=None, enquiry point1=None, type=’box’, width=None, height=None, length=None, number of barrels=1, trigger depth=0.01, manning=None, sum loss=None, use velocity head=False, use momentum jet=False, label=None, description=None, update interval=None, log file=False, discharge hydrograph=False, verbose=False) Module: culvert_flows.culvert_class 5.7. Forcing Terms 55 This is a general class for implementing flow through a culvert. This class modifies the quantities stage, xmomentum and ymomentum in areas at both ends of the culvert. The Culvert_flow forcing term uses Inflow and General_forcing to update the quantities. The flow direction is determined on-the-fly so openings are referenced simple as opening0 and opening1 with either being able to take the role as Inflow or Outflow. The Culvert_flow class takes as input: •domain: a reference to the domain being evolved •culvert_description_filename: •culvert_routine: •end_point0: Coordinates of one opening •end_point1: Coordinates of other opening •enquiry_point0: •enquiry_point1: •type: (default is ’box’) •width: •height: •length: •number_of_barrels: Number of identical pipes in the culvert (default is 1) •trigger_depth: (default is 0.01) •manning: Mannings Roughness for Culvert •sum_loss: •use_velocity_head: •use_momentum_jet: •label: Short text naming the culvert •description: Text describing the culvert •update_interval: •log_file: •discharge_hydrograph: The user can specify different culvert routines. However, ANUGA currently provides only one, namely the boyd_generalised_culvert_model as used in the example below: 56 Chapter 5. ANUGA Public Interface from anuga.culvert_flows.culvert_class import Culvert_flow from anuga.culvert_flows.culvert_routines import boyd_generalised_culvert_model culvert1 = Culvert_flow(domain, label=’Culvert No. 1’, description=’This culvert is a test unit 1.2m Wide by 0.75m High’, end_point0=[9.0, 2.5], end_point1=[13.0, 2.5], width=1.20, height=0.75, culvert_routine=boyd_generalised_culvert_model, number_of_barrels=1, verbose=True) culvert2 = Culvert_flow(domain, label=’Culvert No. 2’, description=’This culvert is a circular test with d=1.2m’, end_point0=[9.0, 1.5], end_point1=[30.0, 3.5], diameter=1.20, invert_level0=7, culvert_routine=boyd_generalised_culvert_model, number_of_barrels=1, verbose=True) domain.forcing_terms.append(culvert1) domain.forcing_terms.append(culvert2) 5.8 Evolution <domain>.evolve(yieldstep=None, finaltime=None, duration=None, skip initial step=False) Module: abstract_2d_finite_volumes.domain This method is invoked once all the preliminaries have been completed, and causes the model to progress through successive steps in its evolution, storing results and outputting statistics whenever a user-specified period yieldstep is completed. Generally during this period the model will evolve through several steps internally as the method forces the water speed to be calculated on successive new cells. yieldstep is the interval in seconds between yields where results are stored, statistics written and the domain is inspected or possibly modified. If omitted an internal predefined yieldstep is used. Internally, smaller timesteps may be taken. duration is the duration of the simulation in seconds. finaltime is the time in seconds where simulation should end. This is currently relative time, so it’s the same as duration. If both duration and finaltime are given an exception is thrown. skip_initial_step is a boolean flag that decides whether the first yield step is skipped or not. This is useful for example to avoid duplicate steps when multiple evolve processes are dove tailed. The code specified by the user in the block following the evolve statement is only executed once every yieldstep even though ANUGA typically will take many more internal steps behind the scenes. You can include evolve in a statement of the type: for t in domain.evolve(yieldstep, finaltime): <Do something with domain and t> 5.8. Evolution 57 5.8.1 Diagnostics <domain>.statistics() Module: abstract_2d_finite_volumes.domain Outputs statistics about the mesh within the Domain. <domain>.timestepping_statistics(track speeds=False, triangle id=None) Module: abstract_2d_finite_volumes.domain Returns a string of the following type for each timestep: Time = 0.9000, delta t in [0.00598964, 0.01177388], steps=12 (12) Here the numbers in steps=12 (12) indicate the number of steps taken and the number of first-order steps, respectively. The optional keyword argument track_speeds will generate a histogram of speeds generated by each triangle if set to True. The speeds relate to the size of the timesteps used by ANUGA and this diagnostics may help pinpoint problem areas where excessive speeds are generated. The optional keyword argument triangle_id can be used to specify a particular triangle rather than the one with the largest speed. <domain>.boundary_statistics(quantities=None, tags=None) Module: abstract_2d_finite_volumes.domain Generates output about boundary forcing at each timestep. quantities names the quantities to be reported – may be None, a string or a list of strings. tags names the tags to be reported – may be either None, a string or a list of strings. When quantities = ’stage’ and tags = [’top’, ’bottom’] will return a string like: Boundary values at time 0.5000: top: stage in [ -0.25821218, bottom: stage in [ -0.27098821, -0.02499998] -0.02499974] Q = <domain>.get_quantity(name, location=’vertices’, indices=None) Module: abstract_2d_finite_volumes.domain This function returns a Quantity object Q. Access to its values should be done through Q.get_values() documented on Page 59. name is the name of the quantity to retrieve. location is indices is <domain>.set_quantities_to_be_monitored(quantity, polygon=None, time interval=None) Module: abstract_2d_finite_volumes.domain Selects quantities and derived quantities for which extrema attained at internal timesteps will be collected. quantity specifies the quantity or quantities to be monitored and must be either: •the name of a quantity or derived quantity such as ’stage-elevation’, •a list of quantity names, or •None. polygon can be used to monitor only triangles inside the polygon. Otherwise all triangles will be included. time_interval will restrict monitoring to time steps in the interval. Otherwise all timesteps will be included. Information can be tracked in the evolve loop by printing quantity_statistics and collected data will be stored in the SWW file. 58 Chapter 5. ANUGA Public Interface <domain>.quantity_statistics(precision=’%.4f’) Module: abstract_2d_finite_volumes.domain Reports on extrema attained by selected quantities. Returns a string of the following type for each timestep: Monitored quantities at stage-elevation: values since time = minimum attained at maximum attained at ymomentum: values since time = minimum attained at maximum attained at xmomentum: values since time = minimum attained at maximum attained at time 1.0000: 0.00 in [0.00000000, 0.30000000] time = 0.00000000, location = (0.16666667, 0.33333333) time = 0.00000000, location = (0.83333333, 0.16666667) 0.00 in [0.00000000, 0.06241221] time = 0.00000000, location = (0.33333333, 0.16666667) time = 0.22472667, location = (0.83333333, 0.66666667) 0.00 in [-0.06062178, 0.47886313] time = 0.00000000, location = (0.16666667, 0.33333333) time = 0.35103646, location = (0.83333333, 0.16666667) The quantities (and derived quantities) listed here must be selected at model initialisation time using the method domain.set_quantities_to_be_monitored(). The optional keyword argument precision=’%.4f’ will determine the precision used for floating point values in the output. This diagnostics helps track extrema attained by the selected quantities at every internal timestep. These values are also stored in the SWW file for post-processing. <quantity>.get_values(interpolation points=None, location=’vertices’, indices=None, use cache=False, verbose=False) Module: abstract_2d_finite_volumes.quantity Extract values for quantity as a numeric array. interpolation_points is a list of (x, y) coordinates where the value is sought (using interpolation). If interpolation_points is given, values for location and indices are ignored. Assume either an absolute UTM coordinates or geospatial data object. location specifies where values are to be stored. Permissible options are ’vertices’, ’edges’, ’centroids’ or ’unique vertices’. The returned values will have the leading dimension equal to length of the indices list or N (all values) if indices is None. If location is ’centroids’ the dimension of returned values will be a list or a numeric array of length N, N being the number of elements. If location is ’vertices’ or ’edges’ the dimension of returned values will be of dimension Nx3. If location is ’unique vertices’ the average value at each vertex will be returned and the dimension of returned values will be a 1d array of length ”number of vertices” indices is the set of element ids that the operation applies to. The values will be stored in elements following their internal ordering. <quantity>.set_values(numeric=None, quantity=None, function=None, geospatial data=None, filename=None, attribute name=None, alpha=None, location=’vertices’, polygon=None, indices=None, smooth=False, verbose=False, use cache=False) Module: abstract_2d_finite_volumes.quantity Assign values to a quantity object. 5.8. Evolution 59 This method works the same way as set_quantity() except that it doesn’t take a quantity name as the first argument since it is applied directly to the quantity. Use set_values is used to assign values to a new quantity that has been created but which is not part of the domain’s predefined quantities. location is ?? indices is ?? The method set_values() is always called by set_quantity() behind the scenes. <quantity>.get_integral() Module: abstract_2d_finite_volumes.quantity Return the computed integral over the entire domain for the quantity. <quantity>.get_maximum_value(indices=None) Module: abstract_2d_finite_volumes.quantity Return the maximum value of a quantity (on centroids). indices is the optional set of element ids that the operation applies to. We do not seek the maximum at vertices as each vertex can have multiple values – one for each triangle sharing it. <quantity>.get_maximum_location(indices=None) Module: abstract_2d_finite_volumes.quantity Return the location of the maximum value of a quantity (on centroids). indices is the optional set of element ids that the operation applies to. We do not seek the maximum at vertices as each vertex can have multiple values – one for each triangle sharing it. If there are multiple cells with the same maximum value, the first cell encountered in the triangle array is returned. <domain>.get_wet_elements(indices=None) Module: shallow_water.shallow_water_domain Returns the indices for elements where h > minimum allowed height indices is the optional set of element ids that the operation applies to. <domain>.get_maximum_inundation_elevation(indices=None) Module: shallow_water.shallow_water_domain Return highest elevation where h > 0. indices is the optional set of element ids that the operation applies to. Example to find maximum runup elevation: z = domain.get_maximum_inundation_elevation() <domain>.get_maximum_inundation_location(indices=None) Module: shallow_water.shallow_water_domain Return location (x,y) of highest elevation where h > 0. indices is the optional set of element ids that the operation applies to. Example to find maximum runup location: x, y = domain.get_maximum_inundation_location() 60 Chapter 5. ANUGA Public Interface 5.9 Queries of SWW model output files After a model has been run, it is often useful to extract various information from the SWW output file (see Section 6.1.3). This is typically more convenient than using the diagnostics described in Section 5.8.1 which rely on the model running – something that can be very time consuming. The SWW files are easy and quick to read and offer information about the model results such as runup heights, time histories of selected quantities, flow through cross sections and much more. elevation = get_maximum_inundation_elevation(filename, polygon=None, time interval=None, verbose=False) Module: shallow_water.data_manager Return the highest elevation where depth is positive (h > 0). filename is the path to a NetCDF SWW file containing ANUGA model output. polygon restricts the query to the points that lie within the polygon. time_interval restricts the query to within the time interval. Example to find maximum runup elevation: max_runup = get_maximum_inundation_elevation(filename) If no inundation is found (within the polygon and time_interval, if specified) the return value is None. This indicates ”No Runup” or ”Everything is dry”. (x, y) = get_maximum_inundation_location(filename, polygon=None, time interval=None, verbose=False) Module: shallow_water.data_manager Return location (x,y) of the highest elevation where depth is positive (h > 0). filename is the path to a NetCDF SWW file containing ANUGA model output. polygon restricts the query to the points that lie within the polygon. time_interval restricts the query to within the time interval. Example to find maximum runup location: max_runup_location = get_maximum_inundation_location(filename) If no inundation is found (within the polygon and time_interval, if specified) the return value is None. This indicates ”No Runup” or ”Everything is dry”. is None. This indicates ”No Runup” or ”Everything is dry”. sww2timeseries(swwfiles, gauge filename, production dirs, report=None, reportname=None, plot quantity=None, generate fig=False, surface=None, time min=None, time max=None, output centroids=False, time thinning=1, time unit=None, title on=None, use cache=False, verbose=False) Module: abstract_2d_finite_volumes.util Read a set of SWW files and plot the time series for the prescribed quantities at defined gauge locations and prescribed time range. swwfiles is a dictionary of SWW files with keys of label_id. gauge_filename is the path to a file containing gauge data. THIS NEEDS MORE WORK. WORK ON FUNCTION DOC STRING, IF NOTHING ELSE! (time, Q) = get_flow_through_cross_section(filename, polyline, verbose=False) Module: shallow_water.data_manager Obtain flow (m3 /s) perpendicular to specified cross section. filename is the path to the SWW file. 5.9. Queries of SWW model output files 61 output_centroids set to true to sample at the centre of the triangle containing the point. This may be useful for debugging. (new in 1.2) polyline is the representation of the desired cross section – it may contain multiple sections allowing for complex shapes. Assumes absolute UTM coordinates. Returns a tuple time, Q where: time is all the stored times in the SWW file. Q is a hydrograph of total flow across the given segments for all stored times. The normal flow is computed for each triangle intersected by the polyline and added up. If multiple segments at different angles are specified the normal flows may partially cancel each other. Example to find flow through cross section: cross_section = [[x, 0], [x, width]] time, Q = get_flow_through_cross_section(filename, cross_section) 5.10 Other quantity = <domain>.create_quantity_from_expression(string) Module: abstract_2d_finite_volumes.domain Create a new quantity from other quantities in the domain using an arbitrary expression. string is a string containing an arbitrary quantity expression. Returns the new Quantity object. Handy for creating derived quantities on-the-fly: Depth = domain.create_quantity_from_expression(’stage-elevation’) exp = ’(xmomentum*xmomentum + ymomentum*ymomentum)**0.5’ Absolute_momentum = domain.create_quantity_from_expression(exp) 62 Chapter 5. ANUGA Public Interface CHAPTER SIX ANUGA System Architecture 6.1 File Formats ANUGA makes use of a number of different file formats. The following table lists all these formats, which are described in more detail in the paragraphs below. Extension .sww .sts .tms .csv/.txt .pts .asc .prj .ers .dem .tsh .msh .nc .geo Description NetCDF format for storing model output with mesh information f(t,x,y) NetCDF format for storing model ouput f(t,x,y) without mesh information NetCDF format for storing time series f(t) ASCII format for storing arbitrary points and associated attributes NetCDF format for storing arbitrary points and associated attributes ASCII format of regular DEMs as output from ArcView Associated ArcView file giving more metadata for .asc format ERMapper header format of regular DEMs for ArcView NetCDF representation of regular DEM data ASCII format for storing meshes and associated boundary and region info NetCDF format for storing meshes and associated boundary and region info Native ferret NetCDF format Houdinis ASCII geometry format (?) The above table shows the file extensions used to identify the formats of files. However, typically, in referring to a format we capitalise the extension and omit the initial full stop – thus, we refer to ’SWW files’ or ’PRJ files’, not ’sww files’ or ’.prj files’. A typical dataflow can be described as follows: SOMETHING MISSING HERE!? 6.1.1 Manually Created Files ASC, PRJ NC Digital elevation models (gridded) Model outputs for use as boundary conditions (e.g. from MOST) 63 6.1.2 Automatically Created Files ASC, PRJ → DEM → PTS NC → SWW PTS + TSH → TSH with elevation TSH → SWW TSH + Boundary SWW → SWW Polygonal mesh outline → 6.1.3 Convert DEMs to native .pts file Convert MOST boundary files to boundary .sww Least squares fit Convert TSH to .sww-viewable using anuga_viewer Simulation using ANUGA TSH or MSH SWW, STS and TMS Formats The SWW, STS and TMS formats are all NetCDF formats and are of key importance for ANUGA . An SWW file is used for storing ANUGA output and therefore pertains to a set of points and a set of times at which a model is evaluated. It contains, in addition to dimension information, the following variables: • x and y: coordinates of the points, represented as numeric arrays • elevation: a numeric array storing bed-elevations • volumes: a list specifying the points at the vertices of each of the triangles • time: a numeric array containing times for model evaluation The contents of an SWW file may be viewed using the anuga viewer anuga_viewer, which creates an on-screen visualisation. See section A.2 (page 78) in Appendix A for more on anuga_viewer. Alternatively, there are tools, such as ncdump, that allow you to convert a NetCDF file into a readable format such as the Class Definition Language (CDL). The following is an excerpt from a CDL representation of the output file ‘runup.sww’ generated from running the simple example ‘runup.py’ of Chapter 4: netcdf bedslope { dimensions: number_of_volumes = 200 ; number_of_vertices = 3 ; number_of_points = 121 ; number_of_timesteps = UNLIMITED ; // (41 currently) variables: float x(number_of_points) ; float y(number_of_points) ; float elevation(number_of_points) ; float z(number_of_points) ; int volumes(number_of_volumes, number_of_vertices) ; float time(number_of_timesteps) ; float stage(number_of_timesteps, number_of_points) ; float xmomentum(number_of_timesteps, number_of_points) ; float ymomentum(number_of_timesteps, number_of_points) ; // global attributes: :institution = "Geoscience Australia" ; :description = "Output from pyvolution suitable for plotting" ; :smoothing = "Yes" ; :order = 1 ; :starttime = 0 ; :xllcorner = 0. ; :yllcorner = 0. ; 64 Chapter 6. ANUGA System Architecture :zone = 56 ; :false_easting = 500000 ; :false_northing = 10000000 ; :datum = "wgs84" ; :projection = "UTM" ; :units = "m" ; data: x = 0, 0, 0, 0.1, 0.1, 0.3, 0.3, 0.4, 0.4, 0.5, 0.5, 0.6, 0.6, 0.8, 0.8, 0.9, 0.9, 0, 0, 0, 0, 0, 0.1, 0.2, 0.2, 0.3, 0.3, 0.3, 0.4, 0.4, 0.4, 0.5, 0.5, 0.5, 0.7, 0.7, 0.7, 0.8, 0.8, 0.8, 0.9, 0.9, 0.9, 0, 0, 0, 0.1, 0.1, 0.1, 0.1, 0.1, 0.1, 0.1, 0.1, 0.2, 0.2, 0.2, 0.2, 0.2, 0.2, 0.2, 0.2, 0.2, 0.3, 0.3, 0.3, 0.3, 0.3, 0.3, 0.4, 0.4, 0.4, 0.4, 0.4, 0.4, 0.5, 0.5, 0.5, 0.5, 0.5, 0.5, 0.6, 0.6, 0.6, 0.6, 0.6, 0.6, 0.6, 0.6, 0.6, 0.7, 0.7, 0.7, 0.7, 0.7, 0.7, 0.7, 0.7, 0.8, 0.8, 0.8, 0.8, 0.8, 0.8, 0.9, 0.9, 0.9, 0.9, 0.9, 0.9, 1, 1, 1, 1, 1, 1, 1, 1, 1, 1, 1 ; y = 0, 0.1, 0.2, 0.3, 0.4, 0.5, 0.6, 0.7, 0.8, 0.9, 1, 0, 0.1, 0.2, 0.3, 0.4, 0.5, 0.6, 0.7, 0.8, 0.9, 1, 0, 0.1, 0.2, 0.3, 0.4, 0.5, 0.6, 0.7, 0.8, 0.9, 1, 0, 0.1, 0.2, 0.3, 0.4, 0.5, 0.6, 0.7, 0.8, 0.9, 1, 0, 0.1, 0.2, 0.3, 0.4, 0.5, 0.6, 0.7, 0.8, 0.9, 1, 0, 0.1, 0.2, 0.3, 0.4, 0.5, 0.6, 0.7, 0.8, 0.9, 1, 0, 0.1, 0.2, 0.3, 0.4, 0.5, 0.6, 0.7, 0.8, 0.9, 1, 0, 0.1, 0.2, 0.3, 0.4, 0.5, 0.6, 0.7, 0.8, 0.9, 1, 0, 0.1, 0.2, 0.3, 0.4, 0.5, 0.6, 0.7, 0.8, 0.9, 1, 0, 0.1, 0.2, 0.3, 0.4, 0.5, 0.6, 0.7, 0.8, 0.9, 1, 0, 0.1, 0.2, 0.3, 0.4, 0.5, 0.6, 0.7, 0.8, 0.9, 1 ; elevation = 0, 0, 0, 0, 0, 0, 0, 0, 0, 0, 0, -0.05, -0.05, -0.05, -0.05, -0.05, -0.05, -0.05, -0.05, -0.1, -0.1, -0.1, -0.1, -0.1, -0.1, -0.1, -0.15, -0.15, -0.15, -0.15, -0.15, -0.15, -0.15, -0.15, -0.2, -0.2, -0.2, -0.2, -0.2, -0.2, -0.2, -0.25, -0.25, -0.25, -0.25, -0.25, -0.25, -0.25, -0.25, -0.3, -0.3, -0.3, -0.3, -0.3, -0.3, -0.3, -0.35, -0.35, -0.35, -0.35, -0.35, -0.35, -0.35, -0.35, -0.4, -0.4, -0.4, -0.4, -0.4, -0.4, -0.4, -0.45, -0.45, -0.45, -0.45, -0.45, -0.45, -0.45, -0.45, -0.5, -0.5, -0.5, -0.5, -0.5, -0.5, -0.5 ; -0.05, -0.05, -0.05, -0.1, -0.1, -0.1, -0.1, -0.15, -0.15, -0.15, -0.2, -0.2, -0.2, -0.2, -0.25, -0.25, -0.25, -0.3, -0.3, -0.3, -0.3, -0.35, -0.35, -0.35, -0.4, -0.4, -0.4, -0.4, -0.45, -0.45, -0.45, -0.5, -0.5, -0.5, -0.5, z = 0, 0, 0, 0, 0, 0, 0, 0, 0, 0, 0, -0.05, -0.05, -0.05, -0.05, -0.05, -0.05, -0.05, -0.05, -0.05, -0.05, -0.05, -0.1, -0.1, -0.1, -0.1, -0.1, -0.1, -0.1, -0.1, -0.1, -0.1, -0.1, -0.15, -0.15, -0.15, -0.15, -0.15, -0.15, -0.15, -0.15, -0.15, -0.15, -0.15, -0.2, -0.2, -0.2, -0.2, -0.2, -0.2, -0.2, -0.2, -0.2, -0.2, -0.2, -0.25, -0.25, -0.25, -0.25, -0.25, -0.25, -0.25, -0.25, -0.25, -0.25, -0.25, -0.3, -0.3, -0.3, -0.3, -0.3, -0.3, -0.3, -0.3, -0.3, -0.3, -0.3, -0.35, -0.35, -0.35, -0.35, -0.35, -0.35, -0.35, -0.35, -0.35, -0.35, -0.35, -0.4, -0.4, -0.4, -0.4, -0.4, -0.4, -0.4, -0.4, -0.4, -0.4, -0.4, -0.45, -0.45, -0.45, -0.45, -0.45, -0.45, -0.45, -0.45, -0.45, -0.45, -0.45, -0.5, -0.5, -0.5, -0.5, -0.5, -0.5, -0.5, -0.5, -0.5, -0.5, -0.5 ; volumes = 11, 12, 0, 1, 0, 12, 12, 13, 1, 2, 1, 13, 13, 14, 2, 3, 2, 14, 14, 15, 3, 4, 3, 15, 6.1. File Formats 65 ..., 109, 108, 120 ; time = 0, 0.1, 0.2, 0.3, 0.4, 0.5, 0.6, 0.7, 0.8, 0.9, 1, 1.1, 1.2, 1.3, 1.4, 1.5, 1.6, 1.7, 1.8, 1.9, 2, 2.1, 2.2, 2.3, 2.4, 2.5, 2.6, 2.7, 2.8, 2.9, 3, 3.1, 3.2, 3.3, 3.4, 3.5, 3.6, 3.7, 3.8, 3.9, 4 ; stage = 0.025, 0.02777778, 0.02777778, 0.02777778, 0.02777778, 0.02777778, 0.02777778, 0.02777778, 0.02777778, 0.02777778, 0.03333334, -0.01111111, 5.782412e-019, 5.782412e-019, 5.782412e-019, 5.782412e-019, 5.782412e-019, 5.782412e-019, 5.782412e-019, 5.782412e-019, ... -0.1654055, -0.1558442, -0.1504084 ; xmomentum = _, _, _, _, _, ,... _, _ ; ymomentum = _, _, _, _, _, ,... _, _ ; } The SWW format is used not only for output but also serves as input for functions such as file_boundary and file_function, described in Chapter 5. An STS file is used for storing a set of points and associated times. It contains, in addition to dimension information, the following variables: • x and y: coordinates of the points, represented as numeric arrays • permutation: Original indices of the points as specified by the optional ordering_file (see the function urs2sts() in Section 6.1.9) • elevation: a numeric array storing bed-elevations • time: a numeric array containing times for model evaluation The only difference between the STS format and the SWW format is the former does not contain a list specifying the points at the vertices of each of the triangles (volumes). Consequently information (arrays) stored within an STS file such as elevation can be accessed in exactly the same way as it would be extracted from an SWW file. A TMS file is used to store time series data that is independent of position. 6.1.4 Mesh File Formats A mesh file is a file that has a specific format suited to triangular meshes and their outlines. A mesh file can have one of two formats: it can be either a TSH file, which is an ASCII file, or an MSH file, which is a NetCDF file. A mesh file can be generated from the function create_mesh_from_regions() (see Section 5.3) and be used to initialise a domain. A mesh file can define the outline of the mesh – the vertices and line segments that enclose the region in which the mesh is created – and the triangular mesh itself, which is specified by listing the triangles and their vertices, and the segments, which are those sides of the triangles that are associated with boundary conditions. In addition, a mesh file may contain ’holes’ and/or ’regions’. A hole represents an area where no mesh is to be created, while a region is a labelled area used for defining properties of a mesh, such as friction values. A hole or region is specified by a point and bounded by a number of segments that enclose that point. A mesh file can also contain a georeference, which describes an offset to be applied to x and y values – e.g. to the vertices. 66 Chapter 6. ANUGA System Architecture 6.1.5 Formats for Storing Arbitrary Points and Attributes A CSV/TXT file is used to store data representing arbitrary numerical attributes associated with a set of points. The format for an CSV/TXT file is: first line: [column names] other lines: [x value], [y value], [attributes] for example: x, y, elevation, friction 0.6, 0.7, 4.9, 0.3 1.9, 2.8, 5.0, 0.3 2.7, 2.4, 5.2, 0.3 The delimiter is a comma. The first two columns are assumed to be x and y coordinates. A PTS file is a NetCDF representation of the data held in an points CSV file. If the data is associated with a set of N points, then the data is stored using an N × 2 numeric array of float variables for the points and an N × 1 numeric array for each attribute. 6.1.6 ArcView Formats Files of the three formats ASC, PRJ and ERS are all associated with data from ArcView. An ASC file is an ASCII representation of DEM output from ArcView. It contains a header with the following format: ncols nrows xllcorner yllcorner cellsize NODATA_value 753 766 314036.58727982 6224951.2960092 100 -9999 The remainder of the file contains the elevation data for each grid point in the grid defined by the above information. A PRJ file is an ArcView file used in conjunction with an ASC file to represent metadata for a DEM. 6.1.7 DEM Format A DEM file in ANUGA is a NetCDF representation of regular DEM data. 6.1.8 Other Formats 6.1.9 Basic File Conversions sww2dem((basename in, basename out=None, quantity=None, reduction=None, cellsize=10, number of decimal places=None, NODATA value=-9999, easting min=None, easting max=None, northing min=None, northing max=None, verbose=False, origin=None, datum=’WGS84’, format=’ers’, block size=None) Module: shallow_water.data_manager 6.1. File Formats 67 Takes data from an SWW file basename_in and converts it to DEM format (ASC or ERS) of a desired grid size cellsize in metres. The user can select how many decimal places the output data is represented with by using number_of_decimal_places, with the default being 3. The easting and northing values are used if the user wishes to determine the output within a specified rectangular area. The reduction input refers to a function to reduce the quantities over all time step of the SWW file, e.g. maximum, or an index referring to a time-step to extract a time-slice of data. dem2pts(basename in, basename out=None, easting min=None, easting max=None, northing min=None, northing max=None, use cache=False, verbose=False) Module: shallow_water.data_manager Takes DEM data (a NetCDF file representation of data from a regular Digital Elevation Model) and converts it to PTS format. urs2sts(basename in, basename out=None, weights=None, verbose=False, origin=None,mean stage=0.0, zscale=1.0, ordering filename=None) Module: shallow_water.data_manager Takes URS data (timeseries data in mux2 format) and converts it to STS format. The optional filename ordering_filename specifies the permutation of indices of points to select along with their longitudes and latitudes. This permutation will also be stored in the STS file. If absent, all points are taken and the permutation will be trivial, i.e. 0, 1, . . . , N − 1, where N is the total number of points stored. csv2building_polygons(file name, floor height=3) Module: shallow_water.data_manager Convert CSV files of the form: easting,northing,id,floors 422664.22,870785.46,2,0 422672.48,870780.14,2,0 422668.17,870772.62,2,0 422660.35,870777.17,2,0 422664.22,870785.46,2,0 422661.30,871215.06,3,1 422667.50,871215.70,3,1 422668.30,871204.86,3,1 422662.21,871204.33,3,1 422661.30,871215.06,3,1 to a dictionary of polygons with id as key. The associated number of floors are converted to m above MSL and returned as a separate dictionary also keyed by id. Optional parameter floor_height is the height of each building story. These can e.g. be converted to a Polygon_function for use with add_quantity as shown on page 50. 68 Chapter 6. ANUGA System Architecture CHAPTER SEVEN ANUGA mathematical background 7.1 Introduction This chapter outlines the mathematics underpinning ANUGA . 7.2 Model The shallow water wave equations are a system of differential conservation equations which describe the flow of a thin layer of fluid over terrain. The form of the equations are: ∂U ∂E ∂G + + =S ∂t ∂x ∂y T where U = h uh vh is the vector of conserved quantities; water depth h, x-momentum uh and y-momentum vh. Other quantities entering the system are bed elevation z and stage (absolute water level) w, where the relation w = z + h holds true at all times. The fluxes in the x and y directions, E and G are given by uh vh E = u2 h + gh2 /2 and G = vuh uvh v 2 h + gh2 /2 and the source term (which includes gravity and friction) is given by 0 S = −gh(zx + Sf x ) −gh(zy + Sf y ) where Sf is the bed friction. The friction term is modelled using Manning’s resistance law √ √ uη 2 u2 + v 2 vη 2 u2 + v 2 Sf x = and Sf y = h4/3 h4/3 in which η is the Manning resistance coefficient. The model does not currently include consideration of kinematic viscosity or dispersion. As demonstrated in our papers, [ZR1999, nielsen2005] these equations and their implementation in ANUGA provide a reliable model of general flows associated with inundation such as dam breaks and tsunamis. 7.3 Finite Volume Method We use a finite-volume method for solving the shallow water wave equations [ZR1999]. The study area is represented by a mesh of triangular cells as in Figure 7.1 in which the conserved quantities of water depth h, and horizontal 69 momentum (uh, vh), in each volume are to be determined. The size of the triangles may be varied within the mesh to allow greater resolution in regions of particular interest. Figure 7.1: Triangular mesh used in our finite volume method. Conserved quantities h, uh and vh are associated with the centroid of each triangular cell. The equations constituting the finite-volume method are obtained by integrating the differential conservation equations over each triangular cell of the mesh. Introducing some notation we use i to refer to the ith triangular cell Ti , and N (i) to the set of indices referring to the cells neighbouring the ith cell. Then Ai is the area of the ith triangular cell and lij is the length of the edge between the ith and jth cells. By applying the divergence theorem we obtain for each volume an equation which describes the rate of change of the average of the conserved quantities within each cell, in terms of the fluxes across the edges of the cells and the effect of the source terms. In particular, rate equations associated with each cell have the form dUi 1 X + Hij lij = Si dt Ai j∈N (i) where • Ui the vector of conserved quantities averaged over the ith cell, • Si is the source term associated with the ith cell, and • Hij is the outward normal flux of material across the ijth edge. The flux Hij is evaluated using a numerical flux function H(·, ·; ·) which is consistent with the shallow water flux in the sense that for all conservation vectors U and normal vectors n H(U, U; n) = E(U)n1 + G(U)n2 . Then Hij = H(Ui (mij ), Uj (mij ); nij ) where mij is the midpoint of the ijth edge and nij is the outward pointing normal, with respect to the ith cell, on the ijth edge. The function Ui (x) for x ∈ Ti is obtained from the vector Uk of conserved average values for the ith and neighbouring cells. We use a second order reconstruction to produce a piece-wise linear function construction of the conserved quantities for all x ∈ Ti for each cell (see Figure 7.2). This function is allowed to be discontinuous across the edges of the cells, but the slope of this function is limited to avoid artificially introduced oscillations. 70 Chapter 7. ANUGA mathematical background Godunov’s method (see [Toro1999]) involves calculating the numerical flux function H(·, ·; ·) by exactly solving the corresponding one dimensional Riemann problem normal to the edge. We use the central-upwind scheme of [KurNP2001] to calculate an approximation of the flux across each edge. Figure 7.2: From the values of the conserved quantities at the centroid of the cell and its neighbouring cells, a discontinuous piecewise linear reconstruction of the conserved quantities is obtained. In the computations presented in this paper we use an explicit Euler timestepping method with variable timestepping adapted to the observed CFL condition: ∆t = min k,i=[0,1,2] min rk rnk,i , vk,i vk,i (7.1) where rk is the radius of the k’th triangle and vk,i is the maximal velocity across edge joining triangle k and it’s i’th neighbour, triangle nk,i , as calculated by the numerical flux function using the central upwind scheme of [KurNP2001]. The symbol rnk,i denotes the radius of the i’th neighbour of triangle k. The radii are calculated as radii of the inscribed circles of each triangle. 7.4 Flux limiting The shallow water equations are solved numerically using a finite volume method on an unstructured triangular grid. The upwind central scheme due to Kurganov and Petrova is used as an approximate Riemann solver for the computation of inviscid flux functions. This makes it possible to handle discontinuous solutions. To alleviate the problems associated with numerical instabilities due to small water depths near a wet/dry boundary we employ a new flux limiter that ensures that unphysical fluxes are never encountered. Let u and v be the velocity components in the x and y direction, w the absolute water level (stage) and z the bed elevation. The latter are assumed to be relative to the same height datum. The conserved quantities tracked by ANUGA are momentum in the x-direction (µ = uh), momentum in the y-direction (ν = vh) and depth (h = w − z). The flux calculation requires access to the velocity vector (u, v) where each component is obtained as u = µ/h and v = ν/h respectively. In the presence of very small water depths, these calculations become numerically unreliable and will typically cause unphysical speeds. We have employed a flux limiter which replaces the calculations above with the limited approximations. û = 7.4. Flux limiting µ ν , v̂ = , h + h0 /h h + h0 /h (7.2) 71 where h0 is a regularisation parameter that controls the minimal magnitude of the denominator. Taking the limits we have for û µ =0 lim û = lim h→0 h→0 h + h0 /h and lim û = lim h→∞ h→∞ µ µ = =u h + h0 /h h with similar results for v̂. The maximal value of û is attained when h + h0 /h is minimal or (by differentiating the denominator) 1 − h0 /h2 = 0 or h0 = h2 ANUGA has a global parameter H0 that controls the minimal depth which is considered in the various equations. This parameter is typically set to 10−3 . Setting h0 = H02 provides a reasonable balance between accuracy and stability. In fact, setting h = H0 will scale the predicted speed by a factor of 0.5: µ µ µ u µ = = = = h + h0 /h h=H0 H0 + H02 /H0 2H0 2h 2 In general, for multiples of the minimal depth N H0 one obtains µ µ µ = = h + h0 /h h=N H0 N H0 + H0 /N h(1 + 1/N 2 ) (7.3) which converges quadratically to the true value with the multiple N. Although this equation can be used for any depth, we have restricted its use to depths less than 10 ∗ H0 (or 1 cm) to computational resources. According to Equation 7.3 this cutoff affects the calculated velocity by less than 1 %. 7.5 Slope limiting A multidimensional slope-limiting technique is employed to achieve second-order spatial accuracy and to prevent spurious oscillations. This is using the MinMod limiter and is documented elsewhere. However close to the bed, the limiter must ensure that no negative depths occur. On the other hand, in deep water, the bed topography should be ignored for the purpose of the limiter. Let w, z, h be the stage, bed elevation and depth at the centroid and let wi , zi , hi be the stage, bed elevation and depth at vertex i. Define the minimal depth across all vertices as hmin as hmin = min hi i Let w̃i be the stage obtained from a gradient limiter limiting on stage only. The corresponding depth is then defined as h̃i = w̃i − zi We would use this limiter in deep water which we will define (somewhat boldly) as hmin ≥ 72 Chapter 7. ANUGA mathematical background Similarly, let w̄i be the stage obtained from a gradient limiter limiting on depth respecting the bed slope. The corresponding depth is defined as h̄i = w̄i − zi We introduce the concept of a balanced stage wi which is obtained as the linear combination wi = αw̃i + (1 − α)w̄i or wi = zi + αh̃i + (1 − α)h̄i where α ∈ [0, 1]. Since w̃i is obtained in ’deep’ water where the bedslope is ignored we have immediately that α = 1 for hmin ≥ If hmin < we want to use the ’shallow’ limiter just enough that no negative depths occur. Formally, we will require that αh̃i + (1 − α)h̄i > , ∀i or α(h̃i − h̄i ) > − h̄i , ∀i (7.4) There are two cases: 1. h̄i ≤ h̃i : The deep water (limited using stage) vertex is at least as far away from the bed than the shallow water (limited using depth). In this case we won’t need any contribution from h̄i and can accept any α. E.g. α = 1 reduces Equation 7.4 to h̃i > whereas α = 0 yields h̄i > all well and good. 2. h̄i > h̃i : In this case the the deep water vertex is closer to the bed than the shallow water vertex or even below the bed. In this case we need to find an α that will ensure a positive depth. Rearranging Equation 7.4 and solving for α one obtains the bound − h̄i , ∀i α< h̃i − h̄i Ensuring Equation 7.4 holds true for all vertices one arrives at the definition α = min i h̄i − h̄i − h̃i which will guarantee that no vertex ’cuts’ through the bed. Finally, should h̄i < and therefore α < 0, we suggest setting α = 0 and similarly capping α at 1 just in case. 7.5. Slope limiting 73 74 CHAPTER EIGHT Basic ANUGA Assumptions 8.1 Time Physical model time cannot be earlier than 1 Jan 1970 00:00:00. If one wished to recreate scenarios prior to that date it must be done using some relative time (e.g. 0). The ANUGA domain has an attribute starttime which is used in cases where the simulation should be started later than the beginning of some input data such as those obtained from boundaries or forcing functions (hydrographs, file boundary etc). The domain.startime may be adjusted in file_boundary in the case the input data does not itself start until a later time. 8.2 8.2.1 Spatial data Projection All spatial data relates to the WGS84 datum (or GDA94) and assumes a projection into UTM with false easting of 500000 and false northing of 1000000 on the southern hemisphere (0 on the northern hemisphere). All locations must consequently be specified in Cartesian coordinates (eastings, northings) or (x,y) where the unit is metres. Alternative projections can be used, but ANUGA does have the concept of a UTM zone that must be the same for all coordinates in the model. 8.2.2 Internal coordinates It is important to realise that for numerical precision ANUGA uses coordinates that are relative to the lower left node of the rectangle containing the mesh (xmin , ymin ). This origin is referred to internally as xllcorner, yllcorner following the ESRI ASCII grid notation. The SWW file format also includes xllcorner, yllcorner and any coordinate in the file should be adjusted by adding this origin. See Section 6.1.3. Throughout the ANUGA interface, functions have optional boolean arguments absolute which controls whether spatial data received is using the internal representation (absolute=False) or the user coordinate set (absolute=True). See e.g. get_vertex_coordinates() on 48. DEMs, meshes and boundary conditions can have different origins. However, the internal representation in ANUGA will use the origin of the mesh. 75 8.2.3 Polygons When generating a mesh it is assumed that polygons do not cross. Having polygons that cross can cause bad meshes to be produced or the mesh generation itself may fail. 76 Chapter 8. Basic ANUGA Assumptions APPENDIX A Supporting Tools This section describes a number of supporting tools, supplied with ANUGA , that offer a variety of types of functionality and can enhance the basic capabilities of ANUGA . A.1 caching The cache function is used to provide supervised caching of function results. A Python function call of the form: result = func(arg1, ..., argn) can be replaced by: from caching import cache result = cache(func,(arg1, ..., argn)) which returns the same output but reuses cached results if the function has been computed previously in the same context. result and the arguments can be simple types, tuples, list, dictionaries or objects, but not unhashable types such as functions or open file objects. The function func may be a member function of an object or a module. This type of caching is particularly useful for computationally intensive functions with few frequently used combinations of input arguments. Note that if the inputs or output are very large caching may not save time because disc access may dominate the execution time. If the function definition changes after a result has been cached, this will be detected by examining the functions bytecode and the function will be recomputed. However, caching will not detect changes in modules used by func. In this case the cache must be cleared manually. Options are set by means of the function set_option(key, value), where key is a key associated with a Python dictionary options. This dictionary stores settings such as the name of the directory used, the maximum number of cached files allowed, and so on. The cache function allows the user also to specify a list of dependent files. If any of these have been changed, the function is recomputed and the results stored again. USAGE: result = cache(func, args, kwargs, dependencies, cachedir, verbose, compression, evaluate, test, return_filename) 77 A.2 anuga viewer The output generated by ANUGA may be viewed by means of the visualisation tool anuga_viewer, which takes an SWW file generated by ANUGA and creates a visual representation of the data. Examples may be seen in Figures 4.1 and 4.2. To view an SWW file with anuga_viewer in the Windows environment you have to run it in a command line as in anuga_viewer <swwfile> or if a georeferenced tif file (or jpg cut to the same shape as the domain) is needed anuga_viewer <swwfile> <tif file> 78 Appendix A. Supporting Tools A.3 utilities/polygons class <callable> = Polygon_function(regions, default=0.0, geo reference=None) Module: utilities.polygon Creates a callable object that returns one of a specified list of values when evaluated at a point (x, y), depending on which polygon, from a specified list of polygons, the point belongs to. regions is a list of pairs (P, v), where each P is a polygon and each v is either a constant value or a function of coordinates x and y, specifying the return value for a point inside P. default may be used to specify a value (or a function) for a point not lying inside any of the specified polygons. When a point lies in more than one polygon, the return value is taken to be the value for whichever of these polygon appears later in the list. geo_reference refers to the status of points that are passed into the function. Typically they will be relative to some origin. Typical usage may take the form: set_quantity(’elevation’, Polygon_function([(P1, v1), (P2, v2)], default=v3, geo_reference=domain.geo_reference)) <polygon> = read_polygon(filename, split=’,’) Module: utilities.polygon Reads the specified file and returns a polygon. Each line of the file must contain exactly two numbers, separated by a delimiter, which are interpreted as coordinates of one vertex of the polygon. filename is the path to the file to read. split sets the delimiter character between the numbers on one line of the file. If not specified, the delimiter is the ’,’ character. populate_polygon(polygon, number of points, seed=None, exclude=None) Module: utilities.polygon Populates the interior of the specified polygon with the specified number of points, selected by means of a uniform distribution function. polygon is the polygon to populate. number_of_points is the (optional) number of points. seedis the optional seed for random number generator. exclude is a list of polygons (inside main polygon) from where points should be excluded. <point> = point_in_polygon(polygon, delta=1e-8) Module: utilities.polygon Returns a point inside the specified polygon √ and close to the edge. The distance between the returned point and the nearest point of the polygon is less than 2 times the second argument delta, which is taken as 10−8 by default. <array> = inside_polygon(points, polygon, closed=True, verbose=False) Module: utilities.polygon Get a set of points that lie inside a given polygon. points is the list of points to test. polygon is the polygon to test the points against. A.3. utilities/polygons 79 closed specifies if points on the polygon edge are considered to be inside or outside the polygon – True means they are inside. Returns a numeric array comprising the indices of the points in the list that lie inside the polygon. If none of the points are inside, returns zeros((0,), ’l’) (ie, an empty numeric array). Compare with outside_polygon(), page 80. <array> = outside_polygon(points, polygon, closed=True, verbose=False) Module: utilities.polygon Get a set of points that lie outside a given polygon. points is the list of points to test. polygon is the polygon to test the points against. closed specifies if points on the polygon edge are considered to be outside or inside the polygon – True means they are outside. Returns a numeric array comprising the indices of the points in the list that lie outside the polygon. If none of the points are outside, returns zeros((0,), ’l’) (ie, an empty numeric array). Compare with inside_polygon(), page 79. <boolean> = is_inside_polygon(point, polygon, closed=True, verbose=False) Module: utilities.polygon Determines if a single point is inside a polygon. point is the point to test. polygon is the polygon to test point against. closed is a flag that forces the function to consider a point on the polygon edge to be inside or outside – if True a point on the edge is considered inside the polygon. Returns True if point is inside polygon. Compare with inside_polygon(), page 79. <boolean> = is_outside_polygon(point, polygon, closed=True, verbose=False, ) Module: utilities.polygon Determines if a single point is outside a polygon. point is the point to test. polygon is the polygon to test point against. closed is a flag that forces the function to consider a point on the polygon edge to be outside or inside – if True a point on the edge is considered inside the polygon. Compare with outside_polygon(), page 80. <boolean> = point_on_line(point, line, rtol=1.0e-5, atol=1.0e-8) Module: utilities.polygon Determine if a point is on a line to some tolerance. The line is considered to extend past its end-points. point is the point to test ([x, y]). line is the line to test point against ([[x1,y1], [x2,y2]]). rtol is the relative tolerance to use when testing for coincidence. atol is the absolute tolerance to use when testing for coincidence. Returns True if the point is on the line, else False. (indices, count) = separate_points_by_polygon(points, polygon, closed=True, put=True, verbose=False) separate_points_by_polygon Module: utilities.polygon check in- Separate a set of points into points that are inside and outside a polygon. 80 Appendix A. Supporting Tools points is a list of points to separate. polygon is the polygon used to separate the points. closed determines whether points on the polygon edge should be regarded as inside or outside the polygon. True means they are inside. check_input specifies whether the input parameters are checked – True means check the input parameters. The function returns a tuple (indices, count) where indices is a list of point indices from the input points list, with the indices of points inside the polygon at the left and indices of points outside the polygon listed at the right. The count value is the count (from the left) of the indices of the points inside the polygon. <area> = polygon_area(polygon) Module: utilities.polygon Returns area of an arbitrary polygon (reference http://mathworld.wolfram.com/PolygonArea.html). [xmin , xmax , ymin , ymax ] = plot_polygons(polygons points, style=None, figname=None, label=None, verbose=False) Module: utilities.polygon Plot a list of polygons to a file. polygons_points is a list of polygons to plot. style is a list of style strings to be applied to the corresponding polygon in polygons_points. A polygon can be closed for plotting purposes by assigning the style string ’line’ to it in the appropriate place in the style list. The default style is ’line’. figname is the path to the file to save the plot in. If not specified, use ‘test image.png’. The function returns a list containing the minimum and maximum of the points in all the input polygons, i.e. [xmin , xmax , ymin , ymax ]. A.3. utilities/polygons 81 A.4 82 coordinate transforms Appendix A. Supporting Tools A.5 geospatial data This describes a class that represents arbitrary point data in UTM coordinates along with named attribute values. attributes=None, geo reference=None, default attribute class Geospatial_data(data points=None, name=None, file name=None, latitudes=None, longitudes=None, points are lats longs=False, max read lines=None, load file now=True, verbose=False) Module: geospatial_data.geospatial_data This class is used to store a set of data points and associated attributes, allowing these to be manipulated by methods defined for the class. The data points are specified either by reading them from a NetCDF or CSV file, identified through the parameter file_name, or by providing their x- and y-coordinates in metres, either as a sequence of 2-tuples of floats or as an M × 2 numeric array of floats, where M is the number of points. Coordinates are interpreted relative to the origin specified by the object geo_reference, which contains data indicating the UTM zone, easting and northing. If geo_reference is not specified, a default is used. Attributes are specified through the parameter attributes, set either to a list or array of length M or to a dictionary whose keys are the attribute names and whose values are lists or arrays of length M . One of the attributes may be specified as the default attribute, by assigning its name to default_attribute_name. If no value is specified, the default attribute is taken to be the first one. Note that the Geospatial_data object currently reads entire datasets into memory i.e. no memomry blocking takes place. For this we refer to the set_quantity() method which will read PTS and CSV files into ANUGA using memory blocking allowing large files to be used. <Geospatial_data>.import_points_file(file name, delimiter=None, verbose=False) Module: geospatial_data.geospatial_data Import a TXT, CSV or PTS points data file into a codeGeospatial data object. file_name is the path to a TXT, CSV or PTS points data file. delimiter is currently unused. <Geospatial_data>.export_points_file(file name, absolute=True, as lat long=False, isSouthHemisphere=True) Module: geospatial_data.geospatial_data Export a CSV or PTS points data file from a Geospatial_data object. file_name is the path to the CSV or PTS points file to write. absolute determines if the exported data is absolute or relative to the Geospatial_data object geo reference. If True the exported data is absolute. as_lat_long exports the points data as latitudes and longitudes if True. isSouthHemisphere has effect only if as_lat_long is True and causes latitude/longitude values to be for the southern (True) or northern hemispheres (False). points = <Geospatial_data>.get_data_points(absolute=True, geo reference=None, long=False, isSouthHemisphere=True) Module: geospatial_data.geospatial_data as lat - Get the coordinates for all the data points as an N × 2 array. absolute determines if the exported data is absolute or relative to the Geospatial_data object geo reference. If True the exported data is absolute. geo_reference is the geo reference the points are relative to, if supplied. as_lat_long exports the points data as latitudes and longitudes if True. isSouthHemisphere has effect only if as_lat_long is True and causes latitude/longitude values to be for the southern (True) or northern hemispheres (False). A.5. geospatial data 83 <Geospatial_data>.set_attributes(attributes) Module: geospatial_data.geospatial_data Set the attributes for a Geospatial_data object. attributes is the new value for the object’s attributes. May be a dictionary or None. atributes = <Geospatial_data>.get_attributes(attribute name=None) Module: geospatial_data.geospatial_data Get a named attribute from a Geospatial_data object. attribute_name is the name of the desired attribute. If None, return the default attribute. <Geospatial_data>.get_all_attributes() Module: geospatial_data.geospatial_data Get all attributes of a Geospatial_data object. Returns None or the attributes dictionary (which may be empty). <Geospatial_data>.set_default_attribute_name(default attribute name) Module: geospatial_data.geospatial_data Set the default attribute name of a Geospatial_data object. default_attribute_name is the new default attribute name. <Geospatial_data>.set_geo_reference(geo reference) Module: geospatial_data.geospatial_data Set the internal geo reference of a Geospatial_data object. geo_reference is the new internal geo reference for the object. If None will use the default geo reference. If the Geospatial_data object already has an internal geo reference then the points data will be changed to use the new geo reference. <Geospatial_data>.__add__(other) Module: geospatial_data.geospatial_data The __add__() method is defined so it is possible to add two Geospatial_data objects. geospatial = <Geospatial_data>.clip(polygon, closed=True, verbose=False) Module: geospatial_data.geospatial_data Clip a Geospatial_data object with a polygon. polygon is the polygon to clip the Geospatial_data object with. This may be a list of points, an N × 2 array or a Geospatial_data object. closed determines whether points on the polygon edge are inside (True) or outside (False) the polygon. Returns a new Geospatial_data object representing points inside the Compare with clip_outside(), page 84. specified polygon. geospatial = <Geospatial_data>.clip_outside(polygon, closed=True, verbose=False) Module: geospatial_data.geospatial_data Clip a Geospatial_data object with a polygon. polygon is the polygon to clip the Geospatial_data object with. This may be a list of points, an N × 2 array or a Geospatial_data object. closed determines whether points on the polygon edge are inside (True) or outside (False) the polygon. Returns a new Geospatial_data object representing points outside the specified polygon. Compare with clip(), page 84. 84 Appendix A. Supporting Tools (g1, g2) = <Geospatial_data>.split(factor=0.5, seed num=None, verbose=False) Module: geospatial_data.geospatial_data Split a Geospatial_data object into two objects of predetermined ratios. factor is the ratio of the size of the first returned object to the original object. If ’0.5’ is supplied, the two resulting objects will be of equal size. seed_num, if supplied, will be the random number generator seed used for the split. Points of the two new geospatial data object are selected RANDOMLY. Returns two geospatial data objects that are disjoint sets of the original. A.5.1 Miscellaneous Functions The functions here are not Geospatial_data object methods, but are used with them. X = find_optimal_smoothing_parameter(data file, alpha list=None, mesh file=None, boundary poly=None, mesh resolution=100000, north boundary=None, south boundary=None, east boundary=None, west boundary=None, plot name=’all alphas’, split factor=0.1, seed num=None, cache=False, verbose=False) Module: geospatial_data.geospatial_data Calculate the minimum covariance from a set of points in a file. It does this by removing a small random sample of points from data_file and creating models with different alpha values from alpha_list and cross validates the predicted value to the previously removed point data. Returns the alpha value which has the smallest covariance. data_file is the input data file and must not contain points outside the boundaries defined and is either a PTS, TXT or CSV file. alpha_list is the list of alpha values to use. mesh_file is the path to a mesh file to create (if supplied). If None a mesh file will be created (named ‘temp.msh’). NOTE: if there is a mesh_resolution defined or any boundaries are defined, any input mesh_file value is ignored. mesh_resolution is the maximum area size for a triangle. north_boundary south_boundary east_boundary west_boundary are the boundary values to use. plot_name is the path name of the plot file to write. seed_num is the random number generator seed to use. The function returns a tuple (min_covar, alpha) where min_covar is the minumum normalised covariance and alpha is the alpha value that created it. A plot file is also written. A.5. geospatial data 85 This is an example of function usage: convariance_value, alpha = \ find_optimal_smoothing_parameter(data_file=fileName, alpha_list=[0.0001, 0.01, 1], mesh_file=None, mesh_resolution=3, north_boundary=5, south_boundary=-5, east_boundary=5, west_boundary=-5, plot_name=’all_alphas’, seed_num=100000, verbose=False) NOTE: The function will not work if the data_file extent is greater than the boundary_poly polygon or any of the boundaries, e.g. north_boundary, etc. 86 Appendix A. Supporting Tools A.6 Graphical Mesh Generator GUI The program graphical_mesh_generator.py in the pmesh module allows the user to set up the mesh of the problem interactively. It can be used to build the outline of a mesh or to visualise a mesh automatically generated. Graphical Mesh Generator will let the user select various modes. The current allowable modes are vertex, segment, hole or region. The mode describes what sort of object is added or selected in response to mouse clicks. When changing modes any prior selected objects become deselected. In general the left mouse button will add an object and the right mouse button will select an object. A selected object can de deleted by pressing the the middle mouse button (scroll bar). A.6. Graphical Mesh Generator GUI 87 A.7 class Alpha Shape Alpha shapes are used to generate close-fitting boundaries around sets of points. The alpha shape algorithm produces a shape that approximates to the ’shape formed by the points’ – or the shape that would be seen by viewing the points from a coarse enough resolution. For the simplest types of point sets, the alpha shape reduces to the more precise notion of the convex hull. However, for many sets of points the convex hull does not provide a close fit and the alpha shape usually fits more closely to the original point set, offering a better approximation to the shape being sought. In ANUGA , an alpha shape is used to generate a polygonal boundary around a set of points before mesh generation. The algorithm uses a parameter α that can be adjusted to make the resultant shape resemble the shape suggested by intuition more closely. An alpha shape can serve as an initial boundary approximation that the user can adjust as needed. The following paragraphs describe the class used to model an alpha shape and some of the important methods and attributes associated with instances of this class. class Alpha_Shape(points, alpha=None) Module: alpha_shape Instantiate an instance of the Alpha_Shape class. points is an N × 2 list of points ([[x1, y1],[x2, y2]. . . ]). alpha is the ’fitting’ parameter. alpha_shape_via_files(point file, boundary file, alpha= None) Module: alpha_shape This function reads points from the specified point file point_file, computes the associated alpha shape (either using the specified value for alpha or, if no value is specified, automatically setting it to an optimal value) and outputs the boundary to a file named boundary_file. This output file lists the coordinates (x, y) of each point in the boundary, using one line per point. <Alpha_shape>.set_boundary_type(raw boundary=True, remove holes=False, smooth indents=False, expand pinch=False, boundary points fraction=0.2) Module: alpha_shape This function sets internal state that controls how the Alpha_shape boundary is presented or exported. raw_boundary sets the type to raw if True, i.e. the regular edges of the alpha shape. remove_holes, if True removes small holes (’small’ is defined by boundary_points_fraction). smooth_indents, if True removes sharp triangular indents in the boundary. expand_pinch, if True tests for pinch-off and corrects – preventing a boundary vertex from having more than two edges. boundary = <Alpha_shape>.get_boundary() Module: alpha_shape Returns a list of tuples representing the boundary of the alpha shape. Each tuple represents a segment in the boundary by providing the indices of its two endpoints. See set_boundary_type(), page 88. <Alpha_shape>.write_boundary(file name) Module: alpha_shape Writes the list of 2-tuples returned by get_boundary() to the file file_name, using one line per tuple. See set_boundary_type(), page 88. See get_boundary(), page 88. 88 Appendix A. Supporting Tools A.8 Numerical Tools The following table describes some useful numerical functions that may be found in the module utilities.numerical_tools: angle(v1, v2=None) Angle between two-dimensional vectors v1 and v2, or between v1 and the x-axis if v2 is None. Value is in range 0 to 2π. normal_vector(v) Normal vector to v. mean(x) Mean value of a vector x. cov(x, y=None) Covariance of vectors x and y. If y is None, returns cov(x, x). err(x, y=0, n=2, relative=True) Relative error of kx−yk to kyk (2-norm if n = 2 or Max norm if n = None). If denominator evaluates to zero or if y is omitted or if relative=False, absolute error is returned. norm(x) 2-norm of x. corr(x, y=None) Correlation of x and y. If y is None returns autocorrelation of x. ensure_numeric(A, typecode=None) Returns a numeric array for any sequence A. If A is already a numeric array it will be returned unaltered. Otherwise, an attempt is made to convert it to a numeric array. (Needed because array(A) can cause memory overflow.) histogram(a, bins, relative=False) Standard histogram. If relative is True, values will be normalised against the total and thus represent frequencies rather than counts. create_bins(data, number_of_bins=None) Safely create bins for use with histogram. If data contains only one point or is constant, one bin will be created. If number_of_bins is omitted, 10 bins will be created. A.9 Finding the Optimal Alpha Value The function ???? more to come very soon A.8. Numerical Tools 89 90 APPENDIX B ANUGA Full-scale Validations B.1 Overview There are some long-running validations that are not included in the small-scale validations that run when you execute the validate_all.py script in the anuga_validation/automated_validation_test directory. These validations are not run automatically since they can take a large amount of time and require an internet connection and user input. B.2 Patong Beach The Patong Beach validation is run from the automated_validation_tests/patong_beach_validation directory. Just execute the validate_patong.py script in that directory. This will run a Patong Beach simulation and compare the generated SWW file with a known good copy of that file. The script attempts to refresh the validation data files from master copies held on the Sourceforge project site. If you don’t have an internet connection you may still run the validation, as long as you have the required files. You may download the validation data files by hand and then run the validation. Just go to the ANUGA Sourceforge project download page at http://sourceforge.net/project/showfiles.php?group_id=172848 and select the validation_data package, patong-1.0 release. You need the data.tgz file and one or more of the patong.sww.{BASIC|TRIAL|FINAL}.tgz files. The BASIC validation is the quickest and the FINAL validation is the slowest. The validate.py script will use whatever files you have, BASIC first and FINAL last. 91 92 APPENDIX C Frequently Asked Questions The Frequently Asked Questions have been move to the online FAQ at: https://datamining.anu.edu.au/anuga/wiki/FrequentlyAskedQuestions 93 94 APPENDIX D Glossary Term ANUGA bathymetry conserved quantity Digital Elevation Model (DEM) Dirichlet boundary edge elevation evolution finite volume method forcing term flux grid latitude longitude Manning friction coefficient mesh mesh file NetCDF node northing points file Definition Name of software (joint development between ANU and GA) offshore elevation conserved (stage, x and y momentum) DEMs are digital files consisting of points of elevations, sampled systematically at equally spaced intervals. A boundary condition imposed on a differential equation that specifies the values the solution is to take on the boundary of the domain. A triangular cell within the computational mesh can be depicted as a set of vertices joined by lines (the edges). refers to bathymetry and topography integration of the shallow water wave equations over time The method evaluates the terms in the shallow water wave equation as fluxes at the surfaces of each finite volume. Because the flux entering a given volume is identical to that leaving the adjacent volume, these methods are conservative. Another advantage of the finite volume method is that it is easily formulated to allow for unstructured meshes. The method is used in many computational fluid dynamics packages. Page i 11 the amount of flow through the volume per unit time Evenly spaced mesh The angular distance on a mericlear north and south of the equator, expressed in degrees and minutes. The angular distance east or west, between the meridian of a particular place on Earth and that of the Prime Meridian (located in Greenwich, England) expressed in degrees or time. Triangulation of domain A TSH or MSH file 25 A point at which edges meet A rectangular (x,y) coordinate measurement of distance north from a north-south reference line, usually a meridian used as the axis of origin within a map zone or projection. Northing is a UTM (Universal Transverse Mercator) coordinate. A PTS or CSV file 95 polygon resolution reflective boundary stage anuga viewer time boundary topography transmissive boundary vertex xmomentum ymomentum 96 A sequence of points in the plane. ANUGA represents a polygon either as a list consisting of Python tuples or lists of length 2 or as an N × 2 numeric array, where N is the number of points. The unit square, for example, would be represented either as [ [0,0], [1,0], [1,1], [0,1] ] or as array( [0,0], [1,0], [1,1], [0,1] ). NOTE: For details refer to the module utilities/polygon.py. The maximal area of a triangular cell in a mesh Models a solid wall. Returns same conserved quantities as those present in the neighbouring volume but reflected. Specific to the shallow water equation as it works with the momentum quantities assumed to be the second and third conserved quantities. visualisation tool used with ANUGA Returns values for the conserved quantities as a function of time. The user must specify the domain to get access to the model time. onshore elevation 11 78 11 11 A point at which edges meet. conserved quantity (note, two-dimensional SWW equations say only x and y and NOT z) conserved quantity Appendix D. Glossary INDEX (g1, g2) = <Geospatial_data>.split() (Geospatial data method), 85 (indices, count) = separate_points_by_polygon() (in module utilities.polygon), 80 (time, Q) = get_flow_through_cross_section() (in module ), 61 (x, y) = get_maximum_inundation_location() (in module ), 61 <area> = polygon_area() (in module utilities.polygon), 81 <array> = inside_polygon() (in module utilities.polygon), 79 <array> = outside_polygon() (in module utilities.polygon), 80 <boolean> = is_inside_polygon() (in module utilities.polygon), 80 <boolean> = is_outside_polygon() (in module utilities.polygon), 80 <boolean> = point_on_line() (in module utilities.polygon), 80 <callable> = Polygon_function (class in utilities.polygon), 79 <point> = point_in_polygon() (in module utilities.polygon), 79 <polygon> = read_polygon() (in module utilities.polygon), 79 [xmin , xmax , ymin , ymax ] = plot_polygons() (in module utilities.polygon), 81 ANUGA , i ANUGA , 95 <Alpha_shape>.set_boundary_type() (Alpha Shape method), 88 <Alpha_shape>.write_boundary() (Alpha Shape method), 88 <Geospatial_data>.__add__() (Geospatial data method), 84 <Geospatial_data>.export_points_file() (Geospatial data method), 83 <Geospatial_data>.get_all_attributes() (Geospatial data method), 84 <Geospatial_data>.import_points_file() (Geospatial data method), 83 <Geospatial_data>.set_attributes() (Geospatial data method), 84 <Geospatial_data>.set_default_attribute_name() (Geospatial data method), 84 <Geospatial_data>.set_geo_reference() (Geospatial data method), 84 <callable_object> = Interpolation_function (class in ), 51 <callable_object> = file_function() (in module ), 51 <domain>.add_quantity() ( method), 50 <domain>.boundary_statistics() ( method), 58 <domain>.evolve() ( method), 57 <domain>.get_boundary_tags() ( method), 52 <domain>.get_centroid_coordinates() (Domain method), 48 <domain>.get_datadir() (Domain method), 46 <domain>.get_disconnected_triangles() (Domain method), 48 <domain>.get_maximum_inundation_elevation() ( method), 60 <domain>.get_maximum_inundation_location() ( method), 60 <domain>.get_name() (Domain method), 46 <domain>.get_nodes() (Domain method), 48 <domain>.get_triangles() (Domain method), 48 <domain>.get_vertex_coordinates() (Domain method), 48 <domain>.get_wet_elements() ( method), 60 <domain>.quantity_statistics() ( method), 59 <domain>.set_boundary() ( method), 52 <domain>.set_datadir() (Domain method), 46 <domain>.set_default_order() (Domain method), 47 <domain>.set_maximum_allowed_speed() (Domain method), 47 97 <domain>.set_minimum_allowed_height() (Domain method), 47 <domain>.set_minimum_storable_height() (Domain method), 47 <domain>.set_name() (Domain method), 46 <domain>.set_quantities_to_be_monitored() ( method), 58 <domain>.set_quantities_to_be_stored() (Domain method), 48 <domain>.set_quantity() ( method), 49 <domain>.set_region() ( method), 50 <domain>.set_store_vertices_uniquely() (Domain method), 47 <domain>.set_time() (Domain method), 47 <domain>.statistics() ( method), 58 <domain>.timestepping_statistics() ( method), 58 <mesh>.add_hole() (Mesh method), 44 <mesh>.add_hole_from_polygon() (Mesh method), 44 <mesh>.add_points_and_segments() (Mesh method), 44 <mesh>.add_region() (Mesh method), 44 <mesh>.add_region_from_polygon() (Mesh method), 45 <mesh>.add_vertices() (Mesh method), 45 <mesh>.auto_segment() (Mesh method), 45 <mesh>.export_mesh_file() (Mesh method), 45 <mesh>.generate_mesh() (Mesh method), 45 <mesh>.import_ungenerate_file() (Mesh method), 45 <quantity>.get_integral() ( method), 60 <quantity>.get_maximum_location() ( method), 60 <quantity>.get_maximum_value() ( method), 60 <quantity>.get_values() ( method), 59 <quantity>.set_values() ( method), 59 Alpha_Shape (class in ), 88 alpha_shape_via_files() (in module ), 88 ANUGA credits, ii licence, ii anuga viewer, 96 atributes = <Geospatial_data>.get_attributes() (Geospatial data method), 84 bathymetry, 95 boundary = <Alpha_shape>.get_boundary() (Alpha Shape method), 88 boundary conditions, 11, 30, 52 conserved quantity, 95 98 create_domain_from_regions() (in module ), 43 create_mesh_from_regions() (in module ), 42 csv2building_polygons() (in module ), 68 Culvert_flow (class in ), 55 dem2pts() (in module ), 68 Digital Elevation Model (DEM), 95 Dirichlet boundary, 95 Dirichlet_boundary (class in ), 52 Dirichlet_discharge_boundary (class in ), 53 Documentation, 39 Domain (class in ), 46 edge, 95 elevation, 95 elevation = get_maximum_inundation_elevation() (in module ), 61 evolution, 13, 57, 95 Field_boundary (class in ), 53 File_boundary (class in ), 53 finite volume method, 95 flux, 95 forcing term, 95 Forcing terms, 54 General_forcing (class in ), 54 geospatial = <Geospatial_data>.clip() (Geospatial data method), 84 geospatial = <Geospatial_data>.clip_outside() (Geospatial data method), 84 Geospatial_data (class in ), 83 grid, 95 Inflow (class in ), 55 Initial Conditions, 49 Initialising the Domain, 46 latitude, 95 longitude, 95 Manning friction coefficient, 95 Mesh generation, 40 Mesh (class in ), 44 mesh, 95 mesh file, 25, 95 mesh, establishing, 9, 16, 24 NetCDF, 95 node, 95 northing, 95 points = <Geospatial_data>.get_data_points() (Geospatial data method), 83 Index points file, 95 polygon, 96 populate_polygon() (in module utilities.polygon), 79 public vs private interface, 39 Q = <domain>.get_quantity() ( method), 58 quantity = <domain>.create_quantity_from_expression() ( method), 62 Rainfall (class in ), 55 reflective boundary, 96 Reflective_boundary (class in ), 52 resolution, 96 separate_points_by_polygon, 80 slump_tsunami() (in module ), 50 stage, i, 96 sww2dem() (in module ), 67 sww2timeseries() (in module ), 61 time boundary, 96 Time_boundary (class in ), 52 topography, 96 transmissive boundary, 96 Transmissive_boundary (class in ), 52 Transmissive_momentum_set_stage_boundary (class in ), 53 Transmissive_stage_zero_momentum_boundary (class in ), 53 urs2sts() (in module ), 68 utilities.polygon (module), 79 utilities.polygon (standard module), 79 vertex, 96 X = find_optimal_smoothing_parameter() (Geospatial data method), 85 xmomentum, 96 ymomentum, 96 Index 99 100 BIBLIOGRAPHY [nielsen2005] Hydrodynamic modelling of coastal inundation. Nielsen, O., S. Roberts, D. Gray, A. McPherson and A. Hitchman. In Zerger, A. and Argent, R.M. (eds) MODSIM 2005 International Congress on Modelling and Simulation. Modelling and Simulation Society of Australia and New Zealand, December 2005, pp. 518-523. ISBN: 0-9758400-2-9. http://www.mssanz.org.au/modsim05/papers/nielsen.pdf [grid250] Australian Bathymetry and Topography Grid, June 2005. Webster, M.A. and Petkovic, P. Geoscience Australia Record 2005/12. ISBN: 1-920871-46-2. http://www.ga.gov.au/meta/ANZCW0703008022.html [ZR1999] Catastrophic Collapse of Water Supply Reservoirs in Urban Areas. C. Zoppou and S. Roberts. ASCE J. Hydraulic Engineering, 125(7):686–695, 1999. [Toro1999] Riemann problems and the waf method for solving the two-dimensional shallow water equations. E. F. Toro. Philosophical Transactions of the Royal Society, Series A, 338:43–68, 1992. [KurNP2001] Semidiscrete central-upwind schemes for hyperbolic conservation laws and hamilton-jacobi equations. A. Kurganov, S. Noelle, and G. Petrova. SIAM Journal of Scientific Computing, 23(3):707–740, 2001. 101