1
OSA 5565
Synchronization Test Set
With WinSTS V3.0x
USER MANUAL
OSA 5565 User Manual Revision A
April 2010
This page has been intentionally left blank
OSA 5565 User Manual Revision A
April 2010
ii
What's new in this revision
Creation
OSA 5565 User Manual Revision A
April 2010
iii
This page has been intentionally left blank
OSA 5565 User Manual Revision A
April 2010
iv
Contents
Table of Contents
1
2
INTRODUCTION .................................................................................................................1-1
1.1
About this Manual...................................................................................................1-3
1.2
Reading Guide ........................................................................................................1-4
1.3
Safety Instructions .................................................................................................1-5
1.4
Warranty..................................................................................................................1-8
1.5
Certification ............................................................................................................1-9
GENERAL DESCRIPTION ..................................................................................................2-1
2.1
3
4
5
Page
Overview .................................................................................................................2-3
SPECIFICATIONS ...............................................................................................................3-1
3.1
Input Line IN............................................................................................................3-3
3.2
Input AUX ................................................................................................................3-5
3.3
Input EXT.REF ........................................................................................................3-5
3.4
Output REF OUT .....................................................................................................3-6
3.5
Outputs OUT 1, OUT 2............................................................................................3-6
3.6
Phase Measurement Unit .......................................................................................3-7
3.7
Internal Reference Oscillator.................................................................................3-7
3.8
Mechanical..............................................................................................................3-8
3.9
Environmental.........................................................................................................3-8
3.10
Power Supply..........................................................................................................3-8
3.11
Connector Pin-Out................................................................................................3-10
INSTALLATION & TURN-ON PROCEDURE.......................................................................4-1
4.1
Required Hardware Configuration.........................................................................4-3
4.2
Software Installation...............................................................................................4-3
4.3
Selection of the Printer Type .................................................................................4-3
4.4
Connections............................................................................................................4-4
4.5
Turn-On Procedure ................................................................................................4-6
4.6
Starting up the WinSTS Program ..........................................................................4-6
MODULES DESCRIPTION..................................................................................................5-1
OSA 5565 User Manual Revision A
April 2010
v
6
5.1
Contents
IIU-10/M Input Interface Module .............................................................................5-3
5.2
IIU-6/M Input Interface Module ...............................................................................5-4
5.3
IIU-2/M Input Interface Module ...............................................................................5-5
5.4
TEX-P Passive Timing Extraction Module ............................................................5-5
5.5
Frequency Converter Module ................................................................................5-6
5.6
Frequency Amplifier Module..................................................................................5-7
5.7
Phase Measurement Module..................................................................................5-8
5.8
Rubidium Interface Module....................................................................................5-9
5.9
Alarm Module ........................................................................................................5-10
ADJUSTMENTS ..................................................................................................................6-1
6.1
7
8
9
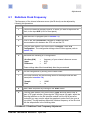
Rubidium Clock Frequency ...................................................................................6-3
OPERATION .......................................................................................................................7-1
7.1
Overview .................................................................................................................7-3
7.2
User Interface .........................................................................................................7-3
7.3
Main Window...........................................................................................................7-4
7.4
Setting-Up ...............................................................................................................7-7
7.5
Diagnostics Functions .........................................................................................7-14
7.6
Data Acquisition - Measuring with WinSTS ........................................................7-15
7.7
Measurement Information ....................................................................................7-16
7.8
The File System ....................................................................................................7-18
7.9
The Graph Windows.............................................................................................7-20
7.10
Templates (masks) ...............................................................................................7-28
7.11
Statistical Functions.............................................................................................7-29
7.12
Filter Function.......................................................................................................7-32
7.13
Linear Regression ................................................................................................7-34
STS COMMS COMMAND SET............................................................................................8-1
8.1
Commande List.......................................................................................................8-3
8.2
The Diagnostics menu ...........................................................................................8-4
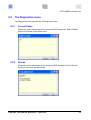
PREVENTIVE MAINTENANCE & TROUBLESHOOTING ...................................................9-1
9.1
Preventive Maintenance.........................................................................................9-3
9.2
Troubleshooting .....................................................................................................9-3
OSA 5565 User Manual Revision A
April 2010
vi
9.3
10
11
12
Contents
Oscilloquartz Contact Information ........................................................................9-4
DIAGRAMS & DRAWINGS................................................................................................10-1
10.1
Introduction ..........................................................................................................10-3
10.2
Block Diagram ......................................................................................................10-3
10.3
Front Panel ...........................................................................................................10-4
10.4
Rear Panel.............................................................................................................10-5
PRE-DEFINED TEMPLATES ............................................................................................11-1
11.1
Introduction ..........................................................................................................11-3
11.2
SSU Type Applications.........................................................................................11-3
11.3
Standard Specifications per Equipment Type....................................................11-4
11.4
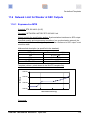
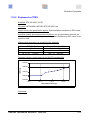
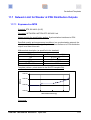
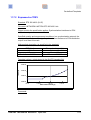
Network Limit for Wander at PRC Outputs .........................................................11-5
11.5
Network Limit for Wander at SSU Outputs .........................................................11-7
11.6
Network Limit for Wander at SEC Outputs .........................................................11-9
11.7
Network Limit for Wander at PDH Distribution Outputs...................................11-11
11.8
Wander Generation for PRC ..............................................................................11-13
11.9
Wander Generation for SSU ..............................................................................11-15
11.10
Noise Transfer for SSU ....................................................................................11-23
11.11
Short-term Phase Transient Response for SSU.............................................11-26
11.12
Phase Discontinuity for SSU ...........................................................................11-30
11.13
Wander Generation for SEC ............................................................................11-34
11.14
Noise Transfer for SEC ....................................................................................11-39
11.15
Short-term Phase Transient Response for SEC.............................................11-40
11.16
Long-term Phase Transient Response (holdover) for SEC ...........................11-41
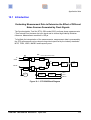
APPLICATION NOTE ........................................................................................................12-1
12.1
Introduction ..........................................................................................................12-3
12.2
Formulas ...............................................................................................................12-4
12.3
Equipment Noise Measurement...........................................................................12-5
12.4
Measurement Data Interpretation........................................................................12-6
12.5
Measurement Samples.........................................................................................12-8
DOCUMENT HISTORY..................................................................................................................... I
OSA 5565 User Manual Revision A
April 2010
vii
List of Figures
List of Figures
Page
Figure 3-1: Line Voltage Connector.............................................................................................3-9
Figure 5-1 Front Panel.................................................................................................................5-3
Figure 5-3: IIU-2/M - Front Panel .................................................................................................5-5
Figure 5-4: Frequency Changer - Front Panel .............................................................................5-6
Figure 5-5: Frequency Amplifier - Front Panel.............................................................................5-7
Figure 5-6: Phase Measurement - Front Panel............................................................................5-8
Figure 5-7: Rubidium Interface - Front Panel...............................................................................5-9
Figure 5-8: Rubidium Interface - Front Panel.............................................................................5-10
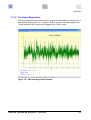
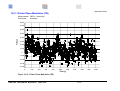
Figure 7-1 : WinSTS Graph Window Example ..........................................................................7-20
Figure 7-1 : Axes Properties - Dialog Box..................................................................................7-23
Figure 7-2 : Zoom IN on Graphs ................................................................................................7-26
Figure 7-3 : Zoom OUT on Graphs ...........................................................................................7-27
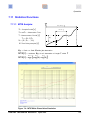
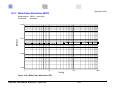
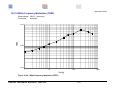
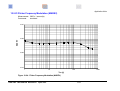
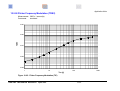
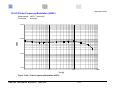
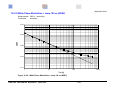
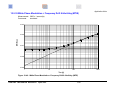
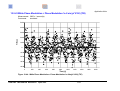
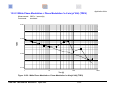
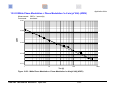
Figure 7-4 : MTIE White Phase Noise Simulation......................................................................7-29
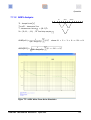
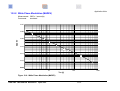
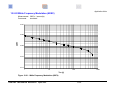
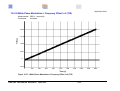
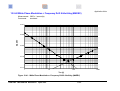
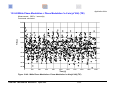
Figure 7-5 : ADEV White Phase Noise Simulation ....................................................................7-30
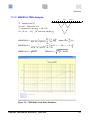
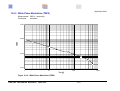
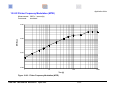
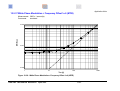
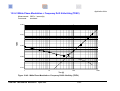
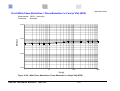
Figure 7-6 : TDEV White Phase Noise Simulation.....................................................................7-31
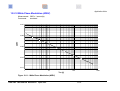
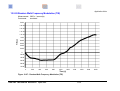
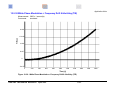
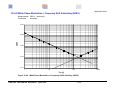
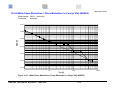
Figure 7-7 : Ym Data Averaging Simulation...............................................................................7-32
Figure 7-8 : TIE Linear Regression Example .............................................................................7-34
Figure 7-9 : YM Linear Regression Example .............................................................................7-36
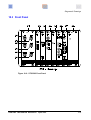
Figure 10-1 : STS 5565 Block Diagram .....................................................................................10-3
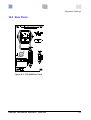
Figure 10-2 : STS 5565 Front Panel..........................................................................................10-4
Figure 10-3 : STS 5565 Rear Panel ..........................................................................................10-5
Figure 12-1 : STS 5565 Block Diagram .....................................................................................12-3
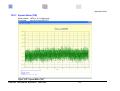
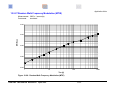
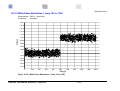
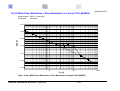
Figure 12-2 : System Noise (TIE) ..............................................................................................12-9
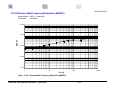
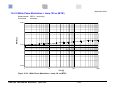
Figure 12-3 : System Noise (MTIE)..........................................................................................12-10
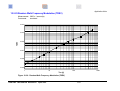
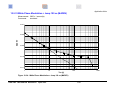
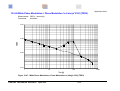
Figure 12-4 : System Noise (MADEV) Sample ........................................................................12-11
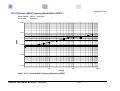
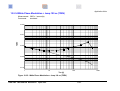
Figure 12-5 : System Noise (TDEV) ........................................................................................12-12
Figure 12-6 : System Noise (ADEV) ........................................................................................12-13
Figure 12-7 : White Phase Modulation (TIE)............................................................................12-14
Figure 12-8 : White Phase Modulation (TIE)............................................................................12-15
Figure 12-9 : White Phase Modulation (MADEV) ....................................................................12-16
Figure 12-10 : White Phase Modulation (TDEV)......................................................................12-17
Figure 12-11 : White Phase Modulation (ADEV) .....................................................................12-18
Figure 12-12 : Flicker Phase Modulation (TIE) ........................................................................12-19
Figure 12-13 : Flicker Phase Modulation (MTIE)......................................................................12-20
Figure 12-14 : Flicker Phase Modulation (MADEV) .................................................................12-21
Figure 12-15 : Flicker Phase Modulation (TDEV) ....................................................................12-22
Figure 12-16 : Flicker Phase Modulation (ADEV) ....................................................................12-23
Figure 12-17 : White Frequency Modulation (TIE)...................................................................12-24
Figure 12-18 : White Frequency Modulation (MTIE) ................................................................12-25
Figure 12-19 : White Frequency Modulation (MADEV)............................................................12-26
Figure 12-20 : White Frequency Modulation (TDEV)...............................................................12-27
Figure 12-21 : White Frequency Modulation (ADEV)...............................................................12-28
Figure 12-22 : Flicker Frequency Modulation (TIE)..................................................................12-29
Figure 12-23 : Flicker Frequency Modulation (MTIE) ...............................................................12-30
OSA 5565 User Manual Revision A
April 2010
viii
List of Figures
Figure 12-24 : Flicker Frequency Modulation (MADEV)...........................................................12-31
Figure 12-25 : Flicker Frequency Modulation (TIE)..................................................................12-32
Figure 12-26 : Flicker Frequency Modulation (ADEV)..............................................................12-33
Figure 12-27 : Random Walk Frequency Modulation (TIE)......................................................12-34
Figure 12-28 : Random Walk Frequency Modulation (MTIE)...................................................12-35
Figure 12-29 : Random Walk Frequency Modulation (MADEV)...............................................12-36
Figure 12-30 : Random Walk Frequency Modulation (TDEV)..................................................12-37
Figure 12-31 : Random Walk Frequency Modulation (ADEV) .................................................12-38
Figure 12-32 : White Phase Modulation + Jump 100 ns (TIE) .................................................12-39
Figure 12-33 : White Phase Modulation + Jump 100 ns (MTIE) ..............................................12-40
Figure 12-34 : White Phase Modulation + Jump 100 ns (MADEV) ..........................................12-41
Figure 12-35 : White Phase Modulation + Jump 100 ns (TDEV) .............................................12-42
Figure 12-36 : White Phase Modulation + Jump 100 ns (ADEV).............................................12-43
Figure 12-37 : White Phase Modulation + Frequency Offset 1e-9 (TIE)..................................12-44
Figure 12-38 : White Phase Modulation + Frequency Offset 1e-9 (MTIE) ...............................12-45
Figure 12-39 : White Phase Modulation + Frequency Drift 8.64e-8/day (TIE) .........................12-46
Figure 12-40 : White Phase Modulation + Frequency Drift 8.64e-8/day (MTIE) ......................12-47
Figure 12-41 : White Phase Modulation + Frequency Drift 8.64e-8/day (MADEV) ..................12-48
Figure 12-42 : White Phase Modulation + Frequency Drift 8.64e-8/day (TDEV) .....................12-49
Figure 12-43 : White Phase Modulation + Frequency Drift 8.64e-8/day (ADEV) .....................12-50
Figure 12-44 : White Phase Modulation + Phase Modulation 1e-8sin(pi*t/100) (TIE)..............12-51
Figure 12-45 : White Phase Modulation + Phase Modulation 1e-8sin(pi*t/100) (MTIE) ...........12-52
Figure 12-46 : White Phase Modulation + Phase Modulation 1e-8sin(pi*t/100) (MADEV).......12-53
Figure 12-47 : White Phase Modulation + Phase Modulation 1e-8sin(pi*t/100) (TDEV)..........12-54
Figure 12-48 : White Phase Modulation + Phase Modulation 1e-8sin(pi*t/100) (ADEV)..........12-55
Figure 12-49 : White Phase Modulation + Phase Modulation 1e-8sin(pi*t/64) (TIE)................12-56
Figure 12-50 : White Phase Modulation + Phase Modulation 1e-8sin(pi*t/64) (MTIE) .............12-57
Figure 12-51 : White Phase Modulation + Phase Modulation 1e-8sin(pi*t/64) (MADEV).........12-58
Figure 12-52 : White Phase Modulation + Phase Modulation 1e-8sin(pi*t/64) (TDEV)............12-59
Figure 12-53 : White Phase Modulation + Phase Modulation 1e-8sin(pi*t/64) (ADEV)............12-60
OSA 5565 User Manual Revision A
April 2010
ix
List of Tables
List of Tables
Page
Table 3-1 Alarm Connectors......................................................................................................3-10
Table 3-2 RS232 for WinSTS Pinout.........................................................................................3-11
Table 3-3 NULL MODEM cable .................................................................................................3-11
Table 6-1 Rubidium Adjustment - Fractional Frequency Steps....................................................6-4
Table 11-1 SSU Type Applications............................................................................................11-3
Table 11-2 Standard Specifications per Equipment Type..........................................................11-4
Table 12-1 Perturbation Effects on MTIE ..................................................................................12-6
Table 12-2 Perturbation Effects on TDEV .................................................................................12-7
Table 12-3 Perturbation Effects on ADEV .................................................................................12-7
Table 12-4 Perturbation Effects on MADEV ..............................................................................12-7
Table 12-5 Ordering Cards ......................................................................................................... A-1
Table 12-6 Ordering Accessories & Options............................................................................... A-1
OSA 5565 User Manual Revision A
April 2010
x
List of Procedures
List of Procedures
Page
Procedure 4-1 Software Installation.............................................................................................4-3
Procedure 4-2 General Connections ...........................................................................................4-4
Procedure 4-3 Turn-On................................................................................................................4-6
Procedure 6-1 Rubidium Clock Frequency Adjustment ...............................................................6-3
Procedure 7-1 RS232 Serial Link Set-up.....................................................................................7-7
Procedure 7-2 Signals Configuration...........................................................................................7-8
Procedure 7-3 Saving Current Configuration.............................................................................7-10
Procedure 7-4 Loading Predefined Configuration .....................................................................7-11
Procedure 7-5 Squeduling an aquisition....................................................................................7-13
OSA 5565 User Manual Revision A
April 2010
xi
List of Procedures
This page has been intentionally left blank
OSA 5565 User Manual Revision A
April 2010
xii
Introduction
Chapter
1
Introduction
Including :
About this Manual
Reading Guide
Safety
Warranty
Certification
OSA 5565 User Manual Revision A
April 2010
1-1
Introduction
This page has been intentionally left blank
OSA 5565 User Manual Revision A
April 2010
1-2
Introduction
1.1
About this Manual
This manual has been designed to provide basic and detailed information for the correct
use and operation of the OSA 5565. It summarizes the overall equipment concept and
theory of operation, describes the hardware itself and provides information related to
installation, operation and maintenance.
It is intended for the use of the following types of users:
1.1.1
Systems Engineers:
An overview of the equipment concept and theory of
operation.
Installation Engineers:
Detailed technical information and procedures for
correct installation, operation, configuration and
commissioning as well as equipment specifications
and maintenance guidelines.
Maintenance Engineers:
Information on troubleshooting, maintenance and
equipment technical data.
Copyright Notice
Copyright © 2010 Oscilloquartz SA
All Rights Reserved
The Oscilloquartz product described in this book is furnished under a license
agreement and may be used only in accordance with the terms of the agreement.
The contents and information in this document are provided in connection with
Oscilloquartz products. No license, expressed or implied by estoppels or otherwise,
to any intellectual property rights is granted by this document. Except as provided in
Oscilloquartz SA’s Terms and Conditions of Sale for such products.
This document is exclusive property of Oscilloquartz SA and may not, in whole or in
part, be copied, photocopied, reproduced, modified, translated, reduced to any
electronic medium or machine-readable, stored in a retrieval system, or transmitted
in any form without prior consent in writing from Oscilloquartz SA, Brévards 16, 2002
Neuchâtel 2, Switzerland.
Every effort has been made to ensure the accuracy of this guide. However,
Oscilloquartz SA makes no warranties with respect to this documentation and
disclaims any implied warranties of merchantability and fitness for a particular
purpose. Oscilloquartz SA shall not be liable for any errors or for incidental or
consequential damages in connection with the furnishing, performance, or use of
this manual or the examples herein.
Oscilloquartz SA may make changes to specifications and product descriptions at
any time, without notice.
1-3
OSA 5565 User Manual Revision A April 2010
Introduction
1.2
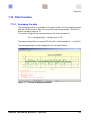
Reading Guide
Special icons, attracting your attention, precede important and/or critical information in
this document. Hereafter are explanations of each icon.
CAUTION
This symbol is extremely important and must not be neglected. It precedes
information or procedures regarding installation, operation or maintenance.
Follow all steps or procedures, as instructed, to avoid any damage to
equipment or serious personal injury.
ELECTRICAL SHOCK HARZARD
This warning symbol is extremely important and must not be neglected. It
indicates that there are dangerous high voltages present inside the
enclosure of this product and precedes important warnings to avoid any risk
of fire or electrical shock that could lead to serious personal injury or loss of
life.
ESD CAUTION
Electrostatic Discharge (ESD) must be avoided so as not to damage or
destroy static sensitive components.
Note:
A note symbol informs the reader that additional information on the related
subject is provided in order to simplify a described task, suggest other
references or even just simplify an explanation.
Recommendation:
Recommendations advise the user on manufacturer tested methods and
procedures proven valuable for correct use and optimum equipment results.
OSA 5565 User Manual Revision A
April 2010
1-4
Introduction
1.3
Safety Instructions
IMPORTANT SAFETY INSTRUCTIONS.
DO NOT DISCARD, READ BEFORE OPERATING
GENERAL
Exercise extreme care when handling any electronics equipment as it
contains precision parts that can be damaged by improper handling.
Avoid touching connector pin surfaces. Foreign matter deposited on contact
surfaces can cause corrosion, and eventually lead to degradation of
performance. In addition, do not use abrasives to clean contact/pin
surfaces.
ESD CONSIDERATION
Each module contains semiconductor devices that can be damaged by
electrostatic discharges. It is advisable to take anti-static precautions when
handling electronic boards or static sensitive components. Use an approved
anti-static bracelet in accordance with company practice.
WATER AND MOISTURE
Do not place containers with liquids such as coffee, water, sodas, etc. on
this unit. Do not operate this equipment in a wet environment.
HEATING
Do not install this product near heat sources such as radiators, air ducts,
areas subject to direct, intense sunlight, or other products that produce
heat.
OSA 5565 User Manual Revision A
April 2010
1-5
Introduction
VENTILATION
Slots and openings in the chassis are provided for ventilation and to ensure
reliable operation of the product. To protect the unit from overheating, those
openings must not be blocked or covered. When integrating this unit in a
rack cabinet, at least one inch (2.5 cm) of clearance above and below the
unit is necessary to assure sufficient cooling.
GROUNDING
EARTH CONNECTION IS ESSENTIAL BEFORE CONNECTING TO THE
SUPPLY.
The OSA 5565 must be connected to Earth Ground (common bounding
network (DC-C)). The wire used for the connection must be a minimum of
AWG16.
Ensure that all other devices connected to the 5565, are connected to
protective (earth ground). (Grounding one conductor of a two-conductor
outlet is not sufficient.)
Any interruption of the protective (grounding) conductor (inside the
equipment) or disconnecting the protective earth terminal is likely to make
this equipment dangerous. Intentional interruption is prohibited.
POWER
Make sure the power sources are compatible with the power inputs of the
equipment. Verify that the correct fuses are installed. The equipment's
protective earth terminals must be connected to the protective conductor of
the (mains) power cord or the station earth. The mains plug shall only be
inserted in a socket outlet provided with a protective earth contact. The
protective action must not be negated by the use of an extension cord
(power cable) without a protective conductor (grounding).
Make sure that only fuses with the required rated current and of the
specified type (normal blow, time delay, etc.) are used for replacement. The
use of repaired fuses and the short-circuiting of fuse holders must be
avoided.
Whenever it is likely that the protection offered by fuses has been impaired,
the equipment must be made inoperative and be secured against any
unintended operation
OSA 5565 User Manual Revision A
April 2010
1-6
Introduction
POWER CORD PROTECTION
The power supply cord for this product should be routed or installed in such
a manner to protect it from being walked on or pinched. The unit should be
powered down completely before connecting or disconnecting the power
cable. The power cord should be removed before moving the unit. The
power cord must be placed near an easily accessible unobstructed socket
outlet.
CLEANING
Connected and running equipment can only be dusted using a soft dry
cloth.
ONLY WITH, AUTHORIZED PERMISSION, OUT OF SERVICE &
UNPLUGGED equipment can be cleaned with a soft cloth slightly
moistened with a mild detergent solution. Do not use liquid cleaners,
aerosols, abrasive pads, scouring powders or solvents, such as benzine or
alcohol. Ensure the surface cleaned is fully dry before reconnecting power.
SERVICING AND MODIFICATIONS
To avoid dangerous electric shock, do not perform any servicing or
modifications other than what is recommended in this User Manual. Do not
attempt to gain access to areas of the unit where dangerous voltages are
present. Refer servicing to qualified service personnel.
DAMAGE REQUIRING SERVICE
•
Refer servicing to qualified service personnel under the following
conditions:
• When the power supply cord is damaged.
• If liquid has been spilled into the enclosure of the unit.
• If the product does not function normally by following the instructions
in the User’s Manual. Adjust only those controls that are covered by
the operating instructions. Improper adjustment of other controls may
result in damage and will often require rework by a qualified
technician to restore the product to its normal operation.
• If the product has been damaged in any way.
When the unit displays a negative, distinct change in performance.
OSA 5565 User Manual Revision A
April 2010
1-7
Introduction
1.4
Warranty
This Oscilloquartz product carries a warranty which commences from date of dispatch
from factory. Unless agreed otherwise or stipulated differently on the original
acknowledgement of order, the duration of the warranty is twenty four months.
It applies to demonstrably faulty material or poor workmanship, but excludes batteries.
Oscilloquartz shall bear only the cost of repair or replacement in its own premises.
Should this not be possible for reasons beyond our control, all additional costs are at
customer expense.
Repairs under warranty carry either the balance of the original warranty or a six months
warranty, whichever is longer.
Damages resulting from natural wear, improper maintenance, failure to observe the
operating instructions, excessive strain, unsuited consumption material as well as
improper environmental and mounting conditions are excluded from this warranty.
The warranty expires if the customer or a third party modifies or repairs the product
without Oscilloquartz's prior written consent or if the customer does not take immediate
steps to prevent the damage from becoming more serious; likewise, if insufficient time is
provided for repair or replacement.
The customer will not be entitled to other warranty claims. Oscilloquartz is not liable for
consequential damage.
OSA 5565 User Manual Revision A
April 2010
1-8
Introduction
1.5
Certification
EQUIPMENT CERTIFICATION:
Oscilloquartz equipment is tested according to well-defined procedures. Appropriate
testing and inspection takes place at the component, board, equipment and system
levels. The company maintains in-house cesium standards that are continuously
compared to UTC. Before any equipment is released, it must satisfy the relevant tests
and inspection schedules. The equipment is then issued with a "Certificate of
Conformity" that guarantees its conformance with the relevant performance criteria.
The OSA 5565 STS is designed to be compliant to:
•
SAFETY : EN61010-1: 1993 / A2: 1995
•
EMC :
EN50081-1, EN50082-1
A variety of Oscilloquartz products are certified world-wide. For details, please refer to
our web site at www.oscilloquartz.com
COMPANY CERTIFICATION:
•
Certified since 1987 by the Swiss Accreditation Service and Swiss Federal Office
of Metrology as an accredited laboratory for time and frequency.
•
Certified ISO 9001 since 1994 and ISO 14001 since 2000 by The Swiss
Association for Quality and Management Systems (SQS)
OSA 5565 User Manual Revision A
April 2010
1-9
Introduction
This page has been intentionally left blank
OSA 5565 User Manual Revision A
April 2010
1-10
General Description
Chapter
2
General Description
Including :
Overview
OSA 5565 User Manual Revision A
April 2010
2-1
General Description
This page has been intentionally left blank
OSA 5565 User Manual Revision A
April 2010
2-2
General Description
2.1
Overview
The STS (Synchronisation Test Set) is a portable instrument combining a Rubidium clock
and a phase-time measurement instrument in one piece of equipment. It is intended for
the measurement of the quality of synchronisation signals in telecommunication
networks. The STS runs in conjunction with an IBM compatible PC. A program called
WinSTS performs the control of the STS instrument and produces the mathematical
calculations. The main functions of the set are:
• Provision of a high stability reference signal generated by its internal Rubidium clock.
• Measurement of the Time Interval Error (TIE) of a synchronisation signal.
• Calculation of the following signal parameters, derived from the TIE raw data:
- MTIE
- ADEV
- MADEV
- TDEV
- Δf/fo
The STS can accept a wide variety of input signals in the frequency range of 64 kHz to
16’384 kHz by step of 8 kHz. A field exchangeable input interface card allows the STS to
be connected to different types of input signals (sine, square, code).
The reference signal from the Rb clock is available on BNC connectors as a standard 10
MHz signal, and as an additional output signal whose frequency can be configured by
way of to two field exchangeable cards (a frequency converter card and an amplifier or
code generator card).
The STS can also be connected to an external reference signal, which then replaces the
internal Rb clock reference.
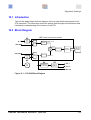
Note:
The terms used in this document refer to the figures in chapter 10 showing
the front panel, the rear panel and the block diagram of the system.
OSA 5565 User Manual Revision A
April 2010
2-3
General Description
This page has been intentionally left blank
OSA 5565 User Manual Revision A
April 2010
2-4
Specifications
Chapter
3
Specifications
Including :
Input Line IN
Input AUX
Input EXT.REF
Output REF OUT
Outputs OUT 1, OUT 2
Phase Measurement Unit
Internal Reference Oscillator
Mechanical
Environmental
Power Supply
Connector Pin-Out
OSA 5565 User Manual Revision A
April 2010
3-1
Specifications
This page has been intentionally left blank
OSA 5565 User Manual Revision A
April 2010
3-2
Specifications
3.1
Input Line IN
Different types of input receivers are available:
3.1.1
IIU-6/M
ITU G.703-6/75Ω
(also through TEX-P, 18dB att.)
(preset: HDB3/CAS)
IIU-2/M ESF
ITU G.703-2/75Ω
(preset: B8ZS/ESF)
IIU-2/M D4(SF)
ITU G.703-2/75Ω
(preset: AMI/D4)
IIU-10/M (three frequency bands)
ITU G.703-10/75Ω
Connector
BNC (A1X1 on front panel)
IIU-6/M (2.048 Mbit/s)
Direct connection to an IIU-6/M is only possible if the line is properly terminated.
Input signal
HDB3/CAS
(Factory pre-configuration)
Input level
According to G-703/6 (2.37Vp/75Ω)
min. V nominal-10dB, max. 2.8 Vp
OR
According to G-703/6 -18dB (0.3Vp/75Ω)
min. V nominal-28dB, max. 0.5Vp)
Input impedance
75 Ω (coax.)
Mismatching loss
< -20 dB, 0.1 MHz < f < 2 MHz
< -15 dB, 2 MHz < f < 3 MHz
Added noise level (1Hz<f<0.1MHz)
< 60 mVpp, sinusoïdal
OSA 5565 User Manual Revision A
April 2010
3-3
Specifications
3.1.1.1 TEX-P
Using a TEX-P enables operation on a 2.048 Mbit/s link without interrupting it. The
TEX-P allows the extraction of part of the signal without interrupting the data flow.
The extracted signal is then input to a n module.
3.1.2
Input signal
according to ITU G.703/6
'Input - output' attenuation
< 0.5 dB, 0.1 MHz < f < 3 MHz
'Input - active output' attenuation
18 dB +/- 1dB, 0.1 MHz < f < 3 MHz
Input impedance
75 Ω (coax.)
Output impedance
75 Ω (coax.)
Impedance of active output
75 Ω coax.
Mismatching loss (50 Ω)
< -20 dB, 0.1 MHz < f < 3 MHZ
Connector
BNC 75 Ω
IIU-2/M ESF and IIU-2/M D4 (1.544 Mbit/s)
Input signal
B8Z2/ESF or AMI/D4
(Factory pre-configuration)
Supply voltage
24 V ±10%
Input signal
Signal shape:
Nominal amplitude:
Minimum amplitude:
Impedance:
Number of inputs:
According to G703/2
3V peak
Unom -35dB (For use with TEX-P)
75 Ohms
1
Reference signal
Signal shape:
Nominal amplitude:
Minimum amplitude
Sinus or square wave
0.5 Vrms
50 mVrms
Alarm signal
Number of signals:
Type:
Vc max:
Ic max:
1
Opto-coupler
50V (off state)
5mA (on state)
Temperature range
Operation:
0 ÷ 60 °C
OSA 5565 User Manual Revision A
April 2010
3-4
Specifications
3.1.3
IIU-10/M
Use an IIU-10/M input interface if the incoming synchronisation signal is already a
clock signal.
3.2
3.3
Signal type
sine wave or square wave
Level
sine :
square:
Input Impedance
75 Ω (coax)
Input frequency (three models)
64 kHz to 2 MHz or
2 MHz to 32 MHz or
15 MHz to 50 MHz (with fout = fin / 4)
Added noise level
< 50 mVpp
0.3 Vrms to 1.5 Vrms
1 Vpp to 5 Vpp ( 40% < δ < 60%)
Input AUX
Signal type
sine wave or square wave
Level
sine :
square:
Input Impedance
50 Ω (coax)
Frequency
64 kHz to 16384 kHz by step of 8 kHz
Connector (A1X2 on front panel)
BNC 50 Ω
0.3 Vrms to 1.5 Vrms
1 Vpp to 5 Vpp ( 40% < δ < 60%)
Input EXT.REF
Signal type
sine wave or square wave
Level
sine :
square:
Input Impedance
50 Ω (coax)
Frequency
10 MHz
Connector (A1X3 on front panel)
BNC 50 Ω
OSA 5565 User Manual Revision A
April 2010
0.1 Vrms to 1.5 Vrms
1 Vpp to 5 Vpp ( 40% < δ < 60%)
3-5
Specifications
3.4
3.5
Output REF OUT
Signal type
square wave
Level
2.2 VPP
Input Impedance
50 Ω (coax)
Frequency
10 MHz from active reference
Connector (A1X6 on front panel)
BNC 50 Ω
Outputs OUT 1, OUT 2
Two identical outputs from:
Output Amplifier:
Signal type
sine
Level
7 dBm
Input Impedance
75 Ω (coax)
Frequency
one value from the following list:
- 1.544 MHz
- 2.048 MHz
- 4.096 MHz
- 10 MHz
- 44.736 MHz
- 139.264 MHz
or Code Generator
: HDB3
Connectors (A1X4, A1X5 on front panel
OSA 5565 User Manual Revision A
April 2010
BNC 75 Ω
3-6
Specifications
3.6
3.7
Phase Measurement Unit
Sampling period τ0
12.5 ms
Max. measurement period T
limited by RAM installed on PC
Resolution
100 ps
Max. measurement range
± 100 μs (with recycling )
Internal Reference Oscillator
5565-02
Type: Rubidium
MCFRS-01
Frequency
10 MHz
Temperature Stability
2E-10 for Θ =
0 to 60 °C
ADEV(1s) = 3E-11
ADEV(10s) = 1E-11
ADEV(100s) = 3E-1
4E-11 (after 2 months of continuous operation
Phase stability
Drift per month
Retrace
Adjustment rang
Adjustment resolution
2E-11 >1 h
24 h interruption
min 4E-9
min 1E-12/unit
(LSB)
Recommendation:
The calibration is done in a position and when the position's device
changes, the magnetic earth field modifies the precision of the Rb clock by
-10
< 1 · E /gauss.
OSA 5565 User Manual Revision A
April 2010
3-7
Specifications
3.8
3.9
Mechanical
Size (h x w x d)
145 x 275 x 400 mm
Weight
7.5 kg
Environmental
Operating temperature range
0° to +45°C
Storage temperature
-20°C to 50°C
Humidity
Up to 95% non condensing
3.10 Power Supply
3.10.1 Line voltage
Model AC
Fuses F1, F2
Power
OSA 5565 User Manual Revision A
with AC/DC Converter
230VAC ±10% or 115VAC ±10%/50-60 Hz
with AC/DC Converters:
T 3,15A L 250V, 5 x 20 mm
< 50 W typical during warm-up
< 40 W typical during normal operation
(depending on configuration)
April 2010
3-8
Specifications
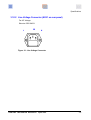
3.10.2 Line Voltage Connector (A9X1 on rear panel)
For AC Voltage:
Schurter 5220.0423.1
L
PE
N
Figure 3-1: Line Voltage Connector
OSA 5565 User Manual Revision A
April 2010
3-9
Specifications
3.11 Connector Pin-Out
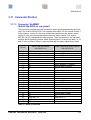
3.11.1 Connector 'ALARMS'
(Sub-D 25p A9X3 on rear panel)
This connector provides electrical contacts for alarm signals generated by the alarm
card. The version 942.085.516.01 is equipped with relays. For this version contact 1
is the common, contact 2 is the relay contact that closes when the alarm is active,
contact 3 is the relay contact that opens when the alarm is active. The version
942.085.516.02 is equipped with opto-couplers. There are alarms for the individual
modules and summarizing alarms called 'General alarms'. In the pin-out table, 'A', 'B'
and 'C' refer to different relays or opto-couplers with the same logical alarm signal.
Pin Nr.
1
2
3
4
5
6
7
8
9
10
11
12
13
14
15
16
17
18
19
20
21
22
23
24
25
Alarm Card with Relays
942.085.516.01
NC
General alarm A, contact 1
General alarm B, contact 2
General alarm B, contact 3
General alarm C, contact 1
NC
NC
NC
NC
Lamp test, signal
NC
NC
NC
General alarm A, contact 1
General alarm A, contact 2
General alarm B, contact 1
General alarm C, contact 2
General alarm C, contact 3
NC
NC
NC
NC
Lamp test, 0 V
NC
NC
Alarm Cards with Opto-Couplers
942.085.516.02
Power supply A, collector
Power supply B, collector
Input interface, collector
Output interface 1, collector
Rubidium interface, collector
Phase measurement, collector
Output interface 2, collector
General alarm, collector
NC
Lamp test, signal
NC
NC
NC
Power supply A, emitter
Power supply B, emitter
Input interface, emitter
Output interface 1, emitter
Rubidium interface, emitter
Phase measurement, emitter
Output interface 2, emitter
General alarm, emitter
NC
Lamp test, 0 V
NC
NC
Table 3-1 Alarm Connectors
OSA 5565 User Manual Revision A
April 2010
3-10
Specifications
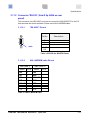
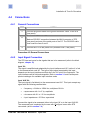
3.11.2 Connector 'RS-232' ( Sub-D 9p A9X4 on rear
panel)
This connector is the RS-232C port used to connect the OSA 5565 STS to the PC
that executes the control software. Please use a NULL MODEM cable.
3.11.2.1
"RS-232C" Pin-out
Pin No.
Description
1
6
9
2
3
5
5
male
Rx
Tx
Ground
1,4,6,7, no connection
8,9
Table 3-2 RS232 for WinSTS Pinout
3.11.2.2
NULL MODEM cable Pin-out
DB9 (side 1)
Name
Pin N°
DB9 (side 2)
Name
Pin N°
RxD
2
TxD
3
TxD
3
RxD
2
DTR
4
DSR+CD 6+1
GND
5
GND
5
DSR+CD 6+1
DTR
4
RTS
7
CTS
8
CTS
8
RTS
7
Table 3-3 NULL MODEM cable
OSA 5565 User Manual Revision A
April 2010
3-11
Specifications
This page has been intentionally left blank
OSA 5565 User Manual Revision A
April 2010
3-12
Installation & Turn-On Procedure
Chapter
4
Installation & Turn-On Procedure
Including :
Required Hardware Configuration
Software Installation
Selection of the Printer Type
Connections
Turn-On Procedure
Starting up the WinSTS Program
OSA 5565 User Manual Revision A
April 2010
4-1
Installation & Turn-On Procedure
This page has been intentionally left blank
OSA 5565 User Manual Revision A
April 2010
4-2
Installation & Turn-On Procedure
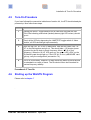
4.1
Required Hardware Configuration
For the installation and commissioning of the OSA 5200B, the following tools are
needed:
:
Operating System : Windows 2000 SP4, Windows 2003 or WindowsXP SP2.
For more information, please refer to the Microsoft Website (http://www.microsoft.com/).
WinSTS needs to have Microsoft .NET Framework 2.0 and Windows Installer.
4.2
Software Installation
From a CD-ROM
To install the program from the CD-ROM drive D: to the hard disk C: of your PC, proceed
as follows:
STE
P
ACTION
1
Insert the CD-ROM into CD-Rom drive D of your PC.
2
Navigate to the software introduction page. "Click on Software Installation"
which will open the .exe file.
3
The program is now being automatically installed
Procedure 4-1 Software Installation
For further information on managing programs, see your Windows operating system
documentation.
4.3
Selection of the Printer Type
If a printer is connected to your PC, set the printer type using the Windows control panel.
WinSTS uses the standard windows printing procedures.
OSA 5565 User Manual Revision A
April 2010
4-3
Installation & Turn-On Procedure
4.4
Connections
4.4.1
General Connections
STEP
1
2
ACTION
Connect the ground cable to the ground connector ‘A9X2’ of the STS
(rear panel)
Connect the STS to the PC:
Make an RS-232C connection between the A9X4 connector of STS
(rear panel) and one of the serial ports of the PC. The RS-232C cable
must invert the lines 2 and 3.
3
Connect the STS to the power line (connector A9X1, rear panel)
Procedure 4-2 General Connections
4.4.2
Input Signal Connection
The STS has two inputs for the signals that are to be measured (refer to the block
diagram, chapter 10)
Input ‘IN’:
The signal is amplified and adapted by the input interface card ‘A2’, before it is fed
to the measurement card ‘A5’. The type of input signal accepted by this input
depends on the input interface card that sits in the ‘A2’ slot of the instrument. The
input interface card is field exchangeable. Refer to section 3.1 and Oscilloquartz
product catalogue for available input interface cards.
Input ‘AUX IN’:
The input signal is fed directly to the measurement card ‘A5’. This input accepts any
signal with the following caracteristics:
•
- frequency = 64 kHz to 16384 khz, multiples of 8 kHz
•
- square wave with 1 to 5 Vpp amplitude
•
- sine wave with 0.1 to 1.5 VRMS amplitude
•
- input impedance = 50 Ohm, asymetrical
Connect the signal to be measured either to the input ‘IN’ or to the input ‘AUX IN’.
The measured input is selected by the user with ‘Configure’ menu when STS
connected. (refer to section 7.4)
OSA 5565 User Manual Revision A
April 2010
4-4
Installation & Turn-On Procedure
4.4.3
External Reference Connection
If you decide to use an external reference source (e.g. a Cs clock) instead of the
built in Rb clock, then connect the 10 MHz signal from your reference source to the
input ‘EXT REF’. The reference used for the measure is selected by the user with
‘Configure’ menu when STS connected. (refer to section 7.4)
The STS features three reference output signals:
•
Output ‘REF OUT’ is a 10 MHz signal derived directly from the reference
(internal or external, depending on which one is used for the measurement).
•
Outputs ‘OUT 1’ and ‘OUT 2’ are two identical signals derived from the
reference signal and transformed by the frequency converter A4 and the
output amplifier or Code Generator A3 (A4 can be replaced by a dummy card
if no frequency conversion is needed).
The above mentioned reference output signals are used when the measured signal
is the response from a system under test that requires an excitation clocking signal
as an input.
OSA 5565 User Manual Revision A
April 2010
4-5
Installation & Turn-On Procedure
4.5
Turn-On Procedure
If you have followed the connection indications of section 4.4, the STS should already be
powered up. Now follow these steps:
STEP
ACTION
1
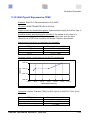
Depress the RESET toggle switches on all cards that are fitted with one.
The LEDs indicating memorised (latched) alarms (right LED column) should
go out.
2
Check all the LEDs by depressing the LAMPTEST toggle switch of ‘Alarm
module’; all LEDs should light up momentarily.
3
Wait until the LED ‘AL’ on the ‘ϕ-MEASURE’ card and the yellow LED ‘’WUP’ on the Rb Interface card go out. This should take < 10 minutes (warmup period for the Rb clock to reach frequency offset < 2E-10 of final
frequency). When the ‘W-UP’ LED goes out, the green LED ‘LOCK’ on the
Rb interface card should light up. If the LED ‘AL’ on the ‘ϕ-MEASURE’ card
light up, verify the configuration (see section 7.4).
4
The STS is now ready. However, for best results the warm-up period should
be extended to a couple of hours. The Rb clock will then have reached its
nominal frequency stability.
Procedure 4-3 Turn-On
4.6
Starting up the WinSTS Program
Please refer to chapter 7
.
OSA 5565 User Manual Revision A
April 2010
4-6
Module Description
Chapter
5
Modules Description
Including :
IIU-10/M Input Interface Module
IIU-6/M Input Interface Module
IIU-2/M Input Interface Module
Frequency Converter Module
Frequency Amplifier Module
Phase Measurement Module
Rubidium Interface Module
Alarm Module
OSA 5565 User Manual Revision A
April 2010
5-1
Module Description
This page has been intentionally left blank
OSA 5565 User Manual Revision A
April 2010
5-2
Module Description
5.1
IIU-10/M Input Interface Module
The IIU-10/M module (A2) ensures isolation between the incoming input signal and the
system. It also performs the monitoring of the signals and the signal conditioning needed
to ensure compatibility with the Phase Measurement module. An alarm signal is instantly
transmitted to the alarm module, if either the signal level is out of specification or the
module shows a failure.
TEXT
COLOR
FUNCTION
OP
Green
When on, indicates that the module is operating.
The incoming reference signal is transmitted to
the output of the module.
REF
Red
When on, indicates that the signal at the input of
the module is not valid.
OOL
Red
When on, indicates a function inhibit caused by
input 1 (not used).
INH
Red
When on, indicates that a digital input inhibits the
IIU module.
Table 5-1 IIU-10/M LED Description
Figure 5-1 Front Panel
OSA 5565 User Manual Revision A
April 2010
5-3
Module Description
5.2
IIU-6/M Input Interface Module
The 'IIU-6/M' input interface module (A2) ensures galvanic isolation between the
incoming reference signal and the system. It extracts the CAS framed clock signal and
detects AIS alarms. With the 'IIU-6/M' module it is also possible to extract other
information from the HDB3 line, such as FA and ER alarms. It can also be used to
generate an alarm signal derived from monitoring the input signal level.
In the case of a malfunction (incoming signal out of specification or failure of the
module), an alarm signal is instantly transmitted to the alarm module.
TEXT
COLOR
FUNCTION
OP
Green
When on, indicates that the module is in the
operational mode and its output signals are valid.
LOS
Red
When on, indicates a LOS condition in the input
signal.
AIS
Red
When on, indicates an AIS condition in the input
code..
LFA
Red
When on, indicates one or more of the following
conditions in the input code. (depending on the
defined alarm mask).
Loss of frame alignment.
Loss of CRC-4 alignment.
Loss of CAS multiframe alignment.
ER
Red
When on, indicates an Error Rate condition in
the input code. Depending on the selected alarm
mask, the limit error rate can be 1E-3 or 1E-4.
SSM / BIT
Red
When on, indicates one of the three following
conditions (depending on the defined alarm
mask):
Figure 5-2:
IIU-6/M - Front
Panel
1)The input signal is rejected, according to the
SSMB algorithm. (Future option).
2)One or more bits Sa4 to Sa8 are in the state
declared in the alarm mask.
3) A remote alarm (Bit 3 at high state) has been
detected.
BIT 4
Yellow
Indicates the state of the additional bit Sa4.
BIT 5
Yellow
Indicates the state of the additional bit Sa5.
BIT 6
Yellow
Indicates the state of the additional bit Sa6.
BIT 7
Yellow
Indicates the state of the additional bit Sa7.
BIT 8
Yellow
Indicates the state of the additional bit Sa8.
Table 5-2 IIU-6/M LED Description
OSA 5565 User Manual Revision A
April 2010
5-4
Module Description
5.3
IIU-2/M Input Interface Module
The 'IIU-2/M' input interface module (A2) extracts the clock from a D4 or ESF framed
signal and provides several levels of information and alarms criteria.
It also has the capability to measure the phase difference between the input signal and
the equipment’s local reference.
In the case of a malfunction (incoming signal out of specification or failure of the
module), an alarm signal is instantly transmitted to the alarm module.
TEXT
COLOR
FUNCTION
OP
Green
LOS
Red
When on, indicates a LOS condition in the input
signal.
AIS
Red
When on, indicates that an AIS (Alarm Indication
Signal) alarm signal was detected on the line.
LFA
Red
When on, indicates the detection of an error in
the synchronisation frame.
ER
Red
When on, indicates the detection of the
synchronisation frame error rate having
exceeded 1*10-3 during the last 5 seconds.
RAI
Red
D4 mode: When on, indicates that bit 2 of
consecutive channels is set to zero for at least
254 occurrences.
ESF mode: When on, indicates that 16
consecutive patterns of 00FF appear in the FDL.
When on, indicates that the module is
operating.The incoming reference signal is
transmitted to the output of the module.
Table 5-3 IIU-2/M LED Description
Figure 5-3: IIU-2/M - Front Panel
5.4
TEX-P Passive Timing Extraction Module
IN / OUT
LINE
OSA 5565 User Manual Revision A
OUT to
TEX-A
April 2010
5-5
Module Description
5.5
Frequency Converter Module
The ‘Frequency Changer’ module (A4) receives its input from the selected reference
source. The output signal is obtained by an ‘on card’ phase-locked VCXO.
TEXT
COLOR
FUNCTION
IN
Red
When on, indicates that the input signal is absent
or out of specification.
OOL
Red
When on, indicates that the ‘on card’ VCXO is
not locked to the input frequency.
OUT
Red
When on, indicates that the output signal is
absent or out of specification.
INH1
Red
When on, indicates an inhibition of the function
caused by input 1(not used).
INH2
Red
When on, indicates an inhibition of the function
caused by input 2(not used).
Table 5-4 Frequency Changer LED Description
Figure 5-4: Frequency Changer - Front Panel
MONITORING
Level
typ. 50 mVrms
(20dB below module output level)
Impedance
50 Ω
Connector
LEMO size 00, type RA 00250
Connector
OSA 5565 User Manual Revision A
: LEMO size 00, type RA 00250)
April 2010
5-6
Module Description
5.6
Frequency Amplifier Module
The ‘Frequency Amplifier’ module (A3) receives its input signal from the ‘Frequency
Changer’ module and amplifies it in order to provide output signals with the correct
voltage level and impedance.
TEXT
COLOR
FUNCTION
1
Red
When on, indicates that output 1 is absent or out
of specification (G.703/10)
2
Red
When on, indicates that output 2 is absent or out
of specification (G.703/10)
Table 5-5 Frequency Amplifier LED Description
Figure 5-5: Frequency Amplifier - Front Panel
The LEDs marked with a ‘D’ correspond to a direct alarm, those marked with a ‘M’
correspond to a memorised (latched) alarm. The RESET switch clears the ‘M’ LEDs.
OSA 5565 User Manual Revision A
April 2010
5-7
Module Description
5.7
Phase Measurement Module
The main functions of the‘Phase Measurement’ module (A5) are:
1 -.
23-
Measurement of the phase variation between the input signal IN or AUX and the
selected reference source INT or EXT.
Communication with the PC via the RS-232C
Monitoring the validity of the measurement
TEXT
COLOR
AL
Red
FUNCTION
When on, indicates that at least one of the
following conditions are presents:
1 - ‘On card’ VCXO output signal absent
2 - ‘On card’ VCXO not locked
3 - Input signal absent
4 - If selected, internal reference source (Rb
clock) not locked
5 - Frequency offset of input signal > 1E-5,
correspond to ΔTIE>125 ns for period of
12.5 ms. No measurement error for
ΔTIE<500 ns for period of 12.5 ms.
Table 5-6 Phase Measurement LED Description
Figure 5-6: Phase Measurement - Front Panel
OSA 5565 User Manual Revision A
April 2010
5-8
Module Description
5.8
Rubidium Interface Module
The main functions of the‘Rubidium Interface’ module (A6) are:
1- Conditionning of the Rb clock signal. (Shaping and Buffering)
2- Monitoring of the operating conditions of the Rb clock
3- Setting of the Rb control voltage.
TEXT
COLOR
FUNCTION
LOCK
Green
When on, indicates that normal conditions are
respected. Monitoring voltage must be:
2.4 V < Umon < 8 V
W-UP
Yellow
When on, indicates that Rubidium reference
source is in its warm-up phase
OUT
Red
When on, indicates that the output signal is
absent
Table 5-7 Rubidium Interface LED Description
The CAL switches are digital potentiometers that are used for the
frequency adjustment of the rubidium reference source.
Figure 5-7: Rubidium Interface - Front Panel
Note:
If "LOCK" LED is switched off (after the warm-up time, ∼20 mn), then the Rb
reference source needs readjustment of its internal VCXO:
1) on STS model 5565-02, please return the STS to the factory.
OSA 5565 User Manual Revision A
April 2010
5-9
Module Description
5.9
Alarm Module
The ‘Alarm’ module (A7) displays and stores the alarm signals of all modules of the
system. It also allows the testing of all LEDs of the system.
TEXT
COLOR
FUNCTION
ALARM
Red
This LED is an image of the general alarm, it is
on when at least one direct alarm is present.
POWER
Red
When on, indicates an alarm from the voltage
converter A7.
IN
Red
When on, indicates an alarm from the input
module A2 (TEX or L.R.)
O-1
Red
When on, indicates an alarm from the output
module A3.
O-2
Red
When on, indicates an alarm from the frequency
changer module A4.
XM
Red
When on, indicates an alarm from the phase
measurement module A5.
Rb
Red
When on, indicates an alarm from the rubidium
interface module A6.
Table 5-8 Alarm Module LED Description
Figure 5-8: Rubidium Interface - Front Panel
The LEDs marked with a ‘D’ correspond to a direct alarm, those marked with an ‘M’
correspond to a memorised (latched) alarm. The RESET switch clears the ‘M’ LEDs.
The RESET switch has three positions:
- Mid position: Neutral position
- Upper position:
Clearing the memorised alarms
- Lower position:
Test of all LEDs on the STS
OSA 5565 User Manual Revision A
April 2010
5-10
Adjustments
Chapter
6
Adjustments
Including :
Rubidium Clock Frequency
OSA 5565 User Manual Revision A
April 2010
6-1
Adjustments
This page has been intentionally left blank
OSA 5565 User Manual Revision A
April 2010
6-2
Adjustments
6.1
Rubidium Clock Frequency
The frequency of the internal reference source (the Rb clock) can be adjusted by
following this procedure:
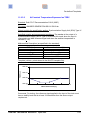
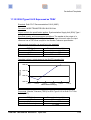
STEP
ACTION
1
Connect the external reference source, to which you want to adjust the Rb
clock, to the input AUX (A1X2 of front panel).
2
Start the WinSTS program (refer to section 7.2).
3
Click on the ‘STS Connected’ checkbox to enable the serial
communications link between the STS unit and the PC.
4
From the main window, click on the menu ‘Configure’, then ‘STS
Configuration’. The configuration dialogue box will then appear (refer to
section 7.4).
5
Now select the following STS configuration:
- Aux freq.(kHz)
- Input
- Reference
=
=
=
frequency of your external reference source.
AUX
INT
These settings take effect immediately after they are entered.
6
Exit the configuration by clicking on the close button.
7
In the main window, set the following values in the sample and rate edit
boxes(refer to section 7.4):
- Sample
- Rate
=
=
10000
1s
8
Start a data acquisition by clicking on the ‘Start’ button.
9
From the main window, click on the menu ‘Data’ and then select ‘TIE’ to
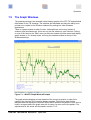
open a TIE graph window. Observing the TIE[s] versus t[s] graph, adjust the
three digi-switches on the Rb Interface module until the curve becomes
horizontal (you may need to adjust the graph axis scales first if the curve is
not visible). The digi-switches adjust the fractional frequency of the Rb clock
with the steps shown in the following table.
Procedure 6-1 Rubidium Clock Frequency Adjustment
OSA 5565 User Manual Revision A
April 2010
6-3
Adjustments
Δy/step
5565-02
2.5E-10
1.6E-11
1E-12
MSB upper digi-switch
mid digi-switch
LSB lower digi-switch
Table 6-1 Rubidium Adjustment - Fractional Frequency Steps
If the TIE vs. t curve shows a negative slope, then turn the digi-switches anticlockwise; if
the TIE vs. t curve shows a positive slope, turn the digi-switches clockwise.
Recommendation:
The uncertainty of the frequency measurement is equal to the short term
stability AVAR(τ) of either the Rb clock or the external reference source. It is
therefore necessary to measure during at least 100 s in order to get an
uncertainty in the order of +3E-12.
OSA 5565 User Manual Revision A
April 2010
6-4
Operation
Chapter
7
Operation
Including :
Overview
User Interface
Main Window
Setting-Up
Diagnostics Functions
Data Acquisition - Measuring with WinSTS
Measurement Information
The File System
The Graph Windows
Templates (masks)
Filter Function
Linear Regression
OSA 5565 User Manual Revision A
April 2010
7-1
Operation
This page has been intentionally left blank
OSA 5565 User Manual Revision A
April 2010
7-2
Operation
7.1
Overview
The STS operates in tandem with a PC running the Microsoft Windows 2000 SP4,
Windows Server 2003 and Windows XP SP2 operating systems. WinSTS is the frontend of the STS measurement system. WinSTS is a 32-bit multithreaded program and
therefore is unable to run under earlier versions of Windows.
For the installation procedure of the WinSTS program, refer to section 4.2.
A typical sequence for the operation of the STS looks like this:
7.2
•
Starting up the WinSTS program.
•
Setting up the STS instrument (refer to section 7.4)
•
Data acquisition (refer to section 7.6)
•
Visualisation of the acquired data (refer to section 7.9)
User Interface
The WinSTS program employs the standard MS Windows’ user interface. The normal
method of navigation is by a mouse. If you do not have a mouse, then the keyboard can
be used in the following way:
•
[TAB] Key: Moves the input focus from one interface element to another.
•
[↑] [↓] Keys: Modify parameters within list boxes and radio button groups.
•
[SPACEBAR] Key: Set checkboxes and depress buttons.
•
[RETURN] Key: Validate a command.
•
[ALT-<c>] Key combination: Select menu items with where <c> is the
underscored character of the menu item;
•
[ALT-TAB] Key combination: Switch between windows.
OSA 5565 User Manual Revision A
April 2010
7-3
Operation
7.3
Main Window
The main window consists of just the controls that are necessary to perform the
synchronisation measurement, whilst leaving all the other functionality to be access from
the menu bar. In this way the measurement activities are separated from the graphing
and set-up functions so that the user is presented with a straightforward and
unambiguous user-interface.
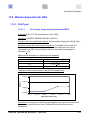
The layout of the main is devided into thre area :
Port Com Set Up area: to open and close communication with STS instrument.
Current Acquisition area: to configure, start and stop the aquisition
Scheduling area: to configure an aquisitionnscheduling.
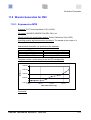
Main menu: to access Data vizualization, configuration, diagnostics and filters functions.
Status bar: to show the port com status and acquisition status.
The layout of the main window is as follows:
Menu Headings:
• File: Open and save data files.
•
Data: View STS data.
•
Filter: Filters TIE data
•
Configuration: Options for Setting-up an STS measurement.
•
Diagnostics: Allows the user to interrogate the STS directly to aid faultfinding etc.
•
Abaout: About dialog box.
OSA 5565 User Manual Revision A
April 2010
7-4
Operation
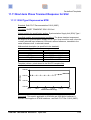
7.3.1
‘File’ Menu Headings:
Open : Select and open a saved data file from the Windows file system.
Save : Save the current contents of the program’s data buffer.
Quit : Exit the program.
Refer to section 7.8 for further details on STS files.
7.3.2
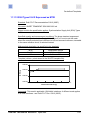
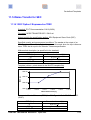
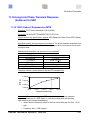
‘Data’ Menu Items:
TIE
: Display plot of the raw time interval error data.
Ym
: Display plot of the mean frequency variation.
MTIE : Display plot of the maximum time interval error.
MADEV : Display plot of the modified Allan deviation.
ADEV : Display plot of the Allan deviation.
TDEV : Display plot of the time deviation.
Refer to section 7.11 for details about these functions.
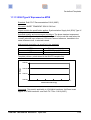
7.3.3
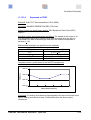
‘Filter’ Menu Items:
Normalize :Starts a linear fit on actual TIE data.
SubSet : Reduce data to un sub set of actual data.
Undo :Undo the last operation on data (subset or Normalization) and return to
original data.
Refer to section 7.12 for details about filter functions.
7.3.4
‘Configuration’ Menu Items:
User Info
• ->Default
For entering default measurement-specific text.
•
->Current Aquisition/File
For entering current acquisition or file measurement-specific text.
STS Configuration
: Sets-up the STS measurement parameters.
Refer to section 7.4 for details on configuring the STS.
OSA 5565 User Manual Revision A
April 2010
7-5
Operation
7.3.5
‘Diagnostics’ Menu Items:
Current Phase
Alarms
Reset Phase Acc.
Status String
STS Firmware Version
: Displays the current phase in units of 0.1
nanoseconds.
: Displays the current STS alarm status.
: Resets the STS phase accumulator to zero.
: Displays the current STS configuration.
: Displays the firmware version of the STS phase
measurement module.
Refer to chapter 8 for details about these functions.
7.3.6
‘About’ Menu Items:
About:
OSA 5565 User Manual Revision A
: Displays an “about” dialogue box displaying title and
version information of the WinSTS program.
April 2010
7-6
Operation
7.4
Setting-Up
7.4.1
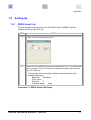
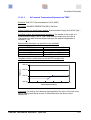
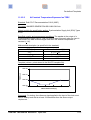
RS232 Serial Link
The first thing that requires setting up is the RS232 “NULL MODEM” serial link
between the PC and the STS unit.
STEP
ACTION
1
Reach the Port Comms setup area.
2
Select the port number on which you connected the STS. The value must
be in a range of 1 to 99. Of course you should only select the ports that
your PC really has.
• The program will automatically configure the selected port to the
following parameters:
Baud rate:
9600 Baud
Parity: None
Stop bits:
2
Character length:
8 bits
Procedure 7-1 RS232 Serial Link Set-up
OSA 5565 User Manual Revision A
April 2010
7-7
Operation
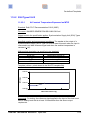
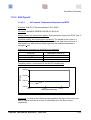
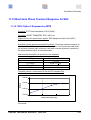
7.4.2
Signals Configuration
Next, configure the STS unit according to the signal to be measured.
STEP
ACTION
1
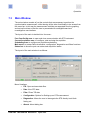
If the port com is closed, click the Open button. The WinSTS program will
then establish a connection to the STS unit. The port status will indicates
“Opened” on status bar.
2
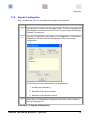
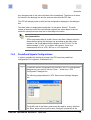
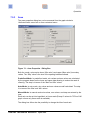
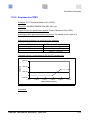
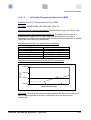
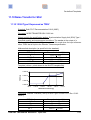
From the “Configuration” menu select “STS configuration”. The following
dialogue box will then retrieves and display the STS unit’s current
configuration:
The STS requires three parameters for a measurement:
1. Auxiliary input frequency.
2. Selection of the input connector.
3. Selection of the reference source.
3
When the STS configuration is complete, click on the “Close” button to
close the dialogue box.
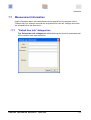
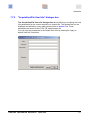
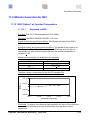
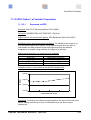
Procedure 7-2 Signals Configuration
OSA 5565 User Manual Revision A
April 2010
7-8
Operation
Any changes made to the values will take effect immediately. Therefore at all times
the values in the dialogue box are the same as those that the STS has.
The STS will always power-up with the last configuration displayed in this dialogue
box.
The alarm status is displayed automatically it in the space “Alarms”. The main
causes of alarms are that the input/reference signals are either absent or do not
match the values that have been set in the dialogue’s controls.
Recommendation:
STS measurement data is invalid if there is an alarm. Always check for
alarms before exiting this dialogue box and observe the alarm lamp
located on the Phase Measurement Module in the STS unit. For the
alarm message ‘y>1E-5’ or ‘no alarm’ with lamp on, there is no
measurement error for ΔTIE< 500 ns on 12.5 ms period.
7.4.3
Predefined Signals Configurations
In order to expedite the setting up process, the STS can store predefined
configurations in 6 registers - numbered 0 to 6.
STEP
ACTION
1
To save the current configuration (the one set in the “STS Configuration”
dialogue box) you have to click the “Save…” button from “STS
Configuration” dialogue box.
The following image shows the “STS Save current settings” dialogue
box:
Config #0 is set at the factory and cannot be used for saving, therefore
the “Save” button will be inactive when Config #0 is selected; all the
OSA 5565 User Manual Revision A
April 2010
7-9
Operation
STEP
ACTION
others are useable.
Clicking on one of the items in the configuration list will cause the
selected configuration to be displayed in the box on the right.
When a register has never been used before, the dialogue box displays
as following:
Clicking on the “Save” button will save the current STS configuration
settings under the highlighted “Config” number. When the saving
successed, the “Save” button becomes inactives until an other
configuration register is selected
2
Clicking on the “Close” button will close the dialogue box.
Procedure 7-3 Saving Current Configuration
OSA 5565 User Manual Revision A
April 2010
7-10
Operation
STEP
ACTION
1
When clicking the “Load…” button from “STS Configuration” dialogue
box, you will be able to set the current configuration to the values of one
of the 7 predefined configurations
You can choose a predifined configuration by selecting one of the items
in the left list.
The content of the selected configuration will be displayed in the box on
the right.
Clicking on the “Load” button will load the selected predefined
configuration and define it as the current configuration. The dialogue box
will automatically close if the loading success.
When a register has never been used before, the dialogue box displays
as following:
The ”Load” button will be inactive.
2
Clicking on the “Close” button will close the dialogue box.
Procedure 7-4 Loading Predefined Configuration
OSA 5565 User Manual Revision A
April 2010
7-11
Operation
Note:
All settings and preferences made are automatically saved when the
application is closed down. STS settings are stored onboard in nonvolatile RAM, whilst program settings are stored in a temp initialisation
file. The initialisation file is automatically created by the program.
7.4.4
Scheduling an Aquisition
This function allows scheduling an aquisition.
STEP
1
ACTION
When scheduling an acquisition, reach the scheduling area
Choose the date and the time of the aquisition. A scheduled date
defined in the past will display an error message.
2
Click on “Set” button to activate the schedule.
OSA 5565 User Manual Revision A
April 2010
7-12
Operation
STEP
3
ACTION
The scheduling area will now look as follows:
The acquisition will start at the programmed schedule.
4
The scheduled aquistion time is now configured :
To disable a scheduled acquisition, press Clear button.
Procedure 7-5 Squeduling an aquisition
OSA 5565 User Manual Revision A
April 2010
7-13
Operation
7.5
Diagnostics Functions
The diagnostics functions, accessible via the ‘Diagnostics’ menu on the main window,
are designed to set up the STS and for fault finding. The following STS functions are
available:
•
Current Phase (in units of 0.1nanoseconds).
•
Alarm status.
•
Resetting of the phase accumulator to zero.
•
Current STS configuration.
•
Firmware version number of the STS phase measurement module.
Clicking on one of the menu items will bring up a dialogue box with a “Refresh” and
“Close” button. Pressing “Refresh” causes the relevant STS command to be sent to the
STS and the reply from the STS is displayed directly to the dialogue box’s message
area.
Note: In the case of ‘Current Phase’, the phase accumulator inside the STS is only able
to hold a maximum phase value of ±100 microseconds (±1000000 × 1.0e-10 seconds).
After this value the phase accumulator “wraps around” to actual TIE ± 100 μs near zero.
In the normal course of operation the WinSTS program, which keeps it’s own “virtual”
phase accumulator, compensates for this effect. Therefore, the value of the phase
obtained via the diagnosis function may not agree with the values shown during a proper
measurement.
For further information and a full list of STS commands, refer to chapter 8.
OSA 5565 User Manual Revision A
April 2010
7-14
Operation
7.6
Data Acquisition - Measuring with WinSTS
Once the WinSTS program has been started and the STS has been set up properly, you
can start measuring. A typical measurement session has the following phases:
•
Data acquisition.
•
Visualisation of the acquired data.
•
Calculation of statistical functions.
Once the STS has been set up (refer to section 7.4), the measuring procedure is as
follows:
STEP
ACTION
1
Enter or select the number of samples that are required in the “Sample” edit
box.
2
Enter or select the frequency at which you wish the readings to occur in the
“Rate” list box.
3
Click on the “Start” button.
Procedure 7-6 Data Acquisition - Measurement
The measurement progress bar will then show the measurement duration. The value and
number of each reading is displayed at the bottom of the screen on the message bar.
The start time and the estimated end time are also shown The measurement may be
aborted at any time by clicking on the “Stop” button.
Any graph windows that are open will be updated regularly with the new readings. Note
though; if there are a large number of graph windows open the update rate will slow
appreciably, particularly on slower machines.
The different functions are processed in the following order:
•
TIE
•
Ym
•
ADEV
•
MADEV
•
TDEV
•
MTIE
OSA 5565 User Manual Revision A
Note:
The MTIE full points calculation can take time
depending of the number of samples and the
values of measurement.
April 2010
7-15
Operation
7.7
Measurement Information
Useful information about the measurement can be entered into the program via the
"Default User Info" dialogue box and the ‘Acquisition/File User Info’ dialogue box which
are accessible from the main menu:
7.7.1
"Default User Info" dialogue box
The ‘Default User Info’ dialogue box allows defining the User Info parameters that
will be used for each new acquisition..
OSA 5565 User Manual Revision A
April 2010
7-16
Operation
7.7.2
"Acquisition/File User Info" dialogue box
The ‘Acquisition/File User Info’ dialogue box allows defining or modifying the User
Info parameters for the current acquisition or opened file. The entered text can be
displayed and printed by every graph window (refer to section 7.9). These
parameters are saved to disc in the TIE measurement file.
You can copy the parameters to the Default User Info by marking the ‘Apply to
default User Info’ check box.
OSA 5565 User Manual Revision A
April 2010
7-17
Operation
7.8
The File System
7.8.1
Measurement Data Files
During aquisition, WinSTS saves the data to a temporary binary file. This temporary
file is deleted once the user has either saved or cancelled the acquisition to a TIE
file. The presence of the temporary file will make the application ask if the current
acquisition has to be saved or not. The presence of the temporary file is checked at
start-up, when starting a new acquisition and when closing the application. The startup check allows to recover the aquisition data after an unvolontary shut-down or a
crash of the computer.
The file format is in ACSII and an information structure has been added before the
data list.
•
The first line informs about the file structure version.
•
The second line gives the number of header lines that follow.
•
The header lines contain the User Info data.
•
The line following the header lines gives the number of acquisition points.
•
Then follow the acquisition data in the following format:
•
[Time(seconds)] <TAB> [Phase value]<CR><LF>
Here is an example of a ten points acquisition file:
WINSTSFILEVERSION=2000<CR><LF>
HeaderLines=6<CR><LF>
Aqui_Info_MeasurementState=10 x 12.5 milliseconds on 29.09.00
16:35:54<CR><LF>
Aqui_Info_Filename=Test_10_corriger.TIE<CR><LF>
Aqui_Info_Comments=DefaultComments<CR><LF>
Aqui_Info_MeasureRef=DefaultReference<CR><LF>
Aqui_Info_SignalTest=DefaultTest<CR><LF>
Aqui_Info_Visa=DefaultVisa<CR><LF>
AquisitionPoints=10<CR><LF>
0.0125<TAB>-1.00E-10<CR><LF>
0.025<TAB>1.00E-10
0.0375<TAB>-1.00E-10<CR><LF>
0.05<TAB>-1.00E-10
0.0625<TAB>-1.00E-10<CR><LF>
0.075<TAB>-1.00E-10
0.0875<TAB>-1.00E-10<CR><LF>
0.1<TAB>-1.00E-10
0.1125<TAB>-1.00E-10<CR><LF>
OSA 5565 User Manual Revision A
April 2010
7-18
Operation
0.125<TAB>-1.00E-10<CR><LF>
By default the data files are stored with “TIE” extensions (Time Interval Error),
though the user is free to choose their own extension if desired.
7.8.2
WinSTS V3.00 Measurement Data Files
WinSTS 3.XX is able to read TIE file formats of version 2.2x. It will also display the
User Info data.
7.8.3
Template Files
Template or mask files (refer to section 7.10 on templates) are also in ASCII format
and differ from the TIE data format in that they have no information structure before
the template data.
Template files can either be created using the “Plot-to-template” graph window
function (section 7.9), or created by the user directly from the software or with the
aid of a simple text editor. Note though, that the last line in the file does not require
the carriage return - line feed characters.
A set of normalised templates is delivered with the application. See the Application
Note for more details about these templates.
OSA 5565 User Manual Revision A
April 2010
7-19
Operation
7.9
The Graph Windows
The graphing windows (see example below) display graphs of the STS TIE and statistical
data based on the TIE readings. The windows are resizeable and have the ability to be
printed out or copied to the Windows clipboard for pasting into other Windows
applications.
There is a graph window for each function. Although there can be any number of
windows open simultaneously, there can only be one window to each function. Clicking
on one of the items in the “Data” menu on the main window will either create and display
graph window or, if it already exists, will bring the selected window to the top of the
Windows desk top.
Figure 7-1 : WinSTS Graph Window Example
The graph window displays at least the data of the current acquisition or open file in
regard to the function. But it can also display template. The function data and the
template data are displayed in different colors and/or different line patterns. Each serie is
listed in a legend above the graph area with its name, its color and its line pattern. The
adjustments for the series are discussed in section 7.9.3.
OSA 5565 User Manual Revision A
April 2010
7-20
Operation
7.9.1
The Graph Screen Menu Bar
7.9.1.1 Menu Headings
• Window
• Show
• Fonts
• Attributes
: Window controls for printing and copying.
: Controls the amount of text information shown on the
window.
: Sets the font attributes for the text displayed on graph axis.
: For adjusting the properties of the graph.
7.9.1.2 "Window" Menu Items
• Print Preview
• Print
• Copy to clipboard
• Copy as
• Plot-to-template
• Show data
• Close
: Opens the Print preview dialogue box. This window
allows printer selection, printer setup and margins
adjustments.
Print the graph window
: Copies the contents of the client area to the Windows
clipboard (in meta-file format) for pasting to other
Windows applications.
Copies the image client area in the selected format
(bmp, jpg, emf , wmf, gif, png, tiff, or pdf): The default
format is png.
: Saves the displayed data points in a template file.
Refer to section 7.10.
Presents to the user a grid view of displayed data.
: Closes the graph window.
7.9.1.3 "Show" Menu Items
•
•
•
•
•
•
•
•
•
•
Grid Lines
Templates
Title
Axis Labels
File Name
Measurement States
Visa
Test Signal/Unit
Reference Signal
User Comments
OSA 5565 User Manual Revision A
:
:
:
:
:
:
:
:
:
:
Displays graph with grid lines.
Displays loaded templates.
Displays the title of the graph.
Displays the graph axis labels.
Displays the name of the current file.
Displays date/time and number of readings.
Displays the user’s name.
Displays the test signal text.
Displays the reference signal text.
Displays the user comments text.
April 2010
7-21
Operation
Only for TIE and Ym window :
• Linear regression line
:
Displays regression parameters and line.
Only for TDEV wndow
• Limite of validity
Displays “tau” limit of validity.
:
7.9.1.4 "Fonts" Menu Items
•
•
•
•
X title
Y title
X labels
Y labels
Configuration of
Configuration of
Configuration of
Configuration of
:
:
:
:
the x axis title font.
the y axis title font.
the x axis labels font.
the y axis labels font.
7.9.1.5 "Attributes" Menu Items
7.9.2
• Header/Footer
• Axes
:
:
• Series
• Templates
:
:
Opens the graph header/footer editor dialogue box.
Opens the axes properties editor dialog box (section
7.9.3).
Opens the series editor dialog box (section 7.9.5).
Opens the template management dialogue box.
The Contextual menu
7.9.2.1 Menu items
• Show data
• Axes
:
:
• Series
• Templates
:
:
OSA 5565 User Manual Revision A
Shows a data grid view of data currently displayed
Opens the axes properties editor dialog box (section
7.9.3).
Opens the series editor dialog box (section 7.9.5).
Opens the template management dialogue box.
April 2010
7-22
Operation
7.9.3
Axes
The axes properties dialog box can be accessed from the graph window’s
‘Attributes-Axes’ menu item or from contextual menu:
Figure 7-1 : Axes Properties - Dialog Box
Both the x and y axis require lower (‘Min value’) and upper (‘Max value’) boundary
values. The ‘Step’ value is the size of the spacing between ordinals.
Predefined Mode: In predefined mode, min values and max values are calculated
by the program based on the lower and upper data allowing to reduce the need of
zooming. The step is in terms of the ‘Max’ and ‘Min’ values.
Auto Mode: In auto mode, min values and max values are self calculated. The step
is in terms of the ‘Max’ and ‘Min’ values.
Manual Mode: In manual mode min values, max values and step are entered by the
user.
Each axis can be set into logarithmic or linear scale (Except Y values for TIE And YM
graph where only linear scale is available).
The dialog box offers also the possibility to change the title of each axis.
OSA 5565 User Manual Revision A
April 2010
7-23
Operation
7.9.4
Show data
The current data grid view can be accessed from the graph window’s ‘Window-Show
data’ menu item or from contextual menu:
OSA 5565 User Manual Revision A
April 2010
7-24
Operation
7.9.5
Series
The series properties dialog box can be accessed from the graph window’s ‘Series’
menu item:
Select the desired serie and set its properties as follow:
To set line properties click on line button to open Border editor.
To set pont properties, click points button to open pointer editor
OSA 5565 User Manual Revision A
April 2010
7-25
Operation
7.9.6
Zooming
7.9.6.1 Zoom IN
You can zoom into the graph simply by selecting a rectangle on the graph.
The rectangle is defined from the upper left corner to the lower right corner while
holding the left mouse button down. During mouse move a white rectangle is drawn
to visualise the selection. If You do not move from left to right and from top to
bottom, the zoom will not be displayed.
This function works only when the graph isn’t in progress
Left mouse button down
and move from top to
bottom and left to right
Figure 7-2 : Zoom IN on Graphs
Once the zoomed part is displayed, You can even zoom further by selecting again a
zone.
OSA 5565 User Manual Revision A
April 2010
7-26
Operation
7.9.6.2 Zoom OUT
To come back to the full curve display, simply select a rectangle where the release
corner does not end under and right of the starting corner.
The following view shows the different possibilities to zoom back to the full curve.
Left mouse button down
and move from bottom to
top and either left or
right or from bottom to
top and right to left.
Figure 7-3 : Zoom OUT on Graphs
7.9.7
Number of Data Points (TIE and Ym only)
This edit control sets the limit to the number of points that are drawn on the graph.
This is necessary for two reasons. One, a graph that has thousands of points is not
particularly clear; and two, drawing thousands of points takes a great deal of
processing time. For printouts and final analysis, there is a check-box to override this
filtering function if desired.
OSA 5565 User Manual Revision A
April 2010
7-27
Operation
7.10 Templates (masks)
The graph windows are able to display templates data (or masks). Templates are stored
as separate ASCII files, which can be created either by using the “Plot-to-template” graph
window function, or by the user directly from management software or with the aid of a
simple text editor. Refer to section 7.8 on file formats. Template files can have long file
names so that they are more descriptive.
Templates differ from measurement data in one important aspect - the points are not
mathematically processed before they are plotted. For example, the point X=1000.0,
Y=1.42e-10 will be plotted at that co-ordinate regardless of whether the graph is of TIE,
MTIE or ADEV etc..
Templates are managed via the ‘User Graph Templates’ dialogue box:
•
To add a template plot to the current graph, hit the ‘ADD ’ button.
•
To remove a template, click on it’s name in the list box and hit ‘REMOVE’ button.
•
To Edit a templete, click on it’s name in the list box and hit ‘EDIT’ button.
•
To create a new template, hit ‘CREATE’ button.
Each graph window has it’s own template management i.e. the TIE window has TIE
templates, the TDEV window has TDEV templates etc. The plotting of templates can
either be enabled or suppressed via the ‘Show/Templates’ graph window menu item.
A set of normalised templates is delivered with the application. See the Application Note,
part 11, for more details about these templates.
OSA 5565 User Manual Revision A
April 2010
7-28
Operation
7.11 Statistical Functions
TIE
7.11.1 MTIE Analysis:
N = ( T / τ0 ) + 1
τ 0 : Sample Period [ s ]
τ = m τ 0 : Observation Time
m=τ
/ τ0
T : Measurement Period [ s ]
T = (N - 1)τ 0
X i = { X 1 , X 2 ,..., X N}
Xppj
N Time Delay samples [ s ]
1
j
j+m
N
Xppj = Peak - to - Peak Xi within jth observation
MTIE(τ ) =
maximum
N − m +1
[
Xppj for all observation of lenght
m + j− 1
m + j- 1
i= j
i= j
τ
within
T
]
MTIE(τ ) = max
max(Xi )− min(Xi )
j =1
Figure 7-4 : MTIE White Phase Noise Simulation
OSA 5565 User Manual Revision A
April 2010
7-29
Operation
7.11.2 ADEV Analysis:
Xi
τ 0 : Sample Period [s]
τ = mτ 0 : Observation Time
T : Measurement Period [s] = (N - 1)τ 0
Xi = {X1, X2,..., XN} , N Time Delay samples [ s]
AVAR(mτ 0) =
N-2m
1
∑ (ΔYi)2
2(N − 2m)(mτ 0)2 i =1
ADEV(mτ 0) =
Xi+m
Yi
Xi+2m
Yi+m
Δ Yi
where ΔYi = Yi + m - Yi = Xi + 2m - 2Xi + m + Xi
N-2m
1
(Xi + 2m − 2Xi + m + Xi)2
2 ∑
2(N − 2m)(mτ 0) i = 1
Figure 7-5 : ADEV White Phase Noise Simulation
OSA 5565 User Manual Revision A
April 2010
7-30
Operation
7.11.3 MADEV & TDEV Analysis:
Xi
Xi+m
τ 0 : Sample Period [s]
τ = mτ 0 : Observation Time
Yi
T : Measurement Period [s] = (N - 1)τ 0
Xi = {X1, X2,..., XN} , N Time Delay samples [ s]
MAVAR(mτ 0) =
MAVAR(mτ 0) =
N-3m
1
∑
2(N − 3m + 1)(mτ 0 )2 j = 0
1
2m (N − 3m + 1)(m
2
MADEV(mτ 0) = MVAR
τ 0)
2
j= 0
Yi+m
Δ Yi
[m1 Aj]
2
∑ [∑ (X
N-3m
Xi+2m
m
where
Aj = ∑ ΔY
m
i + 2m + j
]
− 2Xi + m + j + Xi + j)
i=1
TDEV(mτ 0) =
i+ j
i=1
2
(mτ 0)2
MVAR
3
Figure 7-6 : TDEV White Phase Noise Simulation
OSA 5565 User Manual Revision A
April 2010
7-31
Operation
7.12 Filter Function
7.12.1 Averaging Ym data
The averaging function is accessible on Ym graph window. Put the averaging weight
and click refresh button to take into account the new average weight. The value of
default averaging weight is 10.
This function computes the exponential mean with a time constant of:
Tau = averaging weight * sampling time of TIE
This mean correspond to a low pass RC filter with –3 db bandwidth at f c = 1/(2πTau).
The averaging weight is always displayed in the Ym data Window
Figure 7-7 : Ym Data Averaging Simulation
OSA 5565 User Manual Revision A
April 2010
7-32
Operation
7.12.2 Sub-Set
The Main window allows selecting a sub-set of the actual displayed acquisition. This
can be done with a new aquisition or from a file loaded acquisition.
Selct the main menu <Filters> and choose the item <Sub-Set>. The sub set
configuration window is opened.
As long as the subset has not been disabled, all actions , graphs and functions
(YM,TIE, MTIE, TDEV, ADEV, MADEV) are reported to the selected subset .
To go back to original data use Undo command.
7.12.3 Undo Sub-Set/Normalization
The main menu <Filters> offers the item < Undo>. To disable normalization and
subset functions.
7.12.4 Normalize TIE data
The main menu <Filters> offers the item < Normalize TIE data>. This function gives
the possibility to remove a constant frequency offset and initial TIE from the TIE
data.
The normalization can be done in cascade.
OSA 5565 User Manual Revision A
April 2010
7-33
Operation
The new TIE data correspond to:
^xk = xk – ( a * tk +b)
where
x^ k
xk
τo
a
: new TIE at time tk = K * τo K ∈ {1..n}
: measured TIE at tk = K * τo
: sampling time (rate)
: constant frequency offset
n ∑ (xk * tk ) - ∑ tk * ∑ xk
a=
⎯⎯⎯⎯⎯⎯⎯⎯⎯⎯⎯⎯
n ∑ tk2 -(∑ tk)2
b
: initial TIE
∑ tk ∑ xk - ∑ (xk * tk ) ∑ tk
⎯⎯⎯⎯⎯⎯⎯⎯⎯⎯⎯⎯
n ∑ tk2 -(∑ tk)2
2
b=
7.13 Linear Regression
7.13.1 TIE Linear Regression
The linear regression parameters and the graphical representation ( straight line) is
automatically displayed in the “TIE graph” window if the “Linear regression line”
menu item is tagged in the “Show” menu.
Figure 7-8 : TIE Linear Regression Example
OSA 5565 User Manual Revision A
April 2010
7-34
Operation
Determination of the linear regression line for a number of adjacent points:
st
Abscis of 1 point of mesure:
st
Abscis of 1 point selected :
Abscis of last point selected:
Index of last point measured:
Index of first point :
Index of last point:
Number of points:
Ts = sampling time
T1
T2
n_max
Idx1 = (T1/Ts) -1 if T1 >Ts otherwise Idx1 = 0;
Idx2 = (T2/Ts) - 1 if T2 < Tmax
otherwise Idx2 = n_max
np = Idx2 - Idx1 - 1
Determination of the sums:
Sy =
np −1
∑ Y[i + Idx1]
i= 0
Sxy =
np −1
∑ i * Y[i + Idx1]
i= 0
Determination of slope and offset:
kY =
6 * Sxy − 3 * (np − 1) * Sy
np * (np − 1)
First point : x1 = T1 ; y1 =
Sy
+ kY
np
Last point : x 2 = T 2 ; y1 =
Slope =
Sy
− kY
np
2 * kY
12 * Sxy − 6 * (np − 1 * Sy )
=
Ts * (np − 1)
Ts * np * np 2 − 1
(
)
Offset = y1 − slope * (Idx1 + 1) * Ts
OSA 5565 User Manual Revision A
April 2010
7-35
Operation
7.13.2 Ym Linear Regression
The linear regression parameters and the graphical representation ( straight line) is
automatically displayed in the “Ym graph” window, as well as the daily ageing if the
“Linear regression line” menu item is tagged in the “Show” menu.
Figure 7-9 : YM Linear Regression Example
OSA 5565 User Manual Revision A
April 2010
7-36
Operation
Determination of the linear regression line for difference of a number of
adjacent points:
Abscissa of 1st point of measure:
Ts = sampling time
Abscissa of 1st point selected : T1
Abscissa of last point selected: T2
Index of last point measured:
n_max
Index of first point :
Index of last point:
Number of points:
Idx1 = (T1/Ts) -1 if T1 >Ts otherwise Idx1 = 0;
Idx2 = (T2/Ts) – 1 if T2 < Tmax
otherwise Idx2 = n_max
np = Idx2 - Idx1 - 1
Determination of the sums:
Sy =
np −1
∑ Y[i + Idx1]
i= 0
Sdy = Y[Idx 2] − Y[Idx1]
Sxdy = np * Y[Idx 2] − Sy
Determination of slope and offset:
kdY =
6 * Sxdy − 3 * np * Sdy
np * (np − 1)
⎛ Sdy
⎞ 1
First point : x1 = T1 + Ts ; y1 = ⎜⎜
− kdY ⎟⎟ *
⎝ np − 1
⎠ Ts
⎛ Sdy
⎞ 1
Last point : x 2 = T 2 ; y 2 = ⎜⎜
+ kdY ⎟⎟ *
⎝ np − 1
⎠ Ts
Slope =
12 * Sxdy − 6 * np * Sy
2 * kdY
=
Ts * (np − 2) Ts * np * (np − 1) * (np − 2)
2
Offset = y1 − slope * (Idx1 + 2) * Ts
Daily ageing = slope * 86400
OSA 5565 User Manual Revision A
April 2010
7-37
Operation
This page has been intentionally left blank
OSA 5565 User Manual Revision A
April 2010
7-38
STS COMMS Command Set
Chapter
8
STS COMMS Command Set
Including :
Commande List
The Diagnostics menu
OSA 5565 User Manual Revision A
April 2010
8-1
STS COMMS Command Set
This page has been intentionally left blank
OSA 5565 User Manual Revision A
April 2010
8-2
STS COMMS Command Set
8.1
Commande List
Below is the list of commands that the STS accepts. To communicate with the STS
without using WINSTS.EXE, use a terminal program (such as Windows TERMINAL.EXE)
and set the communications port attributes to: 9600 baud, 2 stop-bits, no parity and 8
data bits.
ALARM
CLEAR
COM=b,d,s,p
CONFx
CONF=x
: State of alarms.
: Reset phase accumulator.
: Set communication parameters.
b = baud rate. Either 1200, 2400, 4800, 9600.
d = data bits/char - 7 or 8.
s = stop bits - 1 or 2.
p = parity - 0 (none), 1 (odd), 2 (even).
: Parameters of configuration (x = 0 to 7).
: Set parameters of configuration (x = 0 to 7).
FAUX
FAUX=xxxx
FIN
FIN=xxxx
HELP
INPUT=IN
INPUT=AUX
REF=INT
REF=EXT
REV
SAVEx
START
STATUS
STOP
UNIT
XI
: Frequency of AUX input.
: Set frequency of AUX input (64 to 16384 kHz).
: Frequency of IN input.
: Set frequency of IN input (64 to 16384 kHz).
: List of commands.
: Set input channel IN.
: Set input channel AUX.
: Set ref. channel internal.
: Set ref. channel external.
: Software revision number.
: Save configuration (x=1 to 7).
: Transmits continuous measurements in ASCII-HEX at 12.5ms.
: Configuration of STS.
: End of continuous measurements.
: Unit of measurements.
: Actual phase in decimal units.
Under normal circumstances communicating to the STS in this way isn’t necessary
because all of the functions are encompassed by WINSTS.EXE.
Note: The STS communications port parameters must be set at 9600 baud, 2 stop-bits,
no parity and 8 data bits; otherwise WinSTS.EXE will not be able to communicate with it.
OSA 5565 User Manual Revision A
April 2010
8-3
STS COMMS Command Set
8.2
The Diagnostics menu
The Diagnostics menu provides the following menu items:
8.2.1
Current Phase
Shows the current phase state of the connected STS equipment. Each “Refresh”
button hit will show a new phase value.
8.2.2
Alarms
Shows the current alarm state of the connected STS equipment. Each “Refresh”
button hit will refresh the alarm state.
OSA 5565 User Manual Revision A
April 2010
8-4
STS COMMS Command Set
8.2.3
Reset Phase Acc
Shows the following dialog box, which allows resetting the Phase accumulator of the
connected STS equipment. You must hit the Refresh button in order to reset the
Phase accumulator :
8.2.4
Status String
Shows the current STS Setup Status state of the connected STS equipment.
OSA 5565 User Manual Revision A
April 2010
8-5
STS COMMS Command Set
8.2.5
STS Firmware Version
Shows the current STS Firmware version of the connected STS equipment.
OSA 5565 User Manual Revision A
April 2010
8-6
Preventive Maintenance & Troubleshooting
Chapter
9
Preventive Maintenance & Troubleshooting
Including :
Preventive Maintenance
Troubleshooting
OSA 5565 User Manual Revision A
April 2010
9-1
Preventive Maintenance & Troubleshooting
This page has been intentionally left blank
OSA 5565 User Manual Revision A
April 2010
9-2
Preventive Maintenance & Troubleshooting
9.1
Preventive Maintenance
The following preventive maintenance is needed to ensure correct, long life operation of
the equipment:
•
• Adjustment of the Rb clock: please refer to chapter 6
•
• Lamp Test: Hold down the toggle switch on the ALARM module (A7) in the
‘Lamp Test’ position - all LEDs should light up.
This ensures that all LEDs are working and that all alarms are displayed correctly.
9.2
Troubleshooting
In case of performance degradation such as output level, phase noise, stability, etc., or
module failure, simply replace the faulty module with a spare. Please refer to chapter 5
for a description of the visual alarm indicators.
Due to the modular architecture of the STS this can be done easily without any special
restrictions. It is not necessary to switch off the power supply during the replacement
procedure. No adjustments other than the ones described in chapter 5 are needed after
a module has been replaced.
OSA 5565 User Manual Revision A
April 2010
9-3
Preventive Maintenance & Troubleshooting
9.3
Oscilloquartz Contact Information
9.3.1
Technical Assistance
For technical assistance, contact the following:
9.3.1.1 International
Oscilloquartz SA
Customer Support & Services
16, Rue de Brévards
2002 Neuchatel 2
SWITZERLAND
Tel: +41-32-722-5555
Fax: +41-32-722-5578
e-mail: [email protected]
9.3.1.2 North America
Oscilloquartz USA
Customer Support & Services
14 Inverness Drive East, Suite F-240
Englewood, CO 80112-5640
USA
Tel: +1-303-790-0281
Fax: +1-303-790-9197
e-mail: [email protected]
OSA 5565 User Manual Revision A
April 2010
9-4
Preventive Maintenance & Troubleshooting
9.3.2
Sales
For sales assistance, contact the following:
9.3.2.1 International
Oscilloquartz SA
Sales & Marketing
16, Rue de Brévards
2002 Neuchatel 2
SWITZERLAND
Tel: +41-32-722-5555
Fax: +41-32-722-5556
e-mail: [email protected]
9.3.2.2 North America
Oscilloquartz USA
Sales & Marketing
14 Inverness Drive East, Suite F-240
Englewood, CO 80112-5640
USA
Tel: +1-303-790-0281
Fax: +1-303-790-9197
e-mail: [email protected]
OSA 5565 User Manual Revision A
April 2010
9-5
Preventive Maintenance & Troubleshooting
This page has been intentionally left blank
OSA 5565 User Manual Revision A
April 2010
9-6
Diagrams & Drawings
Chapter
10 Diagrams & Drawings
Including :
Introduction
Block Diagram
Front Panel
Rear Panel
OSA 5565 User Manual Revision A
April 2010
10-1
Diagrams & Drawings
This page has been intentionally left blank
OSA 5565 User Manual Revision A
April 2010
10-2
Diagrams & Drawings
10.1 Introduction
The next few pages show the block diagram, the front panel and the back panel of the
STS instrument. This information shows the names used throughout this document and
facilitates the understanding of the function of the STS.
10.2 Block Diagram
A5 - Phase measurement module
A2
IN
TEX
or LR
AUX IN
INPUT
MUX
SYNTH.
80'080 Hz ± dF
80 Hz
± dF
COUNTER
EXT REF
G
Rb
REF
MUX
DIVIDER
MICROCONTROL
RS-232
PC with
WinSTS
software
80'000 Hz
A6
Rb
REF
A4
A3
FREQUENCY
CHANGER
OUTPUT
MODULE
OUT 1
OUT 2
REF OUT
Figure 10-1 : STS 5565 Block Diagram
OSA 5565 User Manual Revision A
April 2010
10-3
Diagrams & Drawings
10.3 Front Panel
Figure 10-2 : STS 5565 Front Panel
OSA 5565 User Manual Revision A
April 2010
10-4
Diagrams & Drawings
10.4 Rear Panel
Figure 10-3 : STS 5565 Rear Panel
OSA 5565 User Manual Revision A
April 2010
10-5
Diagrams & Drawings
This page has been intentionally left blank
OSA 5565 User Manual Revision A
April 2010
10-6
Pre-defined Templates
Chapter
11 Pre-defined Templates
Including :
Introduction
SSU Type Applications
Standard Specifications per Equipment Type
Network Limit for Wander at PRC Outputs
Network Limit for Wander at SSU Outputs
Network Limit for Wander at SEC Outputs
Network Limit for Wander at PDH Distribution Outputs
Wander Generation for PRC
Wander Generation for SSU
Noise Transfer for SSU
Short-term Phase Transient Response for SSU
Phase Discontinuity for SSU
Wander Generation for SEC
Noise Transfer for SEC
Short-term Phase Transient Response for SEC
Long-term Phase Transient Response
(holdover) for SEC
OSA 5565 User Manual Revision A
April 2010
11-1
Pre-defined Templates
This page has been intentionally left blank
OSA 5565 User Manual Revision A
April 2010
11-2
Pre-defined Templates
11.1 Introduction
A set of predefined templates is attached to the WinSTS software. The Operating
Manual of the OSA 5565 STS describes how these templates can be loaded and
displayed on a screen, in order to compare them with measurement results. Annex A
gives a description of each template and of its use.
The predefined templates for synchronisation equipment are derived from the latest ITUT Recommendations:
•
ITU-T Recommendation G.811 (05/96) for PRCs
•
Draft ITU-T Recommendation G.812 (09/97) for SSUs
•
ITU-T Recommendation G.813 (08/96) for SECs
Since ITU-T has not yet published recommendations on network limits for
synchronisation networks, network limit templates are based on the European
Telecommunication Standard ETS 300 462-3 (01/97).
11.2 SSU Type Applications
Draft ITU-T Recommendation G.812 (09/97) specifies six types of Synchronisation
Supply Units (SSU). The primary applications of these SSU types are the following:
SSU Type
Primary Application
Which hierarchy?
Which cases?
Type I
2048 kbit/s
Synchronisation chains as long as the
synchronisation reference chain specified in ITUT Rec. G.803
Type II
1544 1 kbit/s
1) Distribution hubs 2
2) In cases where only one single input
reference is available
3
End offices
1
Type III
1544 kbit/s
Type IV
1544 kbit/s3
Existing 3 networks (comment: the bandwith of
this clock is close to the bandwith of a SEC)
Type V
1544 & 2048 kbit/s
3
Existing transit nodes; same as Transit Node
Clock (TNC) in ITU-T Rec. G.812 - 1988
Type VI
2048 kbit/s
Existing2 local nodes; same as Local Node Clock
(LNC) in ITU-T Rec. G.812 - 1988
2
Table 11-1 SSU Type Applications
1
See Bellcore terminology
Prior to indroduction of SDH
3
The 1544 kbit/s hierarchy includes the rates 1544 kbit/s, 6312 kbit/s and 44736 kbit/s.
2
OSA 5565 User Manual Revision A
April 2010
11-3
Pre-defined Templates
Note:
For secondary applications of these SSU types, refer to section 2 of Draft
ITU-T Recommendation G.812 (09/97).
11.3 Standard Specifications per Equipment Type
ITU-T Recommendation G.813 (08/96) specifies two types of SDH Equipment Slave
Clocks called 'SEC Option 1' and 'SEC Option 2'. 'SEC Option 1' applies to SDH
networks optimised for the 2048 kbit/s hierarchy. These networks allow synchronisation
chains which are as long as the synchronisation reference chain specified in ITU-T
Recommendation G.803. 'SEC Option 2' applies to SDH networks optimised for the
particular 1544 kbit/s hierarchy, that includes the rates 1544 kbit/s, 6312 kbit/s and
44736 kbit/s. The synchronisation reference chain for these networks is still under study
at ITU.
The specifications contained in ITU-T Recommendations G.811, Draft G.812 and G.813
are derived from other standards. The following table shows to which other standards
they correspond:
ITU-T Rec.
Equipment
Type
Other Standard
Equipment Type
G.811
PRC
ETS 300 462-6
Primary Reference Clock
(PRC)
Draft G.812
SSU Type I
ETS 300 462-4
Synchronisation Supply Unit
(SSU)
Draft G.812
SSU Type II
Draft ANSI T1.101
Stratum 2 Clock
Draft G.812
SSU Type III
Draft ANSI T1.101
Stratum 3E Clock
Draft G.812
SSU Type IV
Draft ANSI T1.101
Stratum 3 Clock
Draft G.812
SSU Type V
ITU-T G.812 - 1988
Transit Node Clock (TNC)
Draft G.812
SSU Type VI
ITU-T G.812 - 1988
Local Node Clock (LNC)
G.813
SEC Option 1 ETS 300 462-5
G.813
SEC Option 2 Bellcore GR-253-CORE SONET Minimum Clock (SMC)
SDH Equipment Slave Clock
(SEC)
Table 11-2 Standard Specifications per Equipment Type
OSA 5565 User Manual Revision A
April 2010
11-4
Pre-defined Templates
11.4 Network Limit for Wander at PRC Outputs
11.4.1 Expressed as MTIE
Standard: ETS 300 462-3 (01/97)
File name: NETWORK LIMIT PRC ETS 300 462-3.mti
Object to which the specification applies: Synchronisation interface at a PRC output
Specified quantity and measurement conditions: In a synchronisation network, the
wander at any interface of the type "synchronisation interface at a PRC output" must
meet this mask.
Mathematical description (as specified in the standard):
MTIE [ns]
25
0.3 τ
300
0.01 τ
Observation Interval [s]
0.1 < τ < 83
83 < τ < 1000
1000 < τ < 30 000
τ > 30 000 s
Template (circles = points stored in the WinSTS template file):
MTIE [s]
1.00E-05
1.00E-06
1.00E-07
1.00E-08
1.0E-01
1.0E+01
1.0E+03
1.0E+05
Observation Interval [s]
Comments:
OSA 5565 User Manual Revision A
April 2010
11-5
Pre-defined Templates
11.4.2 Expressed as TDEV
Standard: ETS 300 462-3 (01/97)
File name: NETWORK LIMIT PRC ETS 300 462-3.tdv
Object to which the specification applies: Synchronisation interface at a PRC output
Specified quantity and measurement conditions: In a synchronisation network, the
wander at any interface of the type "synchronisation interface at a PRC output" must
meet this mask.
Mathematical description (as specified in the standard):
TDEV [ns]
3
0.03 τ
29.7 + 0.0003
Observation Interval [s]
0.1 < τ < 100
100 < τ < 1000
1000 < τ < 1 000 000
τ
Template (circles = points stored in the WinSTS template file):
TDEV [s]
1.00E-06
1.00E-07
1.00E-08
1.00E-09
1.0E-01
1.0E+01
1.0E+03
1.0E+05
Observation Interval [s]
Comments:
OSA 5565 User Manual Revision A
April 2010
11-6
Pre-defined Templates
11.5 Network Limit for Wander at SSU Outputs
11.5.1 Expressed as MTIE
Standard: ETS 300 462-3 (01/97)
File name: NETWORK LIMIT SSU ETS 300 462-3.mti
Object to which the specification applies: Synchronisation interface at an SSU output
Specified quantity and measurement conditions: In a synchronisation network, the
wander at any interface of the type "synchronisation interface at an SSU output"
must meet this mask.
Mathematical description (as specified in the standard):
MTIE [ns]
25
10 τ
2000
433 τ0.2 + 0.01 τ
Observation Interval [s]
0.1 < τ < 2.5
2.5 < τ < 200
200 < τ < 2000
τ > 2000
Template (circles = points stored in the WinSTS template file):
1.00E-04
MTIE [s]
1.00E-05
1.00E-06
1.00E-07
1.00E-08
1.0E-01
1.0E+01
1.0E+03
1.0E+05
Observation Interval [s]
Comments:
OSA 5565 User Manual Revision A
April 2010
11-7
Pre-defined Templates
11.5.2 Expressed as TDEV
Standard: ETS 300 462-3 (01/97)
File name: NETWORK LIMIT SSU ETS 300 462-3.tdv
Object to which the specification applies: Synchronisation interface at an SSU output
Specified quantity and measurement conditions: In a synchronisation network, the
wander at any interface of the type "synchronisation interface at an SSU output"
must meet this mask.
Mathematical description (as specified in the standard):
TDEV [ns]
3
0.7 τ
58 + 1.2 τ0.5 + 0.0003 τ
Observation Interval [s]
0.1 < τ < 4.3
4.3 < τ < 100
100 < τ < 1 000 000
Template (circles = points stored in the WinSTS template file):
1.00E-05
TDEV [s]
1.00E-06
1.00E-07
1.00E-08
1.00E-09
1.0E-01
1.0E+01
1.0E+03
1.0E+05
Observation Interval [s]
Comments:
OSA 5565 User Manual Revision A
April 2010
11-8
Pre-defined Templates
11.6 Network Limit for Wander at SEC Outputs
11.6.1 Expressed as MTIE
Standard: ETS 300 462-3 (01/97)
File name: NETWORK LIMIT SEC ETS 300 462-3.mti
Object to which the specification applies: Synchronisation interface at a SEC output
Specified quantity and measurement conditions: In a synchronisation network, the
wander at any interface of the type "synchronisation interface at a SEC output" must
meet this mask.
Mathematical description (as specified in the standard):
MTIE [ns]
250
100 τ
2000
0.2
433 τ + 0.01 τ
Observation Interval [s]
0.1 < τ < 2.5
2.5 < τ < 20
20 < τ < 2000
τ > 2000
Template (circles = points stored in the WinSTS template file):
MTIE [s]
1.00E-04
1.00E-05
1.00E-06
1.00E-07
1.0E-01
1.0E+01
1.0E+03
1.0E+05
Observation Interval [s]
Comments:
OSA 5565 User Manual Revision A
April 2010
11-9
Pre-defined Templates
11.6.2 Expressed as TDEV
Standard: ETS 300 462-3 (01/97)
File name: NETWORK LIMIT SEC ETS 300 462-3.tdv
Object to which the specification applies: Synchronisation interface at a SEC output
Specified quantity and measurement conditions: In a synchronisation network, the
wander at any interface of the type "synchronisation interface at a SEC output" must
meet this mask.
Mathematical description (as specified in the standard):
TDEV [ns]
12
0.7 τ
58 + 1.2 τ0.5 + 0.0003
Observation Interval [s]
0.1 < τ < 17.14
17.14 < τ < 100
100 < τ < 1 000 000
Template (circles = points stored in the WinSTS template file):
1.00E-05
TDEV [s]
1.00E-06
1.00E-07
1.00E-08
1.00E-09
1.0E-01
1.0E+01
1.0E+03
1.0E+05
Observation Interval [s]
Comments:
OSA 5565 User Manual Revision A
April 2010
11-10
Pre-defined Templates
11.7 Network Limit for Wander at PDH Distribution Outputs
11.7.1 Expressed as MTIE
Standard: ETS 300 462-3 (01/97)
File name: NETWORK LIMIT PDH ETS 300 462-3.mti
Object to which the specification applies: Synchronisation interface at a PDH
distribution output
Specified quantity and measurement conditions: In a synchronisation network, the
wander at any interface of the type "synchronisation interface at a PDH distribution
output" must meet this mask.
Mathematical description (as specified in the standard):
MTIE [ns]
732
100 τ
2000
433 τ0.2 + 0.01 τ
Observation Interval [s]
0.1 < τ < 7.3
7.3 < τ < 20
20 < τ < 2000
τ > 2000
Template (circles = points stored in the WinSTS template file):
MTIE [s]
1.00E-04
1.00E-05
1.00E-06
1.00E-07
1.0E-01
1.0E+01
1.0E+03
1.0E+05
Observation Interval [s]
Comments:
OSA 5565 User Manual Revision A
April 2010
11-11
Pre-defined Templates
11.7.2 Expressed as TDEV
Standard: ETS 300 462-3 (01/97)
File name: NETWORK LIMIT PDH ETS 300 462-3.tdv
Object to which the specification applies: Synchronisation interface at a PDH
distribution output
Specified quantity and measurement conditions: In a synchronisation network, the
wander at any interface of the type "synchronisation interface at a PDH distribution
output" must meet this mask.
Mathematical description (as specified in the standard):
TDEV [ns]
34
0.7 τ
58 + 1.2 τ0.5 + 0.0003 τ ns
Observation Interval [s]
0.1 < τ < 48
48 < τ < 100
100 < τ < 1 000 000
Template (circles = points stored in the WinSTS template file):
TDEV [s]
1.00E-05
1.00E-06
1.00E-07
1.00E-08
1.0E-01
1.0E+01
1.0E+03
1.0E+05
Observation Interval [s]
Comments:
OSA 5565 User Manual Revision A
April 2010
11-12
Pre-defined Templates
11.8 Wander Generation for PRC
11.8.1 Expressed as MTIE
Standard: ITU-T Recommendation G.811 (05/96)
File name: WANDER GENERATION PRC G811.mti
Object to which the specification applies: Primary Reference Clock (PRC)
Specified quantity and measurement conditions: The wander at the output of a
Primary Reference Clock must meet this mask.
Mathematical description (as specified in the standard):
Observation Interval [s]
MTIE [μs]
0.275E-3 τ + 0.025
1E-5 τ + 0.29
0.1 < τ < 1000
τ > 1000
Template (circles = points stored in the WinSTS template file):
1.00E-04
MTIE [s]
1.00E-05
1.00E-06
1.00E-07
1.00E-08
1.0E-01
1.0E+01
1.0E+03
1.0E+05
Observation Interval [s]
Comments:
OSA 5565 User Manual Revision A
April 2010
11-13
Pre-defined Templates
11.8.2 Expressed as TDEV
Standard: ITU-T Recommendation G.811 (05/96)
File name: WANDER GENERATION PRC G811.tdv
Object to which the specification applies: Primary Reference Clock (PRC)
Specified quantity and measurement conditions: The wander at the output of a
Primary Reference Clock must meet this mask.
Mathematical description (as specified in the standard):
TDEV [ns]
3
0.03 τ
30
Observation Interval [s]
0.1 < τ < 100
100 < τ < 1000
1000 < τ < 10 000
Template (circles = points stored in the WinSTS template file):
TDEV [s]
1.00E-06
1.00E-07
1.00E-08
1.00E-09
1.0E-01
1.0E+00
1.0E+01
1.0E+02
1.0E+03
1.0E+04
Observation Interval [s]
Comments:
OSA 5565 User Manual Revision A
April 2010
11-14
Pre-defined Templates
11.9 Wander Generation for SSU
11.9.1 SSU Type I
11.9.1.1
At Constant Temperature Expressed as MTIE
Standard: Draft ITU-T Recommendation G.812 (09/97)
File name: WANDER GENERATION SSU I G812.mti
Object to which the specification applies: Synchronisation Supply Unit (SSU) Type I
Specified quantity and measurement conditions: The wander at the output of a
Synchronisation Supply Unit of Type I must meet this mask when the input is
connected to an ideal reference signal and when the ambient temperature is
constant (+ 1 K).
Mathematical description (as specified in the standard):
MTIE [ns]
24
8 τ0.5
160
Observation Interval [s]
0.1 < τ < 9
9 < τ < 400
400 < τ < 10 000
Template (circles = points stored in the WinSTS template file):
MTIE [s]
1.00E-05
1.00E-06
1.00E-07
1.00E-08
1.0E-01
1.0E+00
1.0E+01
1.0E+02
1.0E+03
1.0E+04
Observation Interval [s]
Comments: For testing, the reference signal applied to the input of the clock must
have a stability level that is at least 10 times better than the above output
requirement.
OSA 5565 User Manual Revision A
April 2010
11-15
Pre-defined Templates
11.9.1.2
At Variable Temperature Expressed as MTIE
Standard: Draft ITU-T Recommendation G.812 (09/97)
File name: WANDER GEN VAR TEMP SSU I G812.mti
Object to which the specification applies: Synchronisation Supply Unit (SSU) Type I
Specified quantity and measurement conditions: The wander at the output of a
Synchronisation Supply Unit of Type I must meet this mask when the input is
connected to an ideal reference signal and when the ambient temperature is variable
(range and rate of change to be defined).
Mathematical description (as specified in the standard):
MTIE [ns]
24
0.5
8τ
160
0.5
3.2 τ
Observation Interval [s]
0.1 < τ < 9
9 < τ < 400
400 < τ < 2500
2500 < τ < 10 000
Template (circles = points stored in the WinSTS template file):
MTIE [s]
1.00E-05
1.00E-06
1.00E-07
1.00E-08
1.0E-01
1.0E+01
1.0E+03
Observation Interval [s]
Comments: For testing, the reference signal applied to the input of the clock must
have a stability level that is at least 10 times better than the above output
requirement.
OSA 5565 User Manual Revision A
April 2010
11-16
Pre-defined Templates
11.9.1.3
At Constant Temperature Expressed as TDEV
Standard: Draft ITU-T Recommendation G.812 (09/97)
File name: WANDER GENERATION SSU I G812.tdv
Object to which the specification applies: Synchronisation Supply Unit (SSU) Type I
Specified quantity and measurement conditions: The wander at the output of a
Synchronisation Supply Unit of Type I must meet this mask when the input is
connected to an ideal reference signal and when the ambient temperature is
constant (+ 1 K).
Mathematical description (as specified in the standard):
TDEV [ns]
3
0.12 τ
12
Observation Interval [s]
0.1 < τ < 25
25 < τ < 100
100 < τ < 10 000
Template (circles = points stored in the WinSTS template file):
TDEV [s]
1.00E-06
1.00E-07
1.00E-08
1.00E-09
1.0E-01
1.0E+00
1.0E+01
1.0E+02
1.0E+03
1.0E+04
Observation Interval [s]
Comments: For testing, the reference signal applied to the input of the clock must
have a stability level that is at least 10 times better than the above output
requirement.
OSA 5565 User Manual Revision A
April 2010
11-17
Pre-defined Templates
11.9.2 SSU Types II & III
11.9.2.1
At Constant Temperature Expressed as MTIE
Standard: Draft ITU-T Recommendation G.812 (09/97)
File name: WANDER GENERATION SSU II&III G812.mti
Object to which the specification applies: Synchronisation Supply Unit (SSU) Types
II & III
Specified quantity and measurement conditions: The wander at the output of a
Synchronisation Supply Unit of Type II or III must meet this mask when the input is
connected to an ideal reference signal and when the ambient temperature is
constant (+ 1 K).
Mathematical description (as specified in the standard):
MTIE [ns]
40
40 τ0.4
100
Observation Interval [s]
0.1 < τ < 1
1 < τ < 10
τ > 10
Template (circles = points stored in the WinSTS template file):
MTIE [s]
1.00E-05
1.00E-06
1.00E-07
1.00E-08
1.0E-01
1.0E+01
1.0E+03
Observation Interval [s]
Comments: For testing, the reference signal applied to the input of the clock must
have a stability level that is at least 10 times better than the above output
requirement.
OSA 5565 User Manual Revision A
April 2010
11-18
Pre-defined Templates
11.9.2.2
At Constant Temperature Expressed as TDEV
Standard: Draft ITU-T Recommendation G.812 (09/97)
File name: WANDER GENERATION SSU II&III G812.tdv
Object to which the specification applies: Synchronisation Supply Unit (SSU) Types
II & III
Specified quantity and measurement conditions: The wander at the output of a
Synchronisation Supply Unit of Type II or III must meet this mask when the input is
connected to an ideal reference signal and when the ambient temperature is
constant (+ 1 K).
Mathematical description (as specified in the standard):
TDEV [ns]
3.2 τ-0.5
2
0.32 τ0.5
10
Observation Interval [s]
0.1 < τ < 2.5
2.5 < τ < 40
40 < τ < 1000
τ > 1000
Template (circles = points stored in the WinSTS template file):
TDEV [s]
1.00E-06
1.00E-07
1.00E-08
1.00E-09
1.0E-01
1.0E+00
1.0E+01
1.0E+02
1.0E+03
1.0E+04
Observation Interval [s]
Comments: For testing, the reference signal applied to the input of the clock must
have a stability level that is at least 10 times better than the above output
requirement.
OSA 5565 User Manual Revision A
April 2010
11-19
Pre-defined Templates
11.9.3 SSU Type IV
11.9.3.1
At Constant Temperature Expressed as MTIE
Standard: Draft ITU-T Recommendation G.812 (09/97)
File name: WANDER GENERATION SSU IV G812.mti
Object to which the specification applies: Synchronisation Supply Unit (SSU) Type IV
Specified quantity and measurement conditions: The wander at the output of a
Synchronisation Supply Unit of Type IV, must meet this mask when the input is
connected to an ideal reference signal and when the ambient temperature is
constant (+ 1 K).
Mathematical description (as specified in the standard):
MTIE [ns]
40
40 τ0.4
100
Observation Interval [s]
0.1 < τ < 1
1 < τ < 10
τ > 10
Template (circles = points stored in the WinSTS template file):
MTIE [s]
1.00E-05
1.00E-06
1.00E-07
1.00E-08
1.0E-01
1.0E+01
1.0E+03
Observation Interval [s]
Comments: For testing, the reference signal applied to the input of the clock must
have a stability level that is at least 10 times better than the above output
requirement.
OSA 5565 User Manual Revision A
April 2010
11-20
Pre-defined Templates
11.9.3.2
At Constant Temperature Expressed as TDEV
Standard: Draft ITU-T Recommendation G.812 (09/97)
File name: WANDER GENERATION SSU IV G812.tdv
Object to which the specification applies: Synchronisation Supply Unit (SSU) Type IV
Specified quantity and measurement conditions: The wander at the output of a
Synchronisation Supply Unit of Type IV must meet this mask when the input is
connected to an ideal reference signal and when the ambient temperature is
constant (+ 1 K).
Mathematical Description (as specified in the standard):
TDEV [ns]
-0.5
3.2 τ
2
0.5
0.32 τ
10
Observation Interval [s]
0.1 < τ < 2.5
2.5 < τ < 40
40 < τ < 1000
τ > 1000
Template (circles = points stored in the WinSTS template file):
TDEV [s]
1.00E-06
1.00E-07
1.00E-08
1.00E-09
1.0E-01
1.0E+00
1.0E+01
1.0E+02
1.0E+03
1.0E+04
Observation Interval [s]
Comments: For testing, the reference signal applied to the input of the clock must
have a stability level that is at least 10 times better than the above output
requirement.
OSA 5565 User Manual Revision A
April 2010
11-21
Pre-defined Templates
11.9.4 SSU Types V & VI
11.9.4.1
At Constant Temperature Expressed as MTIE
Standard: Draft ITU-T Recommendation G.812 (09/97)
File name: WANDER GENERATION SSU V&VI G812.mti
Object to which the specification applies: Synchronisation Supply Unit (SSU) Types
V & VI
Specified quantity and measurement conditions: The wander at the output of a
Synchronisation Supply Unit of Type V or VI must meet this mask when the input is
connected to an ideal reference signal and when the ambient temperature is
constant (+ 1 K).
Mathematical description (as specified in the standard):
MTIE [ns]
1000
Observation Interval [s]
τ > 100
Template (circles = points stored in the WinSTS template file):
MTIE [s]
1.00E-05
1.00E-06
1.00E-07
1.00E-08
1.0E-01
1.0E+01
1.0E+03
Observation Interval [s]
Comments: For testing, the reference signal applied to the input of the clock must
have a stability level that is at least 10 times better than the above output
requirement.
OSA 5565 User Manual Revision A
April 2010
11-22
Pre-defined Templates
11.10 Noise Transfer for SSU
11.10.1 SSU Type I Expressed as TDEV
Standard: Draft ITU-T Recommendation G.812 (09/97)
File name: NOISE TRANSFER SSU I G812.tdv
Object to which the specification applies: Synchronisation Supply Unit (SSU) Type I
Specified quantity and measurement conditions: The wander at the output of a
Synchronisation Supply Unit of Type I must meet this mask when the input reference
has a TDEV that is equal to the Wander Tolerance specification.
Mathematical description (as specified in the standard):
TDEV [ns]
3
0.0176 τ2
176
5.58 τ0.5
Observation Interval [s]
0.1 < τ < 13.1
13.1 < τ < 100
100 < τ < 1000
1000 < τ < 10 000
Template (circles = points stored in the WinSTS template file):
TDEV [s]
1.00E-06
1.00E-07
1.00E-08
1.00E-09
1.0E-01
1.0E+00
1.0E+01
1.0E+02
1.0E+03
1.0E+04
Observation Interval [s]
Comments: Wander Tolerance (TDEV) for SSU Type I in Draft ITU-T Rec. G.812
(09/97):
TDEV [ns]
34
1.7 τ
170
5.4 τ0.5
OSA 5565 User Manual Revision A
Observation Interval [s]
0.1 < τ < 20
20 < τ < 100
100 < τ < 1000
1000 < τ < 10 000
April 2010
11-23
Pre-defined Templates
11.10.2 SSU Types II & III Expressed as TDEV
Standard: Draft ITU-T Recommendation G.812 (09/97)
File name: NOISE TRANSFER SSU II&III G812.tdv
Object to which the specification applies: Synchronisation Supply Unit (SSU) Type I
Specified quantity and measurement conditions: The wander at the output of a
Synchronisation Supply Unit of Type II or III must meet this mask when the input
reference has a TDEV that is equal to the Wander Tolerance specification.
Mathematical description (as specified in the standard):
TDEV [ns]
3.2 τ-0.5
1.86 τ
32.2 τ0.5
Observation Interval [s]
0.1 < τ < 1.44
1.44 < τ < 300
300 < τ < 1000
Template (circles = points stored in the WinSTS template file):
TDEV [s]
1.00E-06
1.00E-07
1.00E-08
1.00E-09
1.0E-01
1.0E+00
1.0E+01
1.0E+02
1.0E+03
1.0E+04
Observation Interval [s]
Comments: Wander Tolerance (TDEV) for SSU Type II & III in Draft ITU-T Rec.
G.812 (09/97):
TDEV [ns]
100
31.6 τ0.5
for further study
OSA 5565 User Manual Revision A
Observation Interval [s]
0.05 < τ < 10
10 < τ < 1000
τ > 1000
April 2010
11-24
Pre-defined Templates
11.10.3 SSU Type IV Expressed as TDEV
Standard: Draft ITU-T Recommendation G.812 (09/97)
File name: NOISE TRANSFER SSU IV G812.tdv
Object to which the specification applies: Synchronisation Supply Unit (SSU) Type IV
Specified quantity and measurement conditions: The wander at the output of a
Synchronisation Supply Unit of Type IV must meet this mask when the input
reference has a TDEV that is equal to the Wander Tolerance specification.
Mathematical Description (as specified in the standard):
TDEV [ns]
1020 τ
102
32.2 τ0.5
Observation Interval [s]
0.05 < τ < 0.1
0.1 < τ < 10
10 < τ < 1000
Template (circles = points stored in the WinSTS template file):
TDEV [s]
1.00E-06
1.00E-07
1.00E-08
1.00E-09
1.0E-02
1.0E-01
1.0E+00
1.0E+01
1.0E+02
1.0E+03
1.0E+04
Observation Interval [s]
Comments: Wander Tolerance (TDEV) for SSU Type IV in Draft ITU-T Rec. G.812
(09/97):
TDEV [ns]
100
31.6 τ0.5
for further study
OSA 5565 User Manual Revision A
Observation Interval [s]
0.05 < τ < 10
10 < τ < 1000
τ > 1000
April 2010
11-25
Pre-defined Templates
11.11 Short-term Phase Transient Response for SSU
11.11.1 SSU Type I Expressed as MTIE
Standard: Draft ITU-T Recommendation G.812 (09/97)
File name: SHORT TRANSIENT SSU I G812.mti
Object to which the specification applies: Synchronisation Supply Unit (SSU) Type I
Specified quantity and measurement conditions: The phase transient response at
the output of a Synchronisation Supply Unit of Type I must meet this mask, when the
currently selected input reference is lost and a second reference, traceable to the
same reference clock, is selected instead.
Mathematical description (as specified in the standard):
MTIE
25
7500 τ
120 + 0.5 τ
240
Observation Interval
0.001 < τ < 0.0033
0.0033 < τ < 0.016
0.016 < τ < 240
240 < τ < 1000
Template (circles = points stored in the WinSTS template file):
MTIE [s]
1.00E-06
1.00E-07
1.00E-08
1.00E-09
1.0E-02
1.0E-01
1.0E+00
1.0E+01
1.0E+02
1.0E+03
Observation Interval [s]
Comments: This mask is applicable to 2048 kHz and 2048 kbit/s interfaces. A
different mask applies to STM-N interfaces - see Draft ITU-T Rec. G.812 (09/97).
OSA 5565 User Manual Revision A
April 2010
11-26
Pre-defined Templates
11.11.2 SSU Types II & III Expressed as MTIE
Standard: Draft ITU-T Recommendation G.812 (09/97)
File name: SHORT TRANSIENT SSU II&III G812.mti
Object to which the specification applies: Synchronisation Supply Unit (SSU) Types
II & III
Specified quantity and measurement conditions: The phase transient response at
the output of a Synchronisation Supply Unit of Type II or III must meet this mask
when the currently selected input reference is lost and a second reference, traceable
to the same reference clock, is selected instead.
Mathematical description (as specified in the standard):
MTIE
40 + 885 τ
182
Observation Interval
0.014 < τ < 0.16
0.16 < τ < 280
Template (circles = points stored in the WinSTS template file):
MTIE [s]
1.00E-06
1.00E-07
1.00E-08
1.00E-09
1.0E-02
1.0E-01
1.0E+00
1.0E+01
1.0E+02
1.0E+03
Observation Interval [s]
Comments: This mask is applicable 1544 kbit/s interfaces. A different mask applies
to STM-N interfaces - see Draft ITU-T Rec. G.812 (09/97).
OSA 5565 User Manual Revision A
April 2010
11-27
Pre-defined Templates
11.11.3 SSU Type IV Expressed as MTIE
Standard: Draft ITU-T Recommendation G.812 (09/97)
File name: SHORT TRANSIENT SSU IV G812.mti
Object to which the specification applies: Synchronisation Supply Unit (SSU) Type IV
Specified quantity and measurement conditions: The phase transient response at
the output of a Synchronisation Supply Unit Type IV must meet this mask when the
currently selected input reference is lost and a second reference, traceable to the
same reference clock, is selected instead.
Mathematical description (as specified in the standard):
MTIE
61 000 τ
1000
Observation Interval
0.00133 < τ < 0.0164
τ > 0.0164
Template (circles = points stored in the WinSTS template file):
MTIE [s]
1.00E-05
1.00E-06
1.00E-07
1.00E-08
1.0E-02
1.0E-01
1.0E+00
1.0E+01
1.0E+02
1.0E+03
Observation Interval [s]
Comments: This mask is applicable to 1544 kbit/s interfaces. A different mask
applies to STM-N interfaces - see Draft ITU-T Rec. G.812 (09/97).
OSA 5565 User Manual Revision A
April 2010
11-28
Pre-defined Templates
11.11.4 SSU Types V & VI Expressed as MTIE
Standard: Draft ITU-T Recommendation G.812 (09/97)
File name: SHORT TRANSIENT SSU V&VI G812.mti
Object to which the specification applies: Synchronisation Supply Unit (SSU) Type V
& VI
Specified quantity and measurement conditions: The phase transient response at
the output of a Synchronisation Supply Unit of Type V or VI must meet this mask
when the currently selected input reference is lost and a second reference, traceable
to the same reference clock, is selected instead.
Mathematical description (as specified in the standard):
MTIE
25
7500 τ
120 + 0.5 τ
240
Observation Interval
0.001 < τ < 0.0033
0.0033 < τ < 0.016
0.016 < τ < 240
240 < τ < 10 000
Template (circles = points stored in the WinSTS template file):
MTIE [s]
1.00E-06
1.00E-07
1.00E-08
1.00E-09
1.0E-02
1.0E-01
1.0E+00
1.0E+01
1.0E+02
1.0E+03
1.0E+04
Observation Interval [s]
Comments: This mask is applicable to 2048 kHz and 2048 kbit/s interfaces. A
different mask applies to STM-N interfaces - see Draft ITU-T Rec. G.812 (09/97).
OSA 5565 User Manual Revision A
April 2010
11-29
Pre-defined Templates
11.12 Phase Discontinuity for SSU
11.12.1 SSU Type I Expressed as MTIE
Standard: Draft ITU-T Recommendation G.812 (09/97)
File name: PHASE DISCONTINUITY SSU I G812.mti
Object to which the specification applies: Synchronisation Supply Unit (SSU) Type I
Specified quantity and measurement conditions: The phase transient response at
the output of a Synchronisation Supply Unit of Type I must meet this mask in cases
of infrequent internal testing or rearrangement operations within the Synchronisation
Supply Unit.
Mathematical description (as specified in the standard):
MTIE [ns]
60
120
240
Observation Interval [s]
τ < 0.001
0.001 < τ < 4
τ>4
Template (circles = points stored in the WinSTS template file):
MTIE [s]
1.00E-06
1.00E-07
1.00E-08
1.00E-09
1.0E-02
1.0E-01
1.0E+00
1.0E+01
1.0E+02
1.0E+03
Observation Interval [s]
Comments:
OSA 5565 User Manual Revision A
April 2010
11-30
Pre-defined Templates
11.12.2 SSU Types II & III Expressed as MTIE
Standard: Draft ITU-T Recommendation G.812 (09/97)
File name: PHASE DISCONTINUITY SSU II&III G812.mti
Object to which the specification applies: Synchronisation Supply Unit (SSU) Types
II & III
Specified quantity and measurement conditions: The phase transient response at
the output of a Synchronisation Supply Unit of Type II or III must meet this mask in
cases of infrequent internal testing or rearrangement operations within the
Synchronisation Supply Unit.
Mathematical description (as specified in the standard):
MTIE [ns]
61 000 τ
1000
Observation Interval [s]
0.00133 < τ < 0.0164
τ > 0.0164
Template (circles = points stored in the WinSTS template file):
MTIE [s]
1.00E-05
1.00E-06
1.00E-07
1.00E-08
1.0E-02
1.0E-01
1.0E+00
1.0E+01
1.0E+02
1.0E+03
Observation Interval [s]
Comments:
OSA 5565 User Manual Revision A
April 2010
11-31
Pre-defined Templates
11.12.3 SSU Type IV Expressed as MTIE
Standard: Draft ITU-T Recommendation G.812 (09/97)
File name: PHASE DISCONTINUITY SSU IV G812.mti
Object to which the specification applies: Synchronisation Supply Unit (SSU) Type IV
Specified quantity and measurement conditions: The phase transient response at
the output of a Synchronisation Supply Unit of Type IV must meet this mask in cases
of infrequent internal testing or rearrangement operations within the Synchronisation
Supply Unit.
Mathematical description (as specified in the standard):
MTIE [ns]
Not Applicable
61 000 τ
1000
Observation Interval [s]
τ < 0.00133
0.00133 < τ < 0.0164
τ > 0.0164
Template (circles = points stored in the WinSTS template file):
MTIE [s]
1.00E-05
1.00E-06
1.00E-07
1.00E-08
1.0E-02
1.0E-01
1.0E+00
1.0E+01
1.0E+02
1.0E+03
Observation Interval [s]
Comments:
OSA 5565 User Manual Revision A
April 2010
11-32
Pre-defined Templates
11.12.4 SSU Types V & VI Expressed as MTIE
Standard: Draft ITU-T Recommendation G.812 (09/97)
File name: PHASE DISCONTINUITY SSU V&VI G812.mti
Object to which the specification applies: Synchronisation Supply Unit (SSU) Types
V & VI
Specified quantity and measurement conditions: The phase transient response at
the output of a Synchronisation Supply Unit of Type V or VI must meet this mask in
cases of infrequent internal testing or rearrangement operations within the
Synchronisation Supply Unit.
Mathematical description (as specified in the standard):
MTIE [ns]
61
61 000 τ
1000
Observation Interval [s]
τ < 0.001
0.001 < τ < 0.0164
τ > 0.0164
Template (circles = points stored in the WinSTS template file):
MTIE [s]
1.00E-05
1.00E-06
1.00E-07
1.00E-08
1.0E-02
1.0E-01
1.0E+00
1.0E+01
1.0E+02
1.0E+03
Observation Interval [s]
Comments:
OSA 5565 User Manual Revision A
April 2010
11-33
Pre-defined Templates
11.13 Wander Generation for SEC
11.13.1 SEC Option 1 at Constant Temperature
11.13.1.1
Expressed as MTIE
Standard: Draft ITU-T Recommendation G.813 (08/96)
File name: WANDER GENERATION SEC 1 G813.mti
Object to which the specification applies: SDH Equipment Slave Clock (SEC)
Option 1
Specified quantity and measurement conditions: The wander at the output of an
SDH Equipment Slave Clock Option 1 must meet this mask when the input is
connected to an ideal reference signal and when the ambient temperature is
constant (+ 1 K).
Mathematical description (as specified in the standard):
MTIE [ns]
40
40 τ0.1
25.25 τ0.2
Observation Interval [s]
0.1 < τ < 1
1 < τ < 100
100 < τ < 1000
Template (circles = points stored in the WinSTS template file):
MTIE [s]
1.00E-06
1.00E-07
1.00E-08
1.00E-09
1.0E-01
1.0E+00
1.0E+01
1.0E+02
1.0E+03
Observation Interval [s]
Comments: For testing, the reference signal applied to the input of the clock must
have a stability level that is at least 10 times better than the above output
requirement.
OSA 5565 User Manual Revision A
April 2010
11-34
Pre-defined Templates
11.13.1.2
Expressed as TDEV
Standard: Draft ITU-T Recommendation G.813 (08/96)
File name: WANDER GENERATION SEC 1 G813.tdv
Object to which the specification applies: SDH Equipment Slave Clock (SEC) Option
1
Specified quantity and measurement conditions: The wander at the output of an
SDH Equipment Slave Clock Option 1 must meet this mask when the input is
connected to an ideal reference signal and when the ambient temperature is
constant (+ 1 K).
Mathematical description (as specified in the standard):
TDEV [ns]
3.2
0.64 τ0.5
6.4
Observation Interval [s]
0.1 < τ < 25
25 < τ < 100
100 < τ < 1000
Template (circles = points stored in the WinSTS template file):
TDEV [s]
1.00E-07
1.00E-08
1.00E-09
1.00E-10
1.0E-01
1.0E+00
1.0E+01
1.0E+02
1.0E+03
1.0E+04
Observation Interval [s]
Comments: For testing, the reference signal applied to the input of the clock must
have a stability level that is at least 10 times better than the above output
requirement.
OSA 5565 User Manual Revision A
April 2010
11-35
Pre-defined Templates
11.13.2 SEC Option 1 at Variable Temperature
11.13.2.1
Expressed as MTIE
Standard: Draft ITU-T Recommendation G.813 (08/96)
File name: WANDER GEN VAR TEMP SEC 1 G813.mti
Object to which the specification applies: SDH Equipment Slave Clock (SEC)
Option 1
Specified quantity and measurement conditions: The wander at the output of an
SDH Equipment Slave Clock Option 1 must meet this mask when the input is
connected to an ideal reference signal and signal and when the ambient
temperature is variable (range and rate of change to be defined).
Mathematical description (as specified in the standard):
MTIE [ns]
40 + 0.5 τ
40 τ0.1 + 0.5 τ
25.25 τ0.2 + 50
Observation Interval [s]
0.1 < τ < 1
1 < τ < 100
100 < τ < 1000
Template (circles = points stored in the WinSTS template file):
MTIE [s]
1.00E-06
1.00E-07
1.00E-08
1.00E-09
1.0E-01
1.0E+00
1.0E+01
1.0E+02
1.0E+03
Observation Interval [s]
Comments: For testing, the reference signal applied to the input of the clock must
have a stability level that is at least 10 times better than the above output
requirement.
OSA 5565 User Manual Revision A
April 2010
11-36
Pre-defined Templates
11.13.3 SEC Option 2 at Constant Temperature
11.13.3.1
Expressed as MTIE
Standard: Draft ITU-T Recommendation G.813 (08/96)
File name: WANDER GENERATION SEC 2 G813.mti
Object to which the specification applies: SDH Equipment Slave Clock (SEC)
Option 2
Specified quantity and measurement conditions: The wander at the output of an
SDH Equipment Slave Clock Option 2 must meet this mask when the input is
connected to an ideal reference signal and when the ambient temperature is
constant (+ 1 K).
Mathematical description (as specified in the standard):
MTIE [ns]
20
20 τ0.48
60
Observation Interval [s]
0.1 < τ < 1
1 < τ < 10
10 < τ < 1000
Template (circles = points stored in the WinSTS template file):
MTIE [s]
1.00E-06
1.00E-07
1.00E-08
1.00E-09
1.0E-01
1.0E+00
1.0E+01
1.0E+02
1.0E+03
Observation Interval [s]
Comments: For testing, the reference signal applied to the input of the clock must
have a stability level that is at least 10 times better than the above output
requirement.
OSA 5565 User Manual Revision A
April 2010
11-37
Pre-defined Templates
11.13.3.2
Expressed as TDEV
Standard: Draft ITU-T Recommendation G.813 (08/96)
File name: WANDER GENERATION SEC 2 G813.tdv
Object to which the specification applies: SDH Equipment Slave Clock (SEC)
Option 2
Specified quantity and measurement conditions: The wander at the output of an
SDH Equipment Slave Clock Option 2 must meet this mask when the input is
connected to an ideal reference signal and when the ambient temperature is
constant (+ 1 K).
Mathematical description (as specified in the standard):
TDEV [ns]
3.2 τ-0.5
2
0.32 τ0.5
10
Observation Interval [s]
0.1 < τ < 2.5
2.5 < τ < 40
40 < τ < 1000
1000 < τ < 10 000
Template (circles = points stored in the WinSTS template file):
TDEV [s]
1.00E-07
1.00E-08
1.00E-09
1.00E-10
1.0E-01
1.0E+00
1.0E+01
1.0E+02
1.0E+03
1.0E+04
Observation Interval [s]
Comments: For testing, the reference signal applied to the input of the clock must
have a stability level that is at least 10 times better than the above output
requirement.
OSA 5565 User Manual Revision A
April 2010
11-38
Pre-defined Templates
11.14 Noise Transfer for SEC
11.14.1 SEC Option 2 Expressed as TDEV
Standard: ITU-T Recommendation G.813 (08/96)
File name: NOISE TRANSFER SEC 2 G813.mti
Object to which the specification applies: SDH Equipment Slave Clock (SEC)
Option 2
Specified quantity and measurement conditions: The wander at the output of an
SDH Equipment Slave Clock Option 2 must meet this mask when the input reference
has a TDEV that is equal to the Wander Tolerance specification.
Mathematical description (as specified in the standard):
TDEV [ns]
10
5.77 τ
31.63 τ0.5
Observation Interval [s]
0.1 < τ < 1.7
1.7 < τ < 30
30 < τ < 1000
Template (circles = points stored in the WinSTS template file):
TDEV [s]
1.00E-06
1.00E-07
1.00E-08
1.00E-09
1.0E-01
1.0E+00
1.0E+01
1.0E+02
1.0E+03
1.0E+04
Observation Interval [s]
Comments: Wander Tolerance (TDEV) for SSU Type I in Draft ITU-T Rec. G.812
(09/97):
TDEV [ns]
17
5.77 τ
31.63 τ0.5
OSA 5565 User Manual Revision A
Observation Interval [s]
0.05 < τ < 3
3 < τ < 30
30 < τ < 1000
April 2010
11-39
Pre-defined Templates
11.15 Short-term Phase Transient Response for SEC
11.15.1 SEC Option 2 Expressed as MTIE
Standard: ITU-T Recommendation G.813 (08/96)
File name: SHORT TRANSIENT SEC 2 G813.mti
Object to which the specification applies: SDH Equipment Slave Clock (SEC)
Option 2
Specified quantity and measurementcConditions: The phase transient response at
the output of an SDH Equipment Slave Clock Option 2 must meet this mask when
the currently selected input reference is lost and a second reference, traceable to
the same reference clock, is selected instead.
Mathematical description (as specified in the standard):
MTIE
Not specified
7.6 + 885 τ
300 + 300 τ
1000
Observation Interval
τ < 0.014
0.014 < τ < 0.5
0.5 < τ < 2.33
τ > 2.33
Template (circles = points stored in the WinSTS template file):
MTIE [s]
1.00E-05
1.00E-06
1.00E-07
1.00E-08
1.0E-02
1.0E-01
1.0E+00
1.0E+01
Observation Interval [s]
Comments:
OSA 5565 User Manual Revision A
April 2010
11-40
Pre-defined Templates
11.16 Long-term Phase Transient Response
(holdover) for SEC
11.16.1 SEC Option 2 Expressed as MTIE
Standard: ITU-T Recommendation G.813 (08/96)
File name: HOLDOVER TRANSIENT SEC 2 G813.mti
Object to which the specification applies: SDH Equipment Slave Clock (SEC) Option
2
Specified quantity and measurement conditions: The phase transient response of an
SDH Equipment Slave Clock Option 2 occuring upon entry into holdover mode must
meet this mask.
Mathematical description (as specified in the standard):
MTIE [ns]
Not specified
7.6 + 885 τ
300 + 300 τ
884 + 50 τ
Not specified
Observation Interval [s]
τ < 0.014
0.014 < τ < 0.5
0.5 < τ < 2.33
2.33 < τ < 64
τ > 64
Template (circles = points stored in the WinSTS template file):
MTIE [s]
1.00E-05
1.00E-06
1.00E-07
1.00E-08
1.0E-02
1.0E-01
1.0E+00
1.0E+01
1.0E+02
Observation Interval [s]
Comments: Besides meeting this MTIE mask, the long-term phase transient
response (holdover) of a SEC Option 2 must also comply with the following
specifications (at constant temperature):
• Initial fractional frequency offset in the first minute after the first 64 s < 0.05
ppm
•
Frequency drift < 5.8E-6 ppm/s
OSA 5565 User Manual Revision A
April 2010
11-41
Pre-defined Templates
This page has been intentionally left blank
OSA 5565 User Manual Revision A
April 2010
11-42
Application Note
Chapter
12 Application Note
Including :
Introduction
Formulas
Equipment Noise Measurement
Measurement Data Interpretation
Measurement Samples
OSA 5565 User Manual Revision A
April 2010
12-1
Application Note
This page has been intentionally left blank
OSA 5565 User Manual Revision A
April 2010
12-2
Application Note
12.1 Introduction
Evaluating Measurement Data to Determine the Effect of Different
Noise Sources Generated by Clock Signals
The Synchronisation Test Set (STS), OSA model 5565, performs phase measurements
(Time Interval Error) between an input signal and its internal high stability Rubidium
reference. Measurement resolution is 100 ps.
To facilitate the interpretation of the measurements, measurement data is processed by
the STS software and can be viewed using criteria specified by the industry standards MTIE, TDEV, ADEV, MADEV and frequency error.
A5 - Phase measurement module
A2
IN
TEX
or LR
AUX IN
INPUT
MUX
SYNTH.
80'080 Hz ± dF
80 Hz
± dF
COUNTER
EXT REF
G
Rb
REF
MUX
DIVIDER
MICROCONTROL
RS-232
PC with
WinSTS
software
80'000 Hz
A6
A4
Rb
REF
FREQUENCY
CHANGER
A3
OUTPUT
MODULE
OUT 1
OUT 2
REF OUT
Figure 12-1 : STS 5565 Block Diagram
OSA 5565 User Manual Revision A
April 2010
12-3
Application Note
12.2 Formulas
12.2.1 TIE (Time Interval Error)
xi = x(iτ0)
i
τ0
nτ0
TIE for time t = iτ0
measurement number i = 1, 2, ...,N
sampling time
observation period
12.2.2 MTIE (Maximum Time Interval Error)
⎡
⎤
MTIE(nτ 0 ) = max ⎢max x(i) − min x(i)⎥
1≤ k ≤N-n ⎣ k ≤ i≤k+n
k ≤ i≤k+n
⎦
12.2.3 ADEV (Allan DEViation)
ADEV(nτ 0 ) =
N-2n
1
(xi+2n − 2xi+n + xi ) 2
∑
2 2
2n τ 0 (N - 2n) i=1
12.2.4 MADEV or MDEV (Modified Allan DEViation)
MADEV(nτ 0 ) =
N -3n +1 ⎡n + j-1
⎤
1
⎢ ∑ (x i + 2n − 2x i + n + x i )⎥
∑
4 2
2n τ 0 ( N - 3n + 1) j=1 ⎣ i = j
⎦
2
12.2.5 TDEV (Time DEViation)
TDEV(n τ 0 ) =
N -3n +1 ⎡ n + j-1
⎤
1
⎢ ∑ (x i + 2n − 2x i + n + x i )⎥
∑
2
6n ( N - 3n + 1) j=1 ⎣ i = j
⎦
OSA 5565 User Manual Revision A
April 2010
2
12-4
Application Note
12.3 Equipment Noise Measurement
The goal of these measurements is to determine the effect of the different sources of
noise generated by the equipment.
As seen in the illustrations below, the measurements on both the input and output
interfaces are made against the same source - the equipment’s internal high stability
Rubidium.
12.3.1 Phase Measurement Module
AUX IN
STS
5565
REF OUT
12.3.2 Input Interface Unit
IN
STS
5565
REF OUT
12.3.3 Output Interface Uni
IN or AUX IN
STS
5565
OUT1 or OUT2
Note:
If the output is a framed signal, e.g. HDB3, the appropriate input
card must be fitted to the equipment, e.g. 2.048 Mbit/s Input
Interface Unit.
OSA 5565 User Manual Revision A
April 2010
12-5
Application Note
12.3.4 Evaluation
The results obtained from the measurements made above will determine the lower
measurement limit of the OSA 5565 Synchronisation Test Set.
It is thus important to take this limit into account when making measurements to
establish if the significance of these limits on the measurements.
A typical measurement of the equipment’s noise using the configuration in 4.1 is
given in the attached print-outs.
12.4 Measurement Data Interpretation
The reason for making measurements with the OSA 5565 is to determine the quality of
synchronisation references or to identify the factors that degrade a reference signal.
In an ideal case, comparison against masks defined by the industry standards and an
understanding of the system noise are sufficient criteria for acceptance of the
measurement results.
However, it is often the case that undesirable, measurable or pseudo-random, affect the
measurement and masks the normal behaviour of the sources or measured elements. It
is therefore useful to separate the different factors contributing to this and to determine
their cause.
The tables below show the relationship between the type of perturbation and its effect on
the relevant parameter, MTIE or TDEV.
x(t)
Initial phase offset xo
Initial frequency offset yo
Frequency ageing D
Phase jump Δx
Sinusoidal Phase Modulation Asin (2πnτ0/T)
White Phase Noise WPM
Phase Flicker Noise FPM
White frequency Noise WFM
Frequency Flicker Noise FFM
Frequency Random Walk RFM
MTIE (τ )
=0
= yo x τ
= D ( tmax x τ - τ2 / 2 )
= Δx for all values of τ > τ0
= 2 x A for τ > T / 2
Depends on the distribution of
the amplitude
Table 12-1 Perturbation Effects on MTIE
OSA 5565 User Manual Revision A
April 2010
12-6
Application Note
x(t)
Initial phase offset xo
Initial frequency offset yo
Frequency ageing D
Phase jump Δx
Sinusoidal Phase Modulation Asin (2πnτ0/T)
White Phase Noise WPM
Phase Flicker Noise FPM
White frequency Noise WFM
Frequency Flicker Noise FFM
Frequency Random Walk RFM
TDEV (τ )
=0
=0
= ( D / √ 6 ) x τ2
See simulation attached
See simulation attached
Proportional to τ-1/2
Proportional to τ0
Proportional to τ1/2
Proportional to τ1
Proportional to τ3/2
Table 12-2 Perturbation Effects on TDEV
x(t)
Initial phase offset xo
Initial frequency offset yo
Frequency ageing D
Phase jump Δx
Sinusoidal Phase Modulation Asin (2πnτ0/T)
White Phase Noise WPM
Phase Flicker Noise FPM
White frequency Noise WFM
Frequency Flicker Noise FFM
Frequency Random Walk RFM
ADEV (τ )
=0
=0
= ( D / √2 ) x τ
See simulation attached
See simulation attached
Proportional to τ-1
Proportional to τ-1
Proportional to τ-1/2
Proportional to τ0
Proportional to τ1/2
Table 12-3 Perturbation Effects on ADEV
x(t)
Initial phase offset xo
Initial frequency offset yo
Frequency ageing D
Phase jump Δx
Sinusoidal Phase Modulation Asin (2πnτ0/T)
White Phase Noise WPM
Phase Flicker Noise FPM
White frequency Noise WFM
Frequency Flicker Noise FFM
Frequency Random Walk RFM
MADEV (τ )
=0
=0
= ( D / √2 ) x τ
See simulation attached
See simulation attached
Proportional to τ-3/2
Proportional to τ-1
Proportional to τ-1/2
Proportional to τ0
Proportional to τ1/2
Table 12-4 Perturbation Effects on MADEV
OSA 5565 User Manual Revision A
April 2010
12-7
Application Note
12.5 Measurement Samples
The following graphs represent the result of various simulations made from acquisitions
of 2000 points.
The comparison of the simple cases shows the theoretical behaviour described in the
above tables as well as the influence of the measurable events.
OSA 5565 User Manual Revision A
April 2010
12-8
Application Note
12.5.1 System Noise (TIE)
Measurement: 10000 x 12.5 milliseconds
Comments:
input AUX from REFOUT
Figure 12-2 : System Noise (TIE)
OSA 5565 User Manual Revision A April 2010
12-9
Application Note
12.5.2 System Noise (MTIE)
Measurement: 10000 x 12.5 milliseconds
Comments:
input AUX from REFOUT
Figure 12-3 : System Noise (MTIE)
OSA 5565 User Manual Revision A
April 2010
12-10
Application Note
12.5.3 System Noise (MADEV)
Measurement: 10000 x 12.5 milliseconds
Comments:
input AUX from REFOUT
Figure 12-4 : System Noise (MADEV) Sample
OSA 5565 User Manual Revision A
April 2010
12-11
Application Note
12.5.4 System Noise (TDEV)
Measurement: 10000 x 12.5 milliseconds
Comments:
input AUX from REFOUT
Figure 12-5 : System Noise (TDEV)
OSA 5565 User Manual Revision A
April 2010
12-12
Application Note
12.5.5 System Noise (ADEV)
Measurement: 10000 x 12.5 milliseconds
Comments:
input AUX from REFOUT
Figure 12-6 : System Noise (ADEV)
OSA 5565 User Manual Revision A
April 2010
12-13
Application Note
12.5.6 White Phase Modulation (TIE)
Measurement: 2000 x 1 second(s)
Comments:
simulated
5e-08
4e-08
3e-08
TIE [s]
2e-08
1e-08
0
-1e-08
-2e-08
-3e-08
-4e-08
0
200
400
600
800
1000
1200
1400
1600
Time [s]
Figure 12-7 : White Phase Modulation (TIE)
OSA 5565 User Manual Revision A
April 2010
12-14
1800
2000
Application Note
12.5.7 White Phase Modulation (MTIE)
Measurement: 2000 x 1 second(s)
Comments:
simulated
1e-06
MTIE [s]
1e-07
1e-08
1e-09
10
1
100
1000
Tau [s]
Figure 12-8 : White Phase Modulation (TIE)
OSA 5565 User Manual Revision A
April 2010
12-15
Application Note
12.5.8 White Phase Modulation (MADEV)
Measurement: 2000 x 1 second(s)
Comments:
simulated
1e-07
1e-08
MADEV
1e-09
1e-10
1e-11
1e-12
1e-13
1
10
1000
100
Tau [s]
Figure 12-9 : White Phase Modulation (MADEV)
OSA 5565 User Manual Revision A
April 2010
12-16
Application Note
12.5.9 White Phase Modulation (TDEV)
Measurement: 2000 x 1 second(s)
Comments:
simulated
1e-07
TDEV
1e-08
1e-09
1e-10
1
10
100
1000
Tau [s]
Figure 12-10 : White Phase Modulation (TDEV)
OSA 5565 User Manual Revision A
April 2010
12-17
Application Note
12.5.10 White Phase Modulation (ADEV)
Measurement: 2000 x 1 second(s)
Comments:
simulated
1e-07
ADEV
1e-08
1e-09
1e-10
1e-11
1
10
100
1000
Tau [s]
Figure 12-11 : White Phase Modulation (ADEV)
OSA 5565 User Manual Revision A
April 2010
12-18
Application Note
12.5.11 Flicker Phase Modulation (TIE)
Measurement: 2000 x 1 second(s)
Comments:
simulated
8e-08
7e-08
6e-08
5e-08
TIE [s]
4e-08
3e-08
2e-08
1e-08
0
-1e-08
-2e-08
-3e-08
-4e-08
0
200
400
600
800
1000
1200
1400
1600
Time [s]
Figure 12-12 : Flicker Phase Modulation (TIE)
OSA 5565 User Manual Revision A
April 2010
12-19
1800
2000
Application Note
12.5.12 Flicker Phase Modulation (MTIE)
Measurement: 2000 x 1 second(s)
Comments:
simulated
1e-06
MTIE [s]
1e-07
1e-08
1e-09
1
10
100
1000
Tau [s]
Figure 12-13 : Flicker Phase Modulation (MTIE)
OSA 5565 User Manual Revision A
April 2010
12-20
Application Note
12.5.13 Flicker Phase Modulation (MADEV)
Measurement: 2000 x 1 second(s)
Comments:
simulated
1e-07
MADEV
1e-08
1e-09
1e-10
1e-11
1e-12
1
10
100
1000
Tau [s]
Figure 12-14 : Flicker Phase Modulation (MADEV)
OSA 5565 User Manual Revision A
April 2010
12-21
Application Note
12.5.14 Flicker Phase Modulation (TDEV)
Measurement: 2000 x 1 second(s)
Comments:
simulated
1e-07
TDEV
1e-08
1e-09
1e-10
1
10
100
1000
Tau [s]
Figure 12-15 : Flicker Phase Modulation (TDEV)
OSA 5565 User Manual Revision A
April 2010
12-22
Application Note
12.5.15 Flicker Phase Modulation (ADEV)
Measurement: 2000 x 1 second(s)
Comments:
simulated
1e-07
ADEV
1e-08
1e-09
1e-10
1e-11
1
10
100
1000
Tau [s]
Figure 12-16 : Flicker Phase Modulation (ADEV)
OSA 5565 User Manual Revision A
April 2010
12-23
Application Note
12.5.16 White Frequency Modulation (TIE)
Measurement: 2000 x 1 second(s)
Comments:
simulated
6e-07
5.5e-07
5e-07
4.5e-07
TIE [s]
4e-07
3.5e-07
3e-07
2.5e-07
2e-07
1.5e-07
1e-07
5e-08
0
0
200
400
600
800
1000
1200
1400
1600
Time [s]
Figure 12-17 : White Frequency Modulation (TIE)
OSA 5565 User Manual Revision A
April 2010
12-24
1800
2000
Application Note
12.5.17 White Frequency Modulation (MTIE)
Measurement: 2000 x 1 second(s)
Comments:
simulated
1e-06
MTIE [s]
1e-07
1e-08
1e-09
1
10
100
1000
Tau [s]
Figure 12-18 : White Frequency Modulation (MTIE)
OSA 5565 User Manual Revision A
April 2010
12-25
Application Note
12.5.18 White Frequency Modulation (MADEV)
Measurement: 2000 x 1 second(s)
Comments:
simulated
1e-07
MADEV
1e-08
1e-09
1e-10
1e-11
1
10
100
1000
Tau [s]
Figure 12-19 : White Frequency Modulation (MADEV)
OSA 5565 User Manual Revision A
April 2010
12-26
Application Note
12.5.19 White Frequency Modulation (TDEV)
Measurement: 2000 x 1 second(s)
Comments:
simulated
TDEV
1e-07
1e-08
1e-09
1
10
100
1000
Tau [s]
Figure 12-20 : White Frequency Modulation (TDEV)
OSA 5565 User Manual Revision A
April 2010
12-27
Application Note
12.5.20 White Frequency Modulation (ADEV)
Measurement: 2000 x 1 second(s)
Comments:
simulated
1e-07
ADEV
1e-08
1e-09
1e-10
1e-11
1
10
100
1000
Tau [s]
Figure 12-21 : White Frequency Modulation (ADEV)
OSA 5565 User Manual Revision A
April 2010
12-28
Application Note
12.5.21 Flicker Frequency Modulation (TIE)
Measurement: 2000 x 1 second(s)
Comments:
simulated
4e-06
3.5e-06
3e-06
2.5e-06
TIE [s]
2e-06
1.5e-06
1e-06
5e-07
0
-5e-07
-1e-06
-1.5e-06
-2e-06
0
200
400
600
800
1000
1200
1400
1600
Time [s]
Figure 12-22 : Flicker Frequency Modulation (TIE)
OSA 5565 User Manual Revision A
April 2010
12-29
1800
2000
Application Note
12.5.22 Flicker Frequency Modulation (MTIE)
Measurement: 2000 x 1 second(s)
Comments:
simulated
1e-05
MTIE [s]
1e-06
1e-07
1e-08
1
10
100
1000
Tau [s]
Figure 12-23 : Flicker Frequency Modulation (MTIE)
OSA 5565 User Manual Revision A
April 2010
12-30
Application Note
12.5.23 Flicker Frequency Modulation (MADEV)
Measurement: 2000 x 1 second(s)
Comments:
simulated
1e-07
MADEV
1e-08
1e-09
1e-10
1
10
100
1000
Tau [s]
Figure 12-24 : Flicker Frequency Modulation (MADEV)
OSA 5565 User Manual Revision A
April 2010
12-31
Application Note
12.5.24 Flicker Frequency Modulation (TDEV)
Measurement: 2000 x 1 second(s)
Comments:
simulated
1e-05
TDEV
1e-06
1e-07
1e-08
1e-09
10
1
100
1000
Tau [s]
Figure 12-25 : Flicker Frequency Modulation (TIE)
OSA 5565 User Manual Revision A
April 2010
12-32
Application Note
12.5.25 Flicker Frequency Modulation (ADEV)
Measurement: 2000 x 1 second(s)
Comments:
simulated
1e-07
ADEV
1e-08
1e-09
1e-10
1
10
100
1000
Tau [s]
Figure 12-26 : Flicker Frequency Modulation (ADEV)
OSA 5565 User Manual Revision A
April 2010
12-33
Application Note
12.5.26 Random Walk Frequency Modulation (TIE)
Measurement: 2000 x 1 second(s)
Comments:
simulated
2e-04
1.8e-04
1.6e-04
1.4e-04
1.2e-04
TIE [s]
1e-04
8e-05
6e-05
4e-05
2e-05
0
-2e-05
-4e-05
-6e-05
-8e-05
-1e-04
0
200
400
600
800
1000
1200
1400
1600
Time [s]
Figure 12-27 : Random Walk Frequency Modulation (TIE)
OSA 5565 User Manual Revision A
April 2010
12-34
1800
2000
Application Note
12.5.27 Random Walk Frequency Modulation (MTIE)
Measurement: 2000 x 1 second(s)
Comments:
simulated
1e-03
MTIE [s]
1e-04
1e-05
1e-06
1e-07
1
10
100
1000
Tau [s]
Figure 12-28 : Random Walk Frequency Modulation (MTIE)
OSA 5565 User Manual Revision A
April 2010
12-35
Application Note
12.5.28 Random Walk Frequency Modulation (MADEV)
Measurement: 2000 x 1 second(s)
Comments:
simulated
1e-06
MADEV
1e-07
1e-08
1e-09
1e-10
1
10
1000
100
Tau [s]
Figure 12-29 : Random Walk Frequency Modulation (MADEV)
OSA 5565 User Manual Revision A
April 2010
12-36
Application Note
12.5.29 Random Walk Frequency Modulation (TDEV)
Measurement: 2000 x 1 second(s)
Comments:
simulated
1e-04
TDEV
1e-05
1e-06
1e-07
1e-08
1e-09
10
1
100
1000
Tau [s]
Figure 12-30 : Random Walk Frequency Modulation (TDEV)
OSA 5565 User Manual Revision A
April 2010
12-37
Application Note
12.5.30 Random Walk Frequency Modulation (ADEV)
Measurement: 2000 x 1 second(s)
Comments:
simulated
1e-06
ADEV
1e-07
1e-08
1e-09
1e-10
1
10
1000
100
Tau [s]
Figure 12-31 : Random Walk Frequency Modulation (ADEV)
OSA 5565 User Manual Revision A
April 2010
12-38
Application Note
12.5.31 White Phase Modulation + Jump 100 ns (TIE)
Measurement: 2000 x 1 second(s)
Comments:
simulated
2e-07
1.8e-07
1.6e-07
1.4e-07
1.2e-07
TIE [s]
1e-07
8e-08
6e-08
4e-08
2e-08
0
-2e-08
-4e-08
-6e-08
-8e-08
-1e-07
0
200
400
600
800
1000
1200
1400
1600
Time [s]
Figure 12-32 : White Phase Modulation + Jump 100 ns (TIE)
OSA 5565 User Manual Revision A
April 2010
12-39
1800
2000
Application Note
12.5.32 White Phase Modulation + Jump 100 ns (MTIE)
Measurement: 2000 x 1 second(s)
Comments:
simulated
MTIE [s]
1e-06
1e-07
1e-08
1
10
1000
100
Tau [s]
Figure 12-33 : White Phase Modulation + Jump 100 ns (MTIE)
OSA 5565 User Manual Revision A
April 2010
12-40
Application Note
12.5.33 White Phase Modulation + Jump 100 ns (MADEV)
Measurement: 2000 x 1 second(s)
Comments:
simulated
1e-07
MADEV
1e-08
1e-09
1e-10
1e-11
1
10
1000
100
Tau [s]
Figure 12-34 : White Phase Modulation + Jump 100 ns (MADEV)
OSA 5565 User Manual Revision A
April 2010
12-41
Application Note
12.5.34 White Phase Modulation + Jump 100 ns (TDEV)
Measurement: 2000 x 1 second(s)
Comments:
simulated
1e-06
TDEV
1e-07
1e-08
1e-09
1e-10
1
10
1000
100
Tau [s]
Figure 12-35 : White Phase Modulation + Jump 100 ns (TDEV)
OSA 5565 User Manual Revision A
April 2010
12-42
Application Note
12.5.35 White Phase Modulation + Jump 100 ns (ADEV)
Measurement: 2000 x 1 second(s)
Comments:
simulated
1e-07
ADEV
1e-08
1e-09
1e-10
1e-11
1
10
1000
100
Tau [s]
Figure 12-36 : White Phase Modulation + Jump 100 ns (ADEV)
OSA 5565 User Manual Revision A
April 2010
12-43
Application Note
12.5.36 White Phase Modulation + Frequency Offset 1e-9 (TIE)
Measurement: 2000 x 1 second(s)
Comments:
simulated
2e-06
TIE [s]
1.5e-06
1e-06
5e-07
0
-5e-07
0
200
400
600
800
1000
1200
1400
1600
Time [s]
Figure 12-37 : White Phase Modulation + Frequency Offset 1e-9 (TIE)
OSA 5565 User Manual Revision A
April 2010
12-44
1800
2000
Application Note
12.5.37 White Phase Modulation + Frequency Offset 1e-9 (MTIE)
Measurement: 2000 x 1 second(s)
Comments:
simulated
MTIE [s]
1e-06
1e-07
1e-08
10
1
100
1000
Tau [s]
Figure 12-38 : White Phase Modulation + Frequency Offset 1e-9 (MTIE)
OSA 5565 User Manual Revision A
April 2010
12-45
Application Note
12.5.38 White Phase Modulation + Frequency Drift 8.64e-8/day (TIE)
Measurement: 2000 x 1 second(s)
Comments:
simulated
2e-06
TIE [s]
1.5e-06
1e-06
5e-07
0
-5e-07
0
200
400
600
800
1000
1200
1400
1600
Time [s]
Figure 12-39 : White Phase Modulation + Frequency Drift 8.64e-8/day (TIE)
OSA 5565 User Manual Revision A
April 2010
12-46
1800
2000
Application Note
12.5.39 White Phase Modulation + Frequency Drift 8.64e-8/day (MTIE)
Measurement: 2000 x 1 second(s)
Comments:
simulated
1e-05
MTIE [s]
1e-06
1e-07
1e-08
1e-09
10
1
100
1000
Tau [s]
Figure 12-40 : White Phase Modulation + Frequency Drift 8.64e-8/day (MTIE)
OSA 5565 User Manual Revision A
April 2010
12-47
Application Note
12.5.40 White Phase Modulation + Frequency Drift 8.64e-8/day (MADEV)
Measurement: 2000 x 1 second(s)
Comments:
simulated
1e-07
MADEV
1e-08
1e-09
1e-10
1e-11
1
10
1000
100
Tau [s]
Figure 12-41 : White Phase Modulation + Frequency Drift 8.64e-8/day (MADEV)
OSA 5565 User Manual Revision A
April 2010
12-48
Application Note
12.5.41 White Phase Modulation + Frequency Drift 8.64e-8/day (TDEV)
Measurement: 2000 x 1 second(s)
Comments:
simulated
1e-06
TDEV
1e-07
1e-08
1e-09
1e-10
1
10
1000
100
Tau [s]
Figure 12-42 : White Phase Modulation + Frequency Drift 8.64e-8/day (TDEV)
OSA 5565 User Manual Revision A
April 2010
12-49
Application Note
12.5.42 White Phase Modulation + Frequency Drift 8.64e-8/day (ADEV)
Measurement: 2000 x 1 second(s)
Comments:
simulated
1e-07
ADEV
1e-08
1e-09
1e-10
1e-11
1
10
1000
100
Tau [s]
Figure 12-43 : White Phase Modulation + Frequency Drift 8.64e-8/day (ADEV)
OSA 5565 User Manual Revision A
April 2010
12-50
Application Note
12.5.43 White Phase Modulation + Phase Modulation 1e-8 sin (pi*t/100) (TIE)
Measurement: 2000 x 1 second(s)
Comments:
simulated
5e-08
4e-08
3e-08
TIE [s]
2e-08
1e-08
0
-1e-08
-2e-08
-3e-08
-4e-08
0
200
400
600
800
1000
1200
1400
1600
Time [s]
Figure 12-44 : White Phase Modulation + Phase Modulation 1e-8sin(pi*t/100) (TIE)
OSA 5565 User Manual Revision A
April 2010
12-51
1800
2000
Application Note
12.5.44 White Phase Modulation + Phase Modulation 1e-8 sin (pi*t/100) (MTIE)
Measurement: 2000 x 1 second(s)
Comments:
simulated
1e-06
MTIE [s]
1e-07
1e-08
1e-09
1
10
1000
100
Tau [s]
Figure 12-45 : White Phase Modulation + Phase Modulation 1e-8sin(pi*t/100) (MTIE)
OSA 5565 User Manual Revision A
April 2010
12-52
Application Note
12.5.45 White Phase Modulation + Phase Modulation 1e-8 sin (pi*t/100) (MADEV)
Measurement: 2000 x 1 second(s)
Comments:
simulated
1e-07
1e-08
MADEV
1e-09
1e-10
1e-11
1e-12
1e-13
10
1
100
1000
Tau [s]
Figure 12-46 : White Phase Modulation + Phase Modulation 1e-8sin(pi*t/100) (MADEV)
OSA 5565 User Manual Revision A
April 2010
12-53
Application Note
12.5.46 White Phase Modulation + Phase Modulation 1e-8 sin (pi*t/100) (TDEV)
Measurement: 2000 x 1 second(s)
Comments:
simulated
1e-07
TDEV
1e-08
1e-09
1e-10
10
1
100
1000
Tau [s]
Figure 12-47 : White Phase Modulation + Phase Modulation 1e-8sin(pi*t/100) (TDEV)
OSA 5565 User Manual Revision A
April 2010
12-54
Application Note
12.5.47 White Phase Modulation + Phase Modulation 1e-8 sin (pi*t/100) (ADEV)
Measurement: 2000 x 1 second(s)
Comments:
simulated
1e-07
ADEV
1e-08
1e-09
1e-10
1e-11
1
10
1000
100
Tau [s]
Figure 12-48 : White Phase Modulation + Phase Modulation 1e-8sin(pi*t/100) (ADEV)
OSA 5565 User Manual Revision A
April 2010
12-55
Application Note
12.5.48 White Phase Modulation + Phase Modulation 1e-8 sin (pi*t/64) (TIE)
Measurement: 2000 x 1 second(s)
Comments: simulated
5e-08
4e-08
3e-08
TIE [s]
2e-08
1e-08
0
-1e-08
-2e-08
-3e-08
-4e-08
0
200
400
600
800
1000
1200
1400
1600
Time [s]
Figure 12-49 : White Phase Modulation + Phase Modulation 1e-8sin(pi*t/64) (TIE)
OSA 5565 User Manual Revision A
April 2010
12-56
1800
2000
Application Note
12.5.49 White Phase Modulation + Phase Modulation 1e-8 sin (pi*t/64) (MTIE)
Measurement: 2000 x 1 second(s)
Comments:
simulated
1e-06
MTIE [s]
1e-07
1e-08
1e-09
10
1
100
1000
Tau [s]
Figure 12-50 : White Phase Modulation + Phase Modulation 1e-8sin(pi*t/64) (MTIE)
OSA 5565 User Manual Revision A
April 2010
12-57
Application Note
12.5.50 White Phase Modulation + Phase Modulation 1e-8 sin (pi*t/64) (MADEV)
Measurement: 2000 x 1 second(s)
Comments:
simulated
1e-07
1e-08
MADEV
1e-09
1e-10
1e-11
1e-12
1e-13
1
10
100
1000
Tau [s]
Figure 12-51 : White Phase Modulation + Phase Modulation 1e-8sin(pi*t/64) (MADEV)
OSA 5565 User Manual Revision A
April 2010
12-58
Application Note
12.5.51 White Phase Modulation + Phase Modulation 1e-8 sin (pi*t/64) (TDEV)
Measurement: 2000 x 1 second(s)
Comments:
simulated
1e-07
TDEV
1e-08
1e-09
1e-10
10
1
100
1000
Tau [s]
Figure 12-52 : White Phase Modulation + Phase Modulation 1e-8sin(pi*t/64) (TDEV)
OSA 5565 User Manual Revision A
April 2010
12-59
Application Note
12.5.52 White Phase Modulation + Phase Modulation 1e-8 sin (pi*t/64) (ADEV)
Measurement: 2000 x 1 second(s)
Comments:
simulated
1e-07
ADEV
1e-08
1e-09
1e-10
1e-11
1
10
1000
100
Tau [s]
Figure 12-53 : White Phase Modulation + Phase Modulation 1e-8sin(pi*t/64) (ADEV)
OSA 5565 User Manual Revision A
April 2010
12-60
Ordering Information
Appendix A:
Ordering Information
The following tables contain the article and drawing numbers for ordering spare and replacement
components, as well as accessories for the OSA 5565 STS. Please use both numbers and
description when placing your order. To contact Oscilloquartz, refer to section 9.3
Cards
Comp.
Description
Article
number
Drawing number
IIU-2/M ESF
Input Interface 1.544 Mbit/s B8ZS/ESF
A014298
942.085.066
IIU-2/M D4
Input Interface 1.544 Mbit/s AMI/D4(SF)
A014299
942.085.066
IIU-6/M
Input Interface 2.048 Mbit/s HDB3/CAS
A013417
942.085.068
IIU-10/M
Input Interface 2.048 MHz
A013420
942.085.075.01
Rb INT
Rubidium Interface
A011232
942.085.030
PMU
Phase Measurement Module
A006013
942.085.330
Freq Conv.
Frequency Converter
A006088
942.085.946.50
MAC
Alarm Card
A006025
942.085.516.01
Table 12-5 Ordering Cards
Accessories & Options
Topic
Description
Article
number
Drawing number
DOC
User Manual & WinSTS on CD-ROM
User Manual - Printed Version
A012341
A012680
DOC.556.500
990.512.301
Accessory Kit For AC Power Supply
A011548
942.089.907
Carrying Bag
A011350
981.803.420
Safe travelling bag for transporting STS
Table 12-6 Ordering Accessories & Options
OSA 5565 User Manual Revision A
April 2010
A-1
Ordering Information
This page has been intentionally left blank
OSA 5565 User Manual Revision A
April 2010
A-2
Document History
Document History
Project N°
Document Type
Version
Author
Revision
Last Up-date
Creation
:
:
:
:
:
:
:
5565-xx
User Manual
English
OSA/MUTH
A
25.04.2010
25.04.2010
REVISION
DATE
A
25.04.2010
OSA 5565 User Manual Revision A
CORRECTIONS
- Creation based on WinSTS 2.2x
April 2010
I