1
NovoLiq User's Manual
NovoLiq User's Manual
Table of Contents
1. About ...................................................................................................................................................................... 3
2. References .............................................................................................................................................................. 4
3. License Agreement ................................................................................................................................................. 5
4. Contents ................................................................................................................................................................. 7
4.1 Introduction...................................................................................................................................................... 7
4.2 Changing Units System ..................................................................................................................................... 7
4.3 Data Entry ......................................................................................................................................................... 7
4.4 Loading Effect (Optional) ................................................................................................................................ 10
4.5 Schematic Soil Profile ..................................................................................................................................... 11
4.6 Seismic Info .................................................................................................................................................... 11
4.7 Working with Charts ....................................................................................................................................... 14
4.8 Analysis Results .............................................................................................................................................. 15
4.9 Reporting ........................................................................................................................................................ 16
4.10 Import / Export ............................................................................................................................................. 16
4.10.1 Import from Text Files ........................................................................................................................... 16
4.10.2 Import from gINT Files ........................................................................................................................... 17
4.10.3 Export to Graphic Format ...................................................................................................................... 17
4.11 Preferences .................................................................................................................................................. 18
5. Theory .................................................................................................................................................................. 21
5.1 Introduction.................................................................................................................................................... 21
5.2 Cyclic Stress Ratio (CSR) .................................................................................................................................. 22
5.3 Stress Reduction Factor (rd) ........................................................................................................................... 22
5.4 Magnitude Scaling Factor (MSF) ..................................................................................................................... 23
5.5 Structure Loading Effect ................................................................................................................................. 23
5.6 Probability of Liquefaction ............................................................................................................................. 24
5.7 Cyclic Resistance Ratio.................................................................................................................................... 25
5.7.1 SPT-Based CRR ......................................................................................................................................... 25
5.7.2 BDT-Based CRR ........................................................................................................................................ 29
5.7.3 Vs-Based CRR ........................................................................................................................................... 30
5.8 Post-Liquefaction ............................................................................................................................................ 33
5.8.1 Lateral Displacements ............................................................................................................................. 33
1
NovoLiq User's Manual
5.8.2 Reconsolidation Settlement .................................................................................................................... 36
5.8.3 How depth interval is calculated?............................................................................................................ 37
6. Online ................................................................................................................................................................... 40
6.1 Novo Tech Software website .......................................................................................................................... 40
6.2 Our other programs ........................................................................................................................................ 40
6.3 Updates .......................................................................................................................................................... 40
6.4 Contact us ....................................................................................................................................................... 40
2
NovoLiq User's Manual
1. About
Software :
NovoLIQ
First Release : September 2009
Licensing Model : License File, On-demand
Production Team : Programming: Alireza Afkhami (M.A.Sc, M.C.P, P.Eng)
Help Translation to Spanish: Ricardo Segovia (B.Sc)
Similar Program : NovoCPT
Updates : click to open
Disclaimer : click to read(See 3.)
NovoLiq software is designed for soil liquefaction analysis during earthquake and supports multilayer as well as single layer stratigraphy. The results of the analysis are presented as:
•Safety Factor Against Soil Liquefaction
•Probability of Soil Liquefaction
•Post-liquefaction Site Condition Including:
•Ground Settlement
•Lateral Movement (Spreading)
•Residual Strength
Please keep your software up-to-date by visiting the program's web page.
Although all efforts have been undertaken to ensure that this software is of the highest possible
quality and that the results obtained are correct, the authors do not warrant the functions contained
in the program will meet your requirements or that the operation of the program will be
uninterrupted or error-free. The authors are not responsible and assume no liability for any results
or any use made thereof, nor for any damages or litigation that may result from the use of the
software for any purpose. All results to be verified independently by user.
4188 Hoskins Road,
North Vancouver, BC, Canada
3
NovoLiq User's Manual
2. References
1- NCEER Workshop Report (1997)
2- Geotechnical Design Guidelines for Buildings on Liquefiable Sites in Accordance with NBC 2005 for
Greater Vancouver Region, Canada, 2007
3- Estimating Liquefaction-Induced Lateral Displacements Using the Standard Penetration Test or
Cone Penetration Test
G. Zhang; P. K. Robertson, M.ASCE; and R. W. I. Brachman, 2004
4- State Normalization of Penetration Resistance and the Effect of Overburden Stress on Liquefaction
Resistance
R. W. Boulanger, I. M. Idriss, 2004
5- A Liquefaction Evaluation Procedure Based on Shear Wave Velocity
Ronald D. Andrus, Kenneth H. Stokoe
6- Earthquake-Induced Settlements in Saturated Sandy Soils
C. Y. Lee, 2007
7- Standard Penetration Test-Based Probabilistic and Deterministic Assessment of Seismic Soil
Liquefaction Potential
K. Onder Cetin, M.ASCE; Raymond B. Seed, M.ASCE; Armen Der Kiureghian, M.ASCE; Kohji
Tokimatsu; Leslie F. Harder Jr., M.ASCE; Robert E. Kayen, M.ASCE ; and Robert E. S. Moss, M.ASCE
8- Soil Liquefaction During Earthquake
I.M. Idriss, R.W. Boulanger
9- Revised Multilinear Regression Equations for Prediction of Lateral Spread Displacement
T. Leslie Youd, Corbett M. Hansen, Steven F. Bartlett
10- Guidelines on Foundation Loading and Deformation Due to Liquefaction Induced Lateral
Spreading
DOT (February 2011)
4
NovoLiq User's Manual
3. License Agreement
PLEASE READ THIS END USER LICENSE AGREEMENT ("EULA") CAREFULLY BEFORE DOWNLOADING
OR USING THE SOFTWARE. BY DOWNLOADING THE SOFTWARE, OR USING THE SOFTWARE, YOU
ARE CONSENTING TO BE BOUND BY THIS AGREEMENT. IF YOU DO NOT AGREE TO ALL OF THE
TERMS OF THIS AGREEMENT DO NOT DOWNLOAD AND/OR USE THE SOFTWARE.
The Product is Copyright © 2008-2012 “NOVO TECH SOFTWARE”. You may use it and distribute it
according to this following License Agreement. If you do not agree with these terms, please remove
the Product from your system. By incorporating the Product in your work or distributing the Product
to
others
you
implicitly
agree
to
these
license
terms.
1.
DEFINITIONS
1.1. "NovoLIQ" or "Software" refers to “NOVO TECH SOFTWARE”’s program, in each case, supplied
by “NOVO TECH SOFTWARE” herewith, and corresponding documentation, associated media, and
online
or
electronic
documentation.
1.2. "Trial Version” means a free version of the Software for personal use only, so identified, to be
used in one computer only and for a period of 14 days. The Trial Version is fully functional with no
restrictions
compared
to
the
registered
version.
1.3. "Registered Version" means a version which has been bought from “NOVO TECH SOFTWARE”.
2. LIMITATION OF LIABILITY
Although all efforts have been undertaken to ensure that this software is of the highest possible
quality and that the results obtained are correct, the authors do not warrant the functions contained
in the program will meet your requirements or that the operation of the program will be
uninterrupted or error-free. The authors are not responsible and assume no liability for any results
or any use made thereof, nor for any damages or litigation that may result from the use of the
software for any purpose. All results to be verified independently by user.
In no event shall "NOVO TECH SOFTWARE" be liable for any damages (including, without limitation,
lost profits, business interruption, or lost information) rising out of 'Authorized Users' use of or
inability to use the NovoLIQ, even if "NOVO TECH SOFTWARE" has been advised of the possibility of
such damages. In no event will "NOVO TECH SOFTWARE" be liable for loss of data or for indirect,
special, incidental, consequential (including lost profit), or other damages based in contract, tort or
otherwise. "NOVO TECH SOFTWARE" shall have no liability with respect to the content of the
NovoLIQ or any part thereof, including but not limited to errors or omissions contained therein, libel,
infringements of rights of publicity, privacy, trademark rights, business interruption, personal injury,
loss
of
privacy,
moral
rights
or
the
disclosure
of
confidential
information.
3.
FOR
NovoLIQ
TRIAL
VERSION
(a) The NovoLIQ Trial version may be freely distributed, with exceptions noted below, provided the
distribution
package
is
not
modified
in
ANY
WAY.
(b) The NovoLIQ Trial version may not be distributed inside of any other software package without
written
permission
of
“NOVO
TECH
SOFTWARE”.
(c) The NovoLIQ Trial version allows the user to publish its work according to the license agreement,
but nor “NOVO TECH SOFTWARE” nor any member of the company can be held liable for the content
or
accuracy
of
the
publication.
(d) You may use the accompanying Product free of charge for a period of 14 days for the sole
purpose of evaluating the Product. If, after this period, you wish to continue using this Product, you
are required to purchase it. In other case, you are required to remove this Product, in its entirety,
from
all
computers
on
which
it
is
installed.
(e) You shall not use, copy, rent, lease, sell, modify, decompile, disassemble, otherwise reverse
engineer, or transfer the Product except as provided in this Agreement. Any such unauthorized use
shall
result
in
immediate
and
automatic
termination
of
this
Agreement.
5
NovoLiq User's Manual
4.
FOR
NovoLIQ
REGISTERED
VERSION
(a) You may install and use the Software on a single computer; OR install and store the Software on
a storage device, such as a network server, used only to install the Software on your other
computers over an internal network, provided you have a license for each separate computer on
which the Software is installed and run. A license for the Software may not be shared, installed or
used
concurrently
on
different
computers.
(b) The NovoLIQ Registered version allows the registered user to publish its work according to the
license agreement, but nor “NOVO TECH SOFTWARE” nor any member of the company can be held
liable
for
the
content
or
accuracy
of
the
publication.
(c) The NovoLIQ Registered version guaranties to the registered user free updates for a whole
version
cycle
and
for
12
(twelve)
months.
(d) You shall not use, copy, rent, lease, sell, modify, decompile, disassemble, otherwise reverse
engineer, or transfer the Product except as provided in this Agreement. Any such unauthorized use
shall
result
in
immediate
and
automatic
termination
of
this
Agreement.
(e) Once purchased, the Software may not be return to "NOVO TECH SOFTWARE". The price paid for
the
Software
is
not
refundable.
(f) The NovoLIQ license is issued for one computer based on the Hardware ID provided by user.
Each transfer of license to another computer, if approved by NOVO TECH SOFTWARE, will be subject
to
20
percent
charge
based
on
latest
NovoLIQ
price.
5.
TERMS
This license is effective until terminated. You may terminate it by destroying the program, the
documentation and copies thereof. This license will also terminate if you fail to comply with any
terms or conditions of this agreement. You agree upon such termination to destroy all copies of the
program
and
of
the
documentation,
or
return
them
to
the
author.
6.
OTHER
RIGHTS
AND
RESTRICTIONS
All other rights and restrictions not specifically granted in this license are reserved by "NOVO TECH
SOFTWARE". If you have any questions regarding this agreement, please write to
[email protected]
YOU ACKNOWLEDGE THAT YOU HAVE READ THIS AGREEMENT, UNDERSTAND IT AND AGREE TO BE
BOUND BY ITS TERMS AND CONDITIONS.
6
NovoLiq User's Manual
4. Contents
4.1 Introduction
Evaluation of soil liquefaction hazard is an engineering art requiring judgment and experience in
addition to testing and analysis. Important advancements have been made during the past few
decades in developing tools to help assessing the potential of soil liquefaction, but still some aspects
of the problem remain uncertain. A wide variety of methods from well respected researchers and
practitioners have been implemented in NovoLiq to carry out the soil liquefaction analysis. This
state-of-the-art software program is also fully integrated with gINT suite of products. NovoLiq has
been designed to cover several world-wide known soil liquefaction analysis methods. As part of our
policy for respecting our customers, NovoLiq gives you options for choosing the analysis methods
among all available recommended formulas (please see analysis methods for details).
NovoLiq supports the following field tests for soil liquefaction triggering:
Standard Penetration Test (SPT)
Becker Denseness Test (BDT)
Shear Wave Velocity (Vs)
In addition, users have the option to select their method of calculating the following parameters:
Unlimited soil layers
Cyclic Resistance Ratio
CRR(See 5.7) (10 methods)
Probability of soil liquefaction (Youd and Noble 2001, Cetin et al. 2004)
Depth (overburden) correction factor Cn for SPT (9 options)
Several SPT/BDT/Vs corrections (>6 options)
Direct conversion of Becker Density Test to SPT (2 methods, including friction effect)
Magnitude Scaling Factor(See 5.4) (8 options)
Fines content correction (2 options)
Depth Reduction Factor
Rd(See 5.3) (4 options)
Relative Density (5 options)
Selecting if a soil layer participates in liquefaction or not (outputs will not be provided for nonliquefiable layers)
Note: Recently there has been technical discussions (by Dr Boulanger and Dr Idriss, 2010) about the
accuracy and reliability of Cetin et al (2004) method. Therefore it is recommended that this method
is used with cautious and full understanding of its risks. To obtain the full report please contact us.
4.2 Changing Units System
NovoLiq supports both Metric and English (Imperial) units. To switch between these units system,
please use
ToolsPreferences menu and click on User Interface tab.
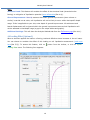
4.3 Data Entry
In-situ Test Data
7
NovoLiq User's Manual
Three type of field tests are supported in NovoLiq for soil liquefaction analysis: SPT, BDT and Vs. For
more information on theoretical background of each method please
read this article(See 5.1). Each
dataset obtained from a field test requires additional corrections. You can enter the test data
manually, or
import from Text files(See 4.10.1), or import from gINT database files(See 4.10.2). In
any case, the test data will be entered in the table located at the left side of the page. The graph on
the right-hand side of the page will be automatically updated based on the data in this table. It will
also show the variation of field test results in depth of subsurface soil layers.
Corrections
Press the
Corrections button to open the dialog box for editing the correction methods for
entered in-situ test data. If test type is SPT/DCPT, the following corrections will be applied on SPT
blows (N) in order to obtain N60 and N1(60):
Energy level (Ce): this will adjust the SPT equipment energy to standard 60% energy.
Borehole diameter (Cb): size of the borehole affects the SPT blow counts.
Sampling method (Cs): specifies whether the sampler has a liner.
Rod length (Cr): this correction factor depends on length of SPT rods which is approximately
equal to the depth of the test. The following formula proposed by Dr. Cetin is used in
NovoLiq:
Overburden stress (Cn): this corrections is usually called "depth correction/normalization
factor" and depends on overburden stress due to the weight of the soil above the testing
depth.
Please choose your favorite method for each correction factor. The following equations are used to
calculate the actual correction factor at each depth:
C=Ce.Cb.Cs.Cr
N60=C.N
N1(60)=60
All the above-mentioned factors (including N60 and N1(60)) are plotted versus depth and presented
on the screen.
Plot Data
Click on this link button to see the plot of field tests versus depth.
Subsurface Layers
Use this table (located at the top of the page) for entering Soil Layers data. Data may be entered
manually (line by line) or can be
imported from text file(See 4.10.1).
Layer Thickness : represents thickness of the layer.
Soil Type : can be Clay, Silt, Sand or Gravel and is only for user's information. This means that
NovoLiq does not take any specific action based on the soil type. For example if you select Clay as
8
NovoLiq User's Manual
the soil type for a layer and you don't consider this layer to be liquefiable (see "Prone to
Liquefaction" below), you should remove this layer from liquefaction assessment by de-selecting the
last column of the table ("Prone to liquefaction?").
Unit Weight :represents the unit weight of the layer.
Fines Content (%): is the percentage of soil particles passing through sieve #200 (clay and silt).
D50 (mm) : is the particle diameter corresponding to 50 percent passing, in sieve analysis curve.
D50 is only used for
Japanese Bridge Code(See 5.7.1) method.
Prone to Liquefaction : if selected, liquefaction analysis will be carried out for this layer. For
example if there is a clay layer in the subject site, which is not essentially prone to liquefaction, you
can remove the checkbox for this layer; in this case a gap will appear on the output graphs
corresponding to this layer (because NovoLiq just skips the liquefaction assessment for this layer).
Schematic Soil Profile
Is updated based on data entered in soil layers table ( read more(See 4.5)).
Analysis
In this tab, please enter information about the subject site, design earthquake and choose the soil
liquefaction analysis methods:
Maximum Earthquake Acceleration (amax) : is the maximum ground acceleration caused by the
earthquake.
Earthquake Magnitude: is the magnitude of the earthquake and affects the
MSF(See 5.4) factor.
Cyclic Resistance Ratio (CRR1) method: NovoLiq supports 10 methods for calculating CRR1 (for
an earthquake magnitude of 7.5). User may select more than one method of analysis and NovoLiq
will provide comparison of all selected methods in outputs. Please click on each method to toggle
on/off.
In order to estimate the settlement and lateral spreading of the site during and after the
liquefaction, the following information are required:
Distance From Fault : is the distance (km) of the subject site from the fault
causing the design earthquake.
Site Topography : site slope condition is one of the most important parameters in estimation of
post-liquefaction lateral displacement.
Zhang & Robertson(See 5.8.1) (2004) recommend using
S≥0.6% (for gently sloped ground) and 40≥L/H≥4 (for free face ground).
9
NovoLiq User's Manual
Misc.
Structural Load: This feature will consider the effect of the structural load (stress below the
footing) on mitigation of liquefaction potential ( more
information(See 4.4)).
Ground Improvement: NovoLiq assumes that when ground improvement (stone column or
similar) is carried out at a site, soil liquefaction will not be likely to occur within that specific depth
range. If this is applicable to your site, enter depth of ground improvement. All settlement and
lateral displacement will be ignored within the ground improvement area and soil liquefaction will
not be assessed in that depth range (a gap in the output tables and graphs).
Additional Settings: This will show the Analysis Methods tab from the
Preferences page(See 4.11).
4.4 Loading Effect (Optional)
When a structure applies the load on a footing, total and effective stress increases in the soil mass.
You can choose to consider the effect of this loading on soil liquefaction assessment (read more
here(See 5.5)). To access this feature, click on
Loading Data menu. The following form appears:
10
button from the toolbar, or click on Input
NovoLiq User's Manual
If you want to activate this feature, simply click on "Footing Size and Loading" checkbox and enter
footing size and the applied stress. If you uncheck this checkbox, effect of loading will not be
considered in soil liquefaction analysis.
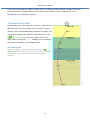
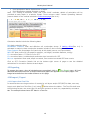
4.5 Schematic Soil Profile
NovoLiq draws the schematic soil stratigraphy based on the
data entered in soil layers table. Each soil type is shown in a
specific color to ease differentiating between soil types. You
can save this drawing as image file (BMP format), by click
on
Save as image link at the top-right corner of the
page. Please notice that ~~~~~ shading on this schematic
soil profile is indicative of groundwater level.
4.6 Seismic Info
Seismic condition of the site can be entered from
DataSeismic Info button from the top toolbar. This data is
required for each project and includes the following
sections:
11
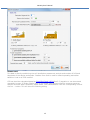
NovoLiq User's Manual
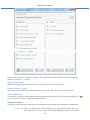
Seismic Info
This data is directly used during the soil liquefaction assessment analysis and consists of PGA and
Magnitude of the design earthquake. Distance from fault is used for lateral spreading estimation
based on Youd et al 2002 method.
CSR can be either calculated based on Simplified Seed (1974)(See 5.2) equation or can be entered
manaually by user. If Shake, Shake 2000 or Pro Shake programs are used for response spectrum
analysis and CSR data is available, please select "User-defined data" from the corresponding list and
click on ... button. This will show the following dialog:
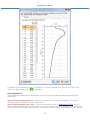
12
NovoLiq User's Manual
CSR data can be entered manually in the table or may be imported from text file (comma or tab
delimited). When done click on
Save button.
Post Liquefaction
Site toppography determines the response of the site to post-liquefaction lateral spreading and
settlement.
Ignore lateral spreading below 2H: if selected, when site has 'free face' topography, any lateral
spreading below the depth of 2H will be ignored.
Ignore lateral spreading when FoS≥: in some methodologies such as Zhang et al (2004), even a
factor of safety gretaer than 1 corresponds to small cyclic shear strains. If selected, user can specify
a cut-off for factor of safety beyond which, cyclic shear strain (and lateral spreading) will be ignored.
13
NovoLiq User's Manual
Ignore lateral spreading below this depth: if selected, any lateral spreading below this depth will be
ignored.
Ignore reconsolidation settlement below this depth: if selected, any reconsolidation settlement
below this depth will be ignored.
Residual shear strangth friction angle: the upper limit for post-liquefaction residual shear strength
ratio (Sr/'v) is defined as tan() where is internal friction angle of sand. User can specify this
friction angle.
4.7 Working with Charts
We understand that presentation of analysis results is important to our users. Everywhere in Novo
Tech Software programs when you double-click on a chart, a new dialog appears containing the
chart and its associated data. In the following example, the corresponding dataset is shown on right
and can be scrolled horizontally and vertically to view all data.
Each toolbar button provides you with a feature:
14
NovoLiq User's Manual
To change line styles of the plot
To change the scale (minimum, maximum and gridlines) of each axis. Please click on small
arrow on right side of the icon to open the dropdown menu
To toggle between normal/logarithmic scale for horizontal axis
To change the chart type
To open the advanced settings page for the chart
To save the dataset table as Microsoft Excel file
To save the chart as text and graphic format
To print the chart
Opens this help page
4.8 Analysis Results
NovoLiq analysis results is shown when
Calculate button in pressed. Results of the soil
liquefaction analysis is presented in form of tables and graphs as shown below:
Graphs include the following (click on each chart to open Chart Presentation Tool(See 4.7)):
In-situ test (original, modified) vs depth
Depth reduction factor (Rd) vs depth
Overburden stress (v, 'v) vs depth
Relative density (Dr) vs depth
Cyclic Resistance Ratio (CRR) vs depth
K vs depth
Factor of safety vs depth
Probability of liquefaction (PL) vs depth
Maximum cyclic shear strain (max) vs depth
Volumetric strain vs depth
Post-liquefaction settlement vs depth
15
NovoLiq User's Manual
Post-liquefaction lateral displacement vs depth
Post-liquefaction residual strength vs depth
Note : For "Zhang & Robertson 2004" and "Faris 2006" methods, details of calculation will be
provided at each depth in a tabular format. Three columns under "Lateral Spreading Indexes"
present details of the method selected in Preferences page(See 4.11).
Calculation details include the following data:
Rd: depth reduction factor
Overburden Pressure: total and effective soil overburden stress. If loading effect(See 4.4) is
activated in analysis, these overburden stresses include P due to footing loads.
Fines Content: the percentage of silt and clay at this depth (source: soil layers table)
N60: SPT blow counts (N) corrected for sampler, rod length, borehole diameter, energy
Co: correction factor = Cr.Cb.Cs.Ce for SPT
Cn: correction factor; includes depth and water level correction for SPT
N1(60)cs: equivalent clean sand, depth corrected, fines content corrected SPT blow counts
Click on SPT Correction Details link at the bottom-right corner of page to see the detailed
calculations for correction factors at each depth.
4.9 Reporting
To prepare the report, when all calculations are completed, click on
FileReport menu. All input
data and assumptions as well as output tables and graphs will appear on the report pages. The
image below describes the toolbar buttons on this page.
4.10 Import / Export
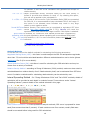
4.10.1 Import from Text Files
In case that there are large number of records for soil layers and/or SPT/BDT/Vs data, user may
import such data from Text files (*.txt) using
button above the tables . The Text file shall have
the following format: one record per line and two numbers on each line, separated by comma or
tab. The example below shows SPT data in a Text file:
16
NovoLiq User's Manual
In the above example, the first numbers (0.3048, 0.6096, etc) are depths and the second numbers
(19, 19, etc.) are corresponding blow counts per ft (N60). Text files can be easily generated using
Windows Notepad or by exporting data from spreadsheet applications like MS Excel into a text file.
For soil layers text file, each line consists of layer thickness (m) and its unit weight (kN/m3)
separated with comma with a general format similar to above.
4.10.2 Import from gINT Files
NovoLiq supports gINT database files. To import a gINT project file click on
toolbar and click on
button from the
Import from gINT menu. Then in the "File Open Dialog" choose your gINT file
(*.gpj). If your gINT file structure is complicated, you may need to choose corresponding tables and
fields from the file, otherwise data will be directly imported and all test-holes containing in-situ test
data will be listed. Select desired borehole and press
Accept Data button. All corresponding data
will be imported to in-situ test table.
Please read the complete online
standard Help file from
documentation on importing gINT files into NovoLiq or open the
StartProgramsNovo Tech SoftwareNovoLiqDocumentation menu.
4.10.3 Export to Graphic Format
Most of the users have already setup their spreadsheets and would rather keep their reports in the
same format. To do this, they need to export the analysis results into other popular formats such as
Microsoft Excel.
To export the results click on
button form toolbar. A dialog similar to the following screenshot will
appear. List of all data tables and charts of the analysis results, will be provided on left and right
panels, respectively (see below).
17
NovoLiq User's Manual
Please select the items you want to export. Then specify the output folder. You can change this
folder by clicking on ... button.
Exporting Data Tables
Tables can be saved as Microsoft Excel or may be directly sent to the printer.
Exporting Graphs (Charts)
All charts may be saved with image formats such as BMP, PNG, JPG, etc or to be printed.
4.11 Preferences
This feature is used for setting NovoLiq preferences and is accessible from toolbar and also from
ToolsPreferences menu. This page has three tabs:
Validation Criteria
In this tab user can apply constraints on some parameters used during liquefaction assessment.
0 < Dr < 100 Some correlations for relative density (Dr) yield invalid results for some
SPT blow counts. If this option is selected, NovoLiq keeps the correlated
18
NovoLiq User's Manual
Dr between 0 and 100 to be consistent with geotechnical concept of
relative density.
0.4 < Cn < 1.7 Depth (overburden stress) correction factor for SPT blow counts, is
known to be valid when between 0.4 and 1.7. By selecting this option,
this rule will be applied to the calculated Cn.
0 < CRR1 < 0.8 Since most of the curves for Cyclic Resistance Ratio (CRR) are presented
for CRR0.8, it is recommended to keep calculated CRR1 is this range. If
this option is not selected, some formulae may result in very large
values or even negative values.
Round BDT blow Becker Density Test results can be correlated to equivalent SPT blow
counts ... counts (see more details here(See 5.7.2)); NovoLiq will round the
equivalent SPT blow count to an integer number if this option is selected.
Ignore lateral If selected, for "Youd 2002" and "Barlett & Youd 1992" methods only,
spreading when the post-liquefaction lateral spreading will be considered ZERO when
N1(60)>15 and M<8 and N1(60)>15. For more information please read page 15 of this
reference:
M<8
Liquefaction-Induced Lateral Displacement
T. Leslie Youd , June 1993
Analysis Methods
In this tab user can set the default methods for calculating the following parameters:
Magnitude Scaling Factor (MSF) : this factor is used to adjust the CRR for earthquake magnitudes
other than 7.5 and could be calculated based on different methods based on user's choice (please
read theory(See 5.4) for more details).
Stress Reduction Factor (Rd) : this factor is used for calculating the CSR calculation and may be
chosen from a variety of methods.
Relative Density Method : according to Zhang & Robertson (2004) method, maximum shear strain is
calculated based on relative density of soil. Relative density itself, can be estimated from SPT blow
count. Correlation method used for calculating relative density can be selected by user.
Lateral Spreading Method : For "Zhang & Robertson 2004" and "Faris 2006" methods, details of
calculation will be provided at each depth in a tabular format. Three columns under "Lateral
Spreading Indexes" present details of the method selected in this page.
Fines Content Correction : in most liquefaction analysis methods, CRR curve is proposed for clean
sand (fines content less than 5 percent). If sand contains more fines content, usually field tests
should be corrected before being used for CRR calculations.
19
NovoLiq User's Manual
These settings will be applied to all analysis.
User Interface
In this tab you can:
choose the input/output units system for NovoLiq user interface and reports
choose user interface language (when available)
20
NovoLiq User's Manual
5. Theory
5.1 Introduction
Soil liquefaction and related ground failures are commonly associated with large earthquakes. In
common usage, liquefaction refers to the loss of strength in saturated, cohesion-less soils due to the
build-up of pore water pressures during dynamic loading. Sladen et al. (1985) defined liquefaction
as:
"Liquefaction is a phenomenon wherein a mass of soil loses a large percentage of
its shear resistance, when subjected to monotonic, cyclic, or shock loading, and
flows in a manner resembling a liquid until the shear stresses acting on the mass
are as low as the reduced shear resistance"
Liquefaction Assessment
Evaluating the liquefaction resistance of soils is an important step in the engineering design of new
structures and the retrofit of existing structures in earthquake-prone regions. The evaluation
procedure widely used throughout the world is termed the simplified procedure. This simplified
procedure was originally developed by Seed and Idriss (1971) using blow counts from the Standard
Penetration Test (SPT) correlated with a parameter representing the seismic loading on the soil,
called the Cyclic Stress Ratio (CSR). This parameter is compared to Cyclic Resistance Ratio (CRR) of
the soil and if it exceeds CRR, the soil is likely to be liquefied. A safety factor against liquefaction is
defined as ratio of CRR to CSR:
Safety Factor = CRR / CSR * K * K
CRR = CRR7.5(ave) * MSF
Where:
CRR7.5(ave) :calculated cyclic resistance ratio (average of all selected methods at a desired depth) for
an earthquake with M=
MSF : Magnitude Scaling Factor
K : overburden stress correction factor; only applied to the following analysis methods (see
details(See 5.7.1)):
- Vancouver Task Force Report (2007)
- NCEER (1996)
- Cetin et al. (2004)
- Idriss & Boulanger (2004)
each of the above-mentioned methods has its own equation for calculating K
K: ground slope correction (is considered 1.0 in NovoLiq)
21
NovoLiq User's Manual
Note : This theory manual is just an introduction to methods implemented in NovoLiq and does not
encompass all the technical knowledge and comments needed for soil liquefaction assessment.
Therefore this document shall not be used as a reference for learning how to assess liquefaction
potential. Please refer to the related books and other references for more details.
Note: Recently there has been technical discussions (by Dr Boulanger and Dr Idriss, 2010) about the
accuracy and reliability of Cetin et al (2004) method. Therefore it is recommended that this method
is used with cautious and full understanding of its risks. To obtain the full report please contact us.
5.2 Cyclic Stress Ratio (CSR)
The Cyclic Stress Ratio (CSR), is given by Seed and Idriss (1971) formula:
Where:
CSR7.5 : the cyclic stress ratio with reference to earthquake magnitude of 7.5
σv : total overburden pressure at the depth considered
σv’ : effective overburden pressure at the same depth
amax : maximum horizontal acceleration at the ground surface
g : acceleration due to earth’s gravity
rd : stress reduction factor (more(See 5.3))
5.3 Stress Reduction Factor (rd)
NCEER 1997
rd= 1.0 - 0.00765 Z
for z ≤ 9.15 m
rd= 1.174 - 0.0267 Z
for 9.15 m < z ≤ 23 m
rd= 0.744 - 0.008 Z
for 23 m < z ≤ 30 m
rd= 0.50
for z > 30 m
Thomas F. Blake (FugroWest Inc., Ventura, California)
Idriss 1999 and Goldesorkhi 1989
22
NovoLiq User's Manual
Kayen et al. 1992
rd = 1 - 0.012 Z
5.4 Magnitude Scaling Factor (MSF)
Since the CSR and CRR7.5 are provided for earthquake magnitude of 7.5, a Magnitude Scaling Factor
should be multiplied at CRR7.5 to adjust its value for the target earthquake magnitudes.
NovoLiq
covers the following MSF methods:
Tokimatsu & Seed (1987)
2.5-0.2M
Idriss (NCEER 1997)
(7.5 / M) ^ 2.56
other methods (source : NCEER 1997 report):
5.5 Structure Loading Effect
When a structure applies load on a footing, total and effective stress increases in soil mass. NovoLiq
can update σv and σv based on stress increase (P) due to stress below the footing. This overburden
stress update will not be applied for calculating N1(60) which is dependent on overburden stress, too.
All other parameters which are function of overburden stress will be raised by P; for example Cyclic
Stress Ratio will be calculated as below:
23
NovoLiq User's Manual
Where:
σv : total overburden pressure at the depth considered
σv’ : effective overburden pressure at the same depth
Stress increase is calculated based on 2:1 slope method: P=B.L.P / {(B+Z).(L+Z)}
Where:
B: Foundation width
L: Foundation Length
P: Stress below the foundation (load / length 2)
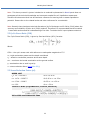
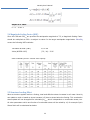
5.6 Probability of Liquefaction
The following method is implemented in NovoLiq for estimating the probability of soil liquefaction
which is recommended in NCEER Workshop Report:
Youd and Noble, 2001
They used a logistic analysis to analyze case history data from sites where effects of liquefaction
were or were not reported following past earthquakes. This analysis yielded the following
probabilistic equation:
Logit (PL) = ln(PL/(1-PL)) = -7.633 + 2.256 Mw - 0.258 N1(60)cs + 3.095 ln(CRR)
Where PL is the probability that liquefaction occurred, 1 - PL is the probability that liquefaction did
not occur, and N1(60)cs is the corrected blow count, including the correction for fines content. Youd
and Noble recommend direct application of this equation to calculate the CRR for a given probability
of liquefaction occurrence. In lieu of direct application, Youd and Noble define MSF for use with the
simplified procedure. These MSF were developed by rotating the simplified base curve to near
tangency with the probabilistic curves for PL of 50%, 32%, and 20% and various earthquake
magnitudes. These MSF are defined as the ratio of the ordinate of the rotated base curve at the
point of near tangency to the ordinate of the unrotated simplified base curve at the same N1(60)cs.
Because the rotated simplified base curves lie entirely below the given probability curve, CRR
calculated with these MSF are characterized by smaller probability of liquefaction occurrence than
the associated probabilistic curves.
Thus the MSF listed in this table(See 5.4), are denoted by PL<50%, PL<32%, and PL<20%,
24
NovoLiq User's Manual
respectively. Because the derived MSF are less than 1.0, Youd and Noble do not recommend use of
MSF for PL<32% and PL<20% for earthquakes with magnitudes greater than 7.0; Equations for
defining the Youd and Noble MSF are listed below:
Probability, PL < 20% MSF = 103.81/M4.53 For M < 7
Probability, PL < 32% MSF = 103.74/M4.33 For M < 7
Probability, PL < 50% MSF = 104.21/M4.81 For M < 7.75
Cetin et al, 2004
A complete explanation of this method is resented in the following paper:
Standard Penetration Test-Based Probabilistic and Deterministic Assessment of Seismic
Soil Liquefaction Potential
K. Onder Cetin, M.ASCE; Raymond B. Seed, M.ASCE; Armen Der Kiureghian, M.ASCE;
Kohji Tokimatsu; Leslie F. Harder Jr., M.ASCE; Robert E. Kayen, M.ASCE ; and Robert E.
S. Moss, M.ASCE
Note: Recently there has been technical discussions (by Dr Boulanger and Dr Idriss, 2010) about the
accuracy and reliability of Cetin et al (2004) method. Therefore it is recommended that this method
is used with cautious and full understanding of its risks. To obtain the full report please contact us.
5.7 Cyclic Resistance Ratio
NovoLiq supports a variety of field tests for evaluation of CRR at each depth. For each test type, a
comprehensive explanation of the related theory and formulae are presented at the following
articles:
CRR methods
based on Standard Penetration Test (SPT)(See 5.7.1)
CRR methods
based on Becker Density Test (BDT)(See 5.7.2)
CRR methods
based on Shear Wave Velocity (Vs)(See 5.7.3)
5.7.1 SPT-Based CRR
All CRR7.5 calculation methods utilized in NovoLiq are described below:
NCEER (1997) and Vancouver Task Force Report (2007)
These two methods are very similar expect that in "Vancouver Task Force Report (2007)" a K
parameter is multiplied in CRR7.5. In these methodologies, CRR7.5 is a function of depth corrected
SPT blow counts N1(60) for clean sand (fines content less than 5 percent). For sands containing more
fines content, more corrections will be applied on N1 (60). The CRR7.5 curve proposed by these
methodologies based on N1(60) is shown below:
25
NovoLiq User's Manual
In NovoLiq, the equation proposed by Thomas F. Blake (Fugro West Inc., Ventura, California)
recommended by NCEER Workshop (1997) for clean sand curve, as shown below is used. This
equation is valid for N1(60)cs30
26
NovoLiq User's Manual
Proposed CRR7.5 curve for clean sand (after Thomas F. Blake - NCEER Workshop)
The Kσ factor is calculated from the following formula:
Kσ = (σ΄vo / Pa)f-1
Where Pa is atmospheric pressure in the chosen units and f depends on relative density (Dr) and
given by:
f = 1 - 0.005 * Dr
for 40% < Dr < 80%
Dr ≤ 80% can be estimated using Dr = 100 * S(N1(60)/46)
Boulanger and Idriss (2004)
The following equation is proposed by Boulanger and Idriss (2004) for clean sand:
27
NovoLiq User's Manual
Japanese Bridge Code
This methodology is based on SPT blow counts and particle size distribution of sand.
Where:
D50 : particle size corresponding to 50 percent passing
Fc : percent fines content passing sieve #200 (clay and silt)
Cetin et al, 2004
A complete explanation of this method is resented in the following paper:
Standard Penetration Test-Based Probabilistic and Deterministic Assessment of Seismic
Soil Liquefaction Potential
K. Onder Cetin, M.ASCE; Raymond B. Seed, M.ASCE; Armen Der Kiureghian, M.ASCE;
Kohji Tokimatsu; Leslie F. Harder Jr., M.ASCE; Robert E. Kayen, M.ASCE ; and Robert E.
S. Moss, M.ASCE
Note: Recently there has been technical discussions (by Dr Boulanger and Dr Idriss, 2010) about the
accuracy and reliability of Cetin et al (2004) method. Therefore it is recommended that this method
is used with cautious and full understanding of its risks. To obtain the full report please contact us.
Other Methods
Some other CRR1 curves proposed by geoscientists are also implemented in NovoLiq. These curves
are shown in the following graph; Horizontal axis is normalized corrected SPT blow counts (N1= (60)).
28
NovoLiq User's Manual
5.7.2 BDT-Based CRR
The approach for liquefaction assessment based on Becker Density Test (BDT) is essentially
assessing the liquefaction potential using equivalent SPT blow counts (N 60). Two following methods
are covered in NovoLiq for correlating Becker blows to SPT blows:
29
NovoLiq User's Manual
Alex Sy & Campanella (1993) with considering casing
friction (RS)
Harder & Seed (1986)
When BDT blow counts are converted to equivalent SPT blow counts (N 60), the procedures for
Standard Penetration Test(See 5.7.1) will be applied to field test data.
Note: it is assumed that user has already corrected BPT blow counts for 'bounce chamber pressure'.
Novo Tech program NovoBPT can be used for Becker penetration test processing and correlations.
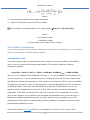
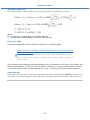
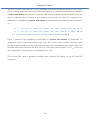
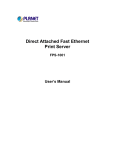
5.7.3 Vs-Based CRR
The CRR7.5 based on VS is calculated based on the following methodology (source: NCEER Workshop
1997 report):
Recommended Method by NCEER, 1997
Robertson et al. (1992) proposed a stress-based liquefaction assessment procedure using field
performance data from sites in the Imperial Valley, California. These investigators normalized V S by:
VS1 = VS(Pa/σ′vo)0.25
where Pa is a reference stress of 100 kPa, approximately atmospheric pressure, and σ′vo is effective
overburden pressure in kPa. Robertson et al., 1992 suggested the liquefaction resistance bound
(CRR curve) for magnitude 7.5 earthquakes, plotted in the following figure along with several sites
30
NovoLiq User's Manual
where liquefaction did or did not occur. Subsequent liquefaction resistance boundaries proposed by
Kayen et al., 1992 and Lodge, 1994 for magnitude 7 earthquake are also shown.
Figure 1 : Proposed cyclic stress ratio based on shear wave velocity.
The relationship proposed by Lodge (1994) provides a conservative lower boundary for liquefaction
case histories with VS1 less than about 200 m/s. The relationship by Robertson et al. (1992) is the
least conservative of the three. Professor Ricardo Dobry suggested a relationship between cyclic
resistance ratio and VS1 for constant average cyclic shear strain; This formula supports a CRR bound
passing through the origin and provides a rational approach for extrapolating beyond the limits of
the available field performance data, at least for lower values of V S1 (VS1 ≤ 125 m/s).
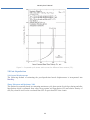
For higher values of VS1 , Andrus and Stokoe reason that the CRR bound should become
asymptotic to some limiting VS1 value. This limit is caused by the tendency of dense granular soils to
exhibit dilative behavior at large strains. Thus, equation is modified to:
av/σ′vo = CRR = a(VS1/100)2 + b/(VS1c - VS1) - b/VS1c
31
NovoLiq User's Manual
where VS1c is the critical value of VS1 which separates contractive and dilative behavior, and a and b
are curve fitting parameters. Using the relationship between V S1 and CRR expressed by this equation
, Andrus and Stokoe drew curves to separate data from sites where liquefaction effects were and
were not observed. Best fit values for the constants a and b were 0.03 and 0.9, respectively, for
magnitude 7.5 earthquakes. Andrus and Stokoe also determined the following best-fit values for
VS1c :
VS1c
=
220
m/s
for
sands
and
gravels
with
fines
contents
less
VS1c
=
210
m/s
for
sands
and
gravels
with
fines
contents
of
than
about
5
%
20
%
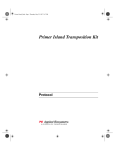
VS1c = 200 m/s for sands and gravels with fines contents greater than 35 %
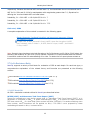
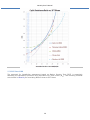
Figure 2 presents CRR boundaries recommended by Andrus and Stokoe for magnitude 7.5
earthquakes and un-cemented Holocene-age soils with various fines contents. Although these
boundaries pass through the origin, natural alluvial sandy soils with shallow water tables rarely have
corrected shear wave velocities less than 100 m/s, even near ground surface. For a V S1 of 100 m/s
and a magnitude 7.5 earthquake, the calculated CRR is 0.03
This minimal CRR value is generally consistent with intercept CRR values for the CPT and SPT
procedures.
32
NovoLiq User's Manual
Figure 2 : Proposed cyclic stress ratio curves for different fines content (FC).
5.8 Post-Liquefaction
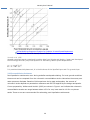
5.8.1 Lateral Displacements
The following method of estimating the post-liquefaction lateral displacements is incorporated into
NovoLiq:
Zhang, Robertson and Brachman, 2004
This method is essentially based on estimating maximum cyclic shear strain of each layer during and after
liquefaction which is estimated from safety factor against soil liquefaction (FS) and relative density of
soil (Dr), when Dr itself can be correlated from SPT or equivalent SPT blow counts.
33
NovoLiq User's Manual
Figure 1 : maximum cyclic shear strain for post liquefaction
lateral displacement proposed by Zhang, Robertson and Brachman, 2004.
Then, the Lateral Displacement Index (LDI) is calculated from the following equation:
Where gmax is the maximum shear strain in each layer induced by cyclic load, and dz is depth
interval at each test(See 5.8.3). Based on the topography of the site (Gently Sloped / Free Face)
the lateral displacement is then estimated from LDI. The complete procedure proposed by the
authors, is available in the following paper from our website:
Estimating Liquefaction-Induced Lateral Displacements Using the Standard Penetration
Test or Cone Penetration Test
G. Zhang; P. K. Robertson; and R. W. I. Brachmann
Faris, 2006
This method is similar to Zhang and Robertson method; but instead a Displacement Potential Index (DPI)
is calculated based on Cyclic Stress Ratio (CSR)(See 5.2) and N1(60)cs:
Where gmax is the maximum shear strain in each layer induced by cyclic load, and dz is depth
interval at each test(See 5.8.3). Based on the topography of the site (Gently Sloped / Free Face)
34
NovoLiq User's Manual
the lateral displacement is then estimated from DPI. The procedure is available for download from
our website:
Guidelines on Foundation Loading and Deformation Due to Liquefaction Induced Lateral
Spreading
DOT (February 2011)
Note: Please note that for both Faris 2006 and Zhang 2004 methods, you can choose to ignore
lateral spread when factor of safety is greater than a certain number. For more information please
read this article(See 4.6).
Youd 2002
The following equations are used for estimation of lateral displacements:
Gently
Sloped:
Free
Face:
Where DH is the estimated lateral ground displacement in meters; M is the moment magnitude of
the earthquake, R* is the nearest horizontal or map distance from the site to the seismic energy
source in kilometers, T15 is the cumulative thickness of saturated granular layers with corrected
blow counts N1(60) less than 15, in meters, F 15 is the average fines content for granular materials
included within T15 in percent, D5015 is the average mean grain size for granular materials within T 15
in millimeters, S is the ground slope in percent, and W is the free-face ratio defined as the height of
the free face divided by the distance from the base of the free face to the point in question in
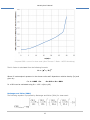
percent. It is recommended that R be estimated from the following graph based on PGA and M:
R* = R + 10(0.89M-5.64)
35
NovoLiq User's Manual
The complete paper can be downloaded at:
Revised Multilinear Regression Equations for Prediction of Lateral Spread Displacement
T. Leslie Youd, Corbett M. Hansen, Steven F. Bartlett
Hamada et al 1986
Hamada compiled lateral spread and borehole data from Niigata and Noshiro, Japan and developed
the following preliminary empirical equation for estimating lateral spread displacement:
D is predicted lateral displacement, H is the thickness of the liquefied layer and
is ground slope.
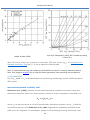
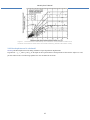
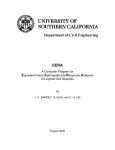
5.8.2 Reconsolidation Settlement
Post-liquefaction settlements occur during and after earthquake shaking. For level ground conditions
the amount can be computed from the volumetric reconsolidation strains induced as the excess pore
water pressures dissipate. Based on field experience during past earthquakes, the amount of
volumetric strain depends on penetration resistance and the CSR applied by the design earthquake.
Curves proposed by Ishihara and Yoshimi (1992) are shown in Figure 1 and indicate that volumetric
reconsolidation strains can range between about 4.5% for very loose sand to 1% for very dense
sands. These curves are recommended for estimating post-liquefaction settlements.
36
NovoLiq User's Manual
Figure 1 : Recommended relationships for volumetric reconsolidation strains as a
function of maximum shear strain and relative density (Ishihara & Yoshimi 1992)
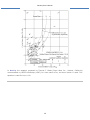
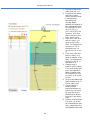
5.8.3 How depth interval is calculated?
NovoLiq calculates depth interval dz during calculation of post-liquefaction displacements.
In general dz = zb - zt where zt and zb are the depth to the top and bottom of the depth interval between the subject test and
previous and next tests. The following explains how dz is calculated for each case:
37
NovoLiq User's Manual
1. If a test is above the
water level, dz = 0.
2. In general, the depth
interval for tests
within the same layer
is calculated by
calculating the
average depth
between the depths of
two subsequent tests.
For example for N=3
at z=10.5 ft, zb=
(10.5+15.5)/2=13 ft.
However, zt for this
test is the top of this
layer which is 9 ft.
3. If the test is the first
test in a layer, zt is
equal to top of the
layer. For example for
N=9 at z=1.5 ft, zt
would be zero. For
N=3 at 10.5 ft, zt is 9
ft.
4. If the test is the last
test in a layer, zb is
equal to bottom of the
layer. For example for
N=6 at z=15.5 ft, zb
would be 16 ft.
5. If water level is
present within a layer,
zt for tests within that
layer will depend on
depth of water level.
For example for N=4
at z=6 ft, zt=6 ft and
zb=9 ft.
6. For first test below the
ground water level, Zt
will be water level.
7. If a test depth is
excatly on the
interface between to
layers (e.g. N=4 at 6
ft), then the test is
considered to be the
first test in the lower
layer.
8. If there is no field test
in a layer, no dz will
be considered for that
layer (remember dz is
calculated at each test
38
NovoLiq User's Manual
depth).
Note:
dz, Zt and Zb are given on the
'Post-Liquefaction
Parameters' tab in the
output.
39
NovoLiq User's Manual
6. Online
6.1 Novo Tech Software website
http://www.novotechsoftware.com
6.2 Our other programs
http://www.novotechsoftware.com/products/
6.3 Updates
http://www.novotechsoftware.com/updatelogs/novoLIQ.txt
6.4 Contact us
http://www.novolab2.com/web forms/contact.php
40