1
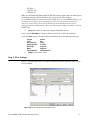
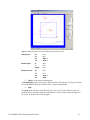
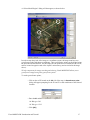
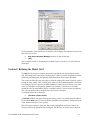
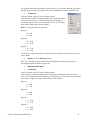
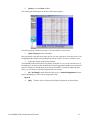
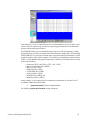
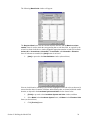
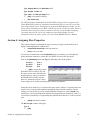
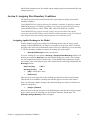
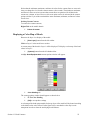
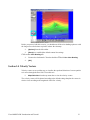
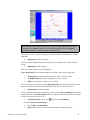
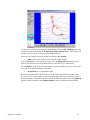
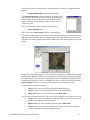
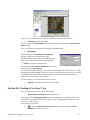
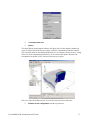
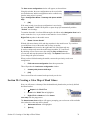
The Overlay Control window will appear providing a list of available overlays that may be
turned on and off.
Use the Overlay List Filter to display only the Properties overlays by clicking the
and selecting Properties.
button
Prop(F) - Conductivities
[OK] to display the Conductivity overlay
The grid cells in the middle layer of the model (Layer 2) should be colored dark blue, except
in the region of the Discontinuous Aquitard, to indicate they belong to Conductivity Zone #2.
Now return to the layer view of the model domain.
[View Layer] button from the left toolbar
Move the mouse into the cross-section and select Layer 1.
Assigning River Boundary Conditions
If you look closely at the sitemap, you will see the Waterloo River flowing along the southern
portion of the model domain (drawn in a light blue color). The following instructions describe
how to assign a River boundary condition in the top layer of the model.
Boundaries/River from the top menu bar to enter the River input screen
[Assign >] Line from the left toolbar
Beginning on the south-west side of the grid and using the sitemap as a guide, digitize a line
of grid cells along the river by clicking along its path with the left mouse button.
When you have reached the south-east boundary, Right-Click the mouse button at the end
point of the line.
The grid cells along the Waterloo River will be highlighted in pink and River - [Assign Line]
window (as shown in the following figure) will prompt you for information about the river.
Traditionally, the River boundary condition has required a value for the Conductance of the
riverbed. However, the Conductance value for each grid cell depends on the length and width
of the river as it passes through each grid cell. Therefore, in a model such as this, with
different sizes of grid cells, the Conductance value will change depending on the size of the
grid cell.
In order to accommodate this type of scenario, Visual MODFLOW allows you to enter the
actual physical dimensions of the river at the Start point and End point of the line, and then
calculates the appropriate Conductance value for each grid cell according to the standard
formula.
Type the following information for the River boundary condition:
Description: Waterloo River
.Assign to appropriate layer
.Use default conductance formula
.Linear gradient
Note that when the checkbox beside the Linear gradient is checked, two tabs, Start Point
and End Point appear in the window (as shown in the following figure)
Start Point tab and Type the following information:
Section 5: Assigning Flow Boundary Conditions
38


![RessqM, Enhanced Version of RESSQ [Javandel et al., 1984]](http://vs1.manualzilla.com/store/data/005674408_1-e8a4b9f66c80cdc83d847a710e5b4b1f-150x150.png)