1
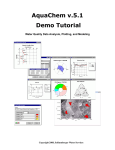
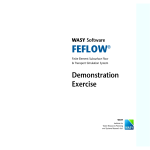
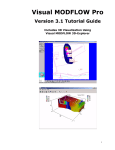
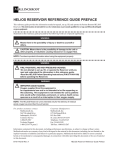
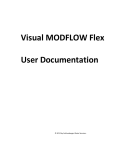
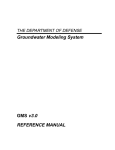
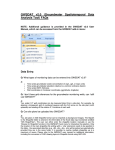
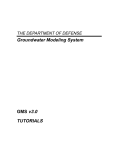
September Edition
» GW Contour:
A Powerful Data
Contouring &
Visualization Program
Designed Specifically
for Groundwater
Professionals!
NEW PRODUCT ANNOUNCEMENT:
GW Contour for Windows 2000/XP Pro
GW Contour: A Powerful Data Contouring &
Visualization Program Designed Specifically
for Groundwater Professionals!
» WHI Completes
Available now at our limited-time introductory
price!
Caribbean Saltwater
Intrusion Investigation
» WHI's Line-Up of
Environmental &
Groundwater Modeling
Courses!
Upcoming Professional
Courses:
» Applied Groundwater
Flow & Contaminant
Transport Modeling
GW Contour: A Powerful Data Contouring & Visualization Program
Designed Specifically for Groundwater Professionals!
GW Contour, developed by Waterloo Hydrogeologic, Inc., represents the
first data interpolation and contouring program to also incorporate
advanced techniques for mapping velocity vectors and particle pathlines
– all within one, easy-to-use program! GW Contour offers the perfect
combination of tools and techniques for groundwater and environmental
professionals. Click here for a free demo.
Professional Applications of GW Contour
» GIS Data Management
for Groundwater
Modelers
» Groundwater Flow and
Contaminant Transport
Modeling for Risk
» NGWA - GIS Data
Management for
Groundwater Modelers
●
●
●
●
●
●
●
» NGWA The
Graphical mapping and reporting of groundwater levels
Preliminary interpolation and contouring of contaminant
concentrations (groundwater, soil, or air)
Assessing groundwater flow direction and magnitude
Contouring data obtained from pumping tests, dataloggers,
groundwater monitoring events, weather stations, groundwater
models, borehole logs, etc.
Gridding ground surface elevations for use in groundwater flow
models, or GIS
Analyzing exposure pathways when assessing human health risk
Comparing conceptual interpretations with calculated
interpretations
Contaminant concentrations with
velocities
MODFLOW Course
Whether contouring elevations, contaminant concentrations, or other
spatially variable data, GW Contour has the techniques and tools
necessary to map and report your data in a professional manner.
Contouring topography
» WEL1 versus FWL4
package when running
MODFLOW-SURFACT
from within Visual
MODFLOW
Features & Benefits
●
●
●
» Van Essen Instruments -
●
Divers in China
●
●
Printer Friendly
Version
●
Provides an all-in-one solution for interpolating and mapping
groundwater and environmental data
Offers the unique ability to calculate forward and reverse particle
movements
Capable of calculating velocity vectors (magnitude and direction),
important for groundwater projects
Quick and easy georeferencing of raster-based images used as
basemaps
Advanced interpolation techniques to address various data sets
Intuitive and logical graphical user interface design
Handles a wide range of environmental units
Water table contours
BUY NOW AND SAVE WITH OUR SPECIAL LIMITED-TIME
INTRODUCTORY PRICE.
GW Contour is now available for purchase for only US$395!
Multi-User, Government, and Educational Discounts available
Mapping water quality
Waterloo Hydrogeologic has been providing software solutions for
groundwater and environmental professionals since 1989. Since the
beginning, our users have demanded - and received - easy-to-use,
intuitive software applications to address their project needs. We are
proud to be releasing GW Contour as an integral part of our industryrecognized suite of groundwater and environmental software products.
Note on Beta Testing Program for GW
Contour 1.0
We are proud to announce that the GW Contour Beta Testing program
was a big success, with over 90 participants. We very much appreciate
the time that the beta testers took to evaluate the software and send us
their findings. We are confident that with the implementation of many of
your suggestions, GW Contour will prove to be a valuable tool for a wide
range of users! Those suggestions that have not been included in this
release will be considered for future software updates.
As a token of WHI's appreciation for the major contributions of Mr. Tony
Burgess and Mr. Yves LeBlanc, and for their commitment and
enthusiasm, we are pleased to announce that they will receive a free
copy of GW Contour 1.0!
Learn more about GW Contour!
For more information, about GW Contour, please visit our website or contact us today:
Website: http://www.waterloohydrogeologic.com
Email: [email protected]
Phone: (519) 746-1798
Assessing flow pathlines
WHI Completes Caribbean Saltwater Intrusion Investigation
Objective and Background
The objective of this investigation was to assess the impact of a planned
coastal construction project on a shallow groundwater system, and to
assist in developing strategies to reduce potential negative effects
To represent freshwater and saltwater conditions properly, density
dependent flow induced by density differences had to be taken into
account. Prior to developing the numerical model, available
hydrogeologic data representing the site was compiled and interpreted to
create a conceptual geological model of the study area. The design of
Figure 1. FEFLOW model and pre- marina
the proposed marina was incorporated into the 3D model as a
construction distribution of TDS (salinity)
geometrical boundary.
Density Dependant Model
Because of its advanced capabilities to simulate complex groundwater
flow systems involving density dependent conditions, the FEFLOW
package was applied to solve this modeling task.
An unconfined (phreatic) aquifer with saturated layers was considered to
be an appropriate conceptualization to represent the groundwater
system. Additionally, steady density dependent flow and mass transport
were taken into account as coupled processes.
The definition of a well posed density dependent 3D problem is primarily
controlled by the flow and mass transport boundary conditions and
constraints. Figure 1 shows the FEFLOW model that was developed and
the pre-marina construction distribution of TDS (salinity).
Figure 2. Plan view distribution of TDS
after marina construction
(marina shown with black outline).
Modeling Results
The proposed marina channel was predicted to produce an upconing
effect, and had the function of a drainage element increasing outflow
velocities, as shown in Figure 2. For this particular hydrodynamic
situation, the modeling results suggested that the strongest impact was
expected in the vertical rather than in the lateral direction. This is shown
in Figure 3, which presents a 3D view of the predicted upconing at the
proposed marina.
Based on the completion of additional simulations, the expected lateral
depletion of the fresh water lens appears to be small. This is supported
by the extremely steep gradient developed towards the discharge
boundary.
The numerical problem converged within a few iterations, and accurate
water balance and tolerable mass imbalances confirmed that the model
converged on the appropriate solution.
Figure 3. Predicted saltwater upconing
below the proposed marina
Learn more about WHI's
Consulting Services!
For more information related to this topic, or if you would like more information about WHI's Consulting Services
and capabilities, please visit our website or contact us today:
Website: http://www.waterloohydrogeologic.com/consulting/consulting_services.htm
Email: [email protected]
Phone: (519) 746-1798
WHI's Line-Up of Environmental & Groundwater Modeling Courses!
The 2005 Waterloo Hydrogeologic Open Enrollment schedule has been set. In response to comments from
groundwater professionals who have taken our Groundwater Modeling Courses in the past, and from those who would
like to attend courses in the future, WHI has combined the strengths of our previous Groundwater Modeling,
Advanced Groundwater Modeling, and Model Calibration courses into one Applied Groundwater Flow &
Contaminant Transport Modeling course. This course includes updated lecture material, as well as new hands-on
laboratories to support the new course material. WHI has also created a new short course entitled GIS Data
Management for Groundwater Modelers, which teaches the theory and hands-on application of GIS data integration
and interpolation to support groundwater modeling efforts, as well as 3-dimensional visualization of modeling results
in Visual MODFLOW, HydroGeo Analyst, and GIS environments.
Click on the titles below and see which courses are appropriate for you!
» Applied Groundwater Flow & Contaminant Transport Modeling - NEW
» Groundwater Contamination & Remediation - UPDATED
» Finite Element Groundwater Modeling - UPDATED
» Aquifer Test Analysis - NEW
» Unsaturated Zone Modeling and Evaluation of Landfill Impacts - UPDATED
» The Human Health Risk Assessment Course - NEW
» Water Quality Data Management & Modeling - UPDATED
» Regulatory Review of Hydrogeology Studies - UPDATED
» GIS Data Management for Groundwater Modelers - NEW
Who Can Benefit?
» Experienced hydrogeologists with no prior groundwater modeling experience
» Regulators who review modeling reports
» Managers who want to understand what the modelers are doing
» Experienced modelers who want to enhance their skills
» Students who want to acquire new skills
» Lawyers who want to understand some of the technical issues
» Industry professionals who want to understand more about what their consultants are
telling them
For further details on any of these courses, please visit our website, or contact Miln Harvey,
WHI Training Manager, at (519) 746-1798 x233.
Can't make it to one of our Open Enrollment Courses?
Call us about our On-Site Custom courses designed to suit your specific needs!
Theory and Hands-on Applications using MODFLOW-2000, MODPATH, MT3D
& WinPEST
Simple to complex applications of groundwater flow and contaminant transport
models are covered in this 4-day hands-on course.
Course Objectives and Benefits
●
●
●
Apply Visual MODFLOW Pro to 3D groundwater flow and contaminant transport
projects
Use MODFLOW-2000 to develop several groundwater flow models
Calibrate your groundwater models to observed field data
Bejing, China
Oct 31-Nov 4, 2005
Sao Paulo, Brazil
Nov 8-11, 2005
Melbourne,
●
●
●
●
Use MODPATH particle tracking features to determine preferential
flow paths and delineate capture zones
Use ZoneBudget to assess subregional water budgets within your groundwater
model
Simulate 3D contaminant transport using RT3D, MT3DMS & MT3D99
Use WinPEST to improve model calibration and understand model uncertainty
Australia
Nov 15-17, 2005
For more details please click here.
This 3-day course goes beyond an introduction to the development, calibration and
optimization of groundwater flow and transport models to provides hands-on
experience in more advanced topics.
Melbourne, Australia
Nov 21-22, 2005
For more details please click here.
Understanding Data Sources, Data Analysis and Visualization
Waterloo,Ontario,
December 6-8,
2005
This 3-day hands-on course presents an introduction to the management and analysis of
groundwater data for Visual MODFLOW modelers.
For more details please click here.
Princeton, NJ,
Oct 25 -28, 2005
The MODFLOW Course Theory & Hands-on Applications using MODFLOW2000, MODPATH, MT3D & WinPEST
Groundwater modeling is becoming a much more complicated, yet highly
integrated component of hydrogeologic analysis and design. This 4-day course
introduces the ground water modeling process, and discusses the development of
simple to complex groundwater models using MODFLOW-2000, MODPATH,
ZoneBudget, MT3D/RT3D. New exercises have been added to show the use of
MGO for pumping well optimization and SEAWAT for saltwater intrusion into
coastal aquifers. The course ends with the analysis of model calibration using
WinPEST to assess the quality of model calibration, and the impact of parameter
input uncertainty on model prediction uncertainty.
For more details please click here.
To register for this
course you must be
a member of
the NGWA, if you
are not please call
NGWA Customer
Service at
800-551-7379,
or email
Columbus, Ohio
Oct. 19-20, 2005
This 2-day hands-on course presents an introduction to the management and
analysis of groundwater data for Visual MODFLOW modelers. Data management
begins with the development of a site GIS using a common georeference system,
which integrates the many different sources of groundwater data that are needed
to develop a groundwater model. This data is then interpreted and interpolated
within the GIS to generate model cross-sections, parameter distributions, model
layer interfaces and model boundary conditions as part of developing the
hydrogeologic conceptualization.
For more details please click here.
To register for this
course you must be
a member of
the NGWA, if you
are not please call
NGWA Customer
Service at
800-551-7379,
or email
For our full 2005 training schedule, click here!
To request your free 2005 Training Course Schedule Catalog, click here!
For more information about our course offerings, visit our website or contact us today:
Website: www.waterloohydrogeologic.com/training/training.htm
Email: [email protected]
Phone: (519) 746-1798
WEL1 versus FWL4 package when running MODFLOW-SURFACT from within Visual
MODFLOW
Visual MODFLOW 4.1 has an interface designed to work with the MODFLOW-SURFACT variablysaturated flow modeling engine, developed by HydroGeoLogic, Inc..
As part of the MODFLOW-SURFACT package, HGL added a new well package to the U.S. Geological
Survey Modular Groundwater Flow Model (MODFLOW) that simulates a wellbore as a high conductivity
fracture tube. This package, which is an alternative to the existing (WEL1) package in MODFLOW, is
referred to as the Fracture-Well (FWL4) Package. The FWL4 Package is designed to overcome several
problems associated with the original WEL1 Package.
First, the FWL4 Package truly emulates a multilayer well. This is because the fracture tube representation
allows connection of aquifer cells (nodes) that are associated with the well to 1-D finite diameter
cylindrical well-cells. Additionally, the total withdrawal rate prescribed for the well is rigorously
incorporated. Volumetric fluxes from each individual node associated with the fracture well are
automatically computed by the code to sum to the total withdrawal from the well. On the other hand, the
original WEL1 Package implements only a priori known source/sink term at an aquifer node representing
a well. Therefore, it requires the user to determine the contribution of each node to the physical well that
penetrates two or more nodes. These nodal flux contributions are typically estimated such that the
prescribed withdrawal rate is apportioned according to the transmissivities of the contributing well nodes.
Such an estimation may result in a calculation error by MODFLOW. Furthermore, for unconfined systems,
prescribing the nodal fluxes according to the WEL1 Package could cause computational difficulties in
addition to misrepresenting the physical system. The FWL4 Package, however, automatically apportions
the net well withdrawal (input by the user) to the well nodes. For each time step, the computed nodal
fluxes may vary substantially, as is the case in the event of desaturation and resaturation of individual
layers.
Another feature of the new FWL4 Package is that for an overpumped unconfined system, the total well
withdrawal is automatically adjusted when the water level in the well has reached the well bottom. At this
stage, the hydraulic head at the bottom well node is fixed at well-bottom conditions, and the total
withdrawal is computed to correspond to the feasible quantity that the well can supply under these
conditions. If a situation occurs whereby the withdrawal demand is less than what the well can supply at
bottom-hole pressure conditions (i.e., if the pump is shut off for a particular period, or recharge is
increased), the hydraulic heads at the well nodes will bounce back to reflect these new conditions, and
the well will provide the full withdrawal demand. The previous WEL1 Package does not physically adjust
the pumping rate when the water level drops below the bottom of the well. Instead, it continues the
computation into the non-physical realm, with the head values at the well nodes continually dropping
below the well-bottom elevation. On other occasions, the WEL1 Package causes the system to become
computationally unstable by cyclically drying and wetting the pumping cells between iterations.
The FWL4 Package also implements well-bore storage, which is neglected in previous versions of
MODFLOW. It should be noted that as in previous MODFLOW versions, the fracture-well package does
not incorporate a local logarithmic function within a grid block corresponding to the well node. Thus, a
refined areal discretization is still required in the vicinity of each well if the user is interested in accurate
predictions of local drawdowns.
Finally, the FWL4 Package is intended for use only with the rigorous variably saturated simulation option
(i.e., input LAYCON = 40 or 43) of the BCF4 Package.
Withdrawal continues at the prescribed rate in each well until the water level in the well reaches the well
bottom. This bottom elevation of a well is physically located anywhere in the lowest nodal layer that is
screened. When the piezometric head at the lowest well node corresponds to the bottom elevation of a
well, the head values are held fixed and the well yield is allowed to fall below the demand. If at a later
stage, the aquifer system recovers and the well yield increases to be larger than the demand, or if the
demand drops below the yield, the well reverts to withdrawing water at the prescribed pumping rate. The
total well yield and contributions of each layer to the well yield are reported in the output file.
To select the FWL4 well package within Visual Modflow, select Run (from the Run Menu) to activate the
Engines to Run dialog box. Then select the Advanced button to reveal the settings field. Change the
settings to User Defined, then select the “…” box and select the Well Package you prefer.
It is important to note the following limitations when working with the FWL4 package:
●
●
●
The LAYCON value for each layer must be 40 or 43
Multi-screen wells are not supported
All wells must be active in your project (wells cannot be inactive during a simulation, they must be
deleted
For further information regarding the FWL4 well package, please refer to the MODFLOW-SURFACT
User’s Manual.
Figure 1: Results Using Standard Well Package
Figure 2: Results Using FWL4 Package:
For more information about WHI's Environmental Information Technology (EIT) services:
Email: [email protected]
Web: http://www.waterloohydrogeologic.com/support.htm
Contribution from E-News subscriber - Van Essen Instruments
Waterloo Hydrogeologic, Inc. is always interested in hearing from our software and hardware users about
their latest projects. Recently we received an article from Van Essen Instruments – makers of the Diver
brand of level loggers - who provided us with a copy of an article addressing the groundwater concerns in
China, and how Diver loggers are being used in an extensive study to determine present conditions, and
future capacities, of the existing aquifer systems.
Divers in China
More than half of the drinking water in China is pumped
up from underground. The rapidly expanding
population, in combination with economic growth, has
sharply increased demand for (drinking) water, and this
demand will continue to rise in years to come, which
will in turn lead to serious supply problems.
Three sites
In association with the Chinese authorities, the
UNESCOIHE institute in Delft, Van Essen Instruments,
and the Netherlands Institute of Applied Geoscience
TNO-National Geological Survey (TNO-NITG) are
currently running a number of projects designed to
acquire an understanding of the situation.
Mr. Dick van Doorn, head of groundwater surveying at TNO-NITG and project manager, describes the
situation:
“We're surveying at three different sites. The first one is near the capital Beijing, where they've been
extracting so much water from the ground that the groundwater level's fallen by 25 metres in the past 13
years. This is bound to have a disastrous impact in the future if nothing's done about it. The government is
building canals to carry water up from southern China, which can be used as drinking water, and part of it
can be infiltrated into the soil.
Near Urumqi, in the far west of the country, we're dealing with a closed system. A large glacier supplies the
Urumqi river with water. The river flows past the city of Urumqi, through a number of irrigated agricultural
regions to a desert, where it finally dries up. The water from the melting glacier, which is gradually getting
smaller, and the annual snow and rainfall, are the only sources of water.
The amount of water available in this region is currently falling, while the demand is growing. Another
problem is that certain parts of the region are only accessible for three months a year because of the snow.
The third area is near the city of Jinan, which is known as the “city of springs”. Since 1972, though, the
springs, which used to supply the city with plenty of water, dry up regularly in the summer months. This is
probably caused by the intensive irrigation people use in the area that supplies the springs with water. The
government has a number of restrictive measures in place, but it's almost impossible to check compliance.”
Divers are more efficient
Mr. van Doorn continues:
“The Chinese authorities have taken measurements of
the groundwater and groundwater level at these sites,
but the data hasn't been stored in an effective system.
We've been asked to adapt the REGIS groundwater
information system developed by our TNO institute to
local conditions, and to make it suitable for storing
existing and new data.
To acquire new data, we've approached Van Essen Instruments, because their Diver is the ideal
groundwater level logger for these kinds of conditions. Van Essen has run a couple of training courses for
the local authorities to teach them how to handle the Divers and read out data. More than 70 Divers have
now been installed in existing wells, and in new wells that have been sunk in tactical locations.
It may seem strange for a country that has such a huge workforce and where wages are so low to opt for
automatic dataloggers. But you have to realize that we're talking about vast distances that people would
have to cover. Frequent and accurate measurements would be far too expensive, so Divers are more
efficient, accurate and ultimately cheaper.”
The current state of affairs
Almost all of the 'old' data has now been digitized and entered in the databank. The results of new
measurements carried out by the Divers are read into the system directly. Mr van Doorn comments:
“In the next few months, we plan to sink more new measuring wells at strategic locations and move a
number of Divers from old wells to the new ones. We hope to have accumulated enough information within
the next few years to enable us to develop models for the three regions and test them on the basis of the
measurements. We can then draw our conclusions and decide how to approach the problems most
effectively.”
If you are interested in the capabilities of the Diver , or would like to learn more about the applicability of this
product to your own projects, please visit our website at:
http://www.waterloohydrogeologic.com/equipment/diver-datalogger/Diver_ov.htm
Thank you for reading this month's edition of WHI E-News! For more information about our products and
services please use the links below!
Visit our Website - See what Waterloo Hydrogeologic Inc. has to offer!
Software Division - Check out our groundwater modeling software.
Consulting Division - Visit our Consulting Division on the web to see how we can help you.
Training Division - Visit our Training Division on the web to find a course in your area.
Equipment Division - WHI is now selling groundwater monitoring equipment.
The preceding message was sent to you as a service by Waterloo Hydrogeologic, Inc. If you do not wish to receive future
editions of WHI E-News, please reply to this message with the word 'Remove' in the subject line.
Waterloo Hydrogeologic, Inc.
Website: www.waterloohydrogeologic.com
Email: [email protected]
Phone: 519-746-1798 Fax: 519-885-5262
Copyright© 2005 Waterloo Hydrogeologic, Inc. All Rights Reserved.