1
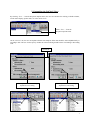
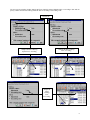
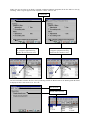
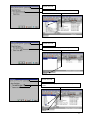
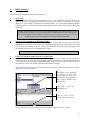
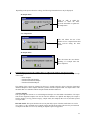
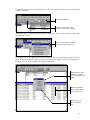
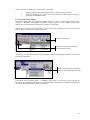
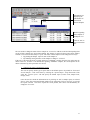
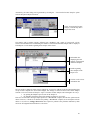
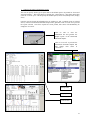
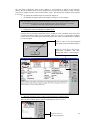
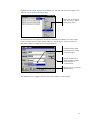
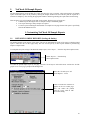
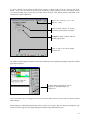
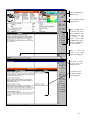
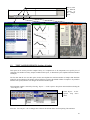
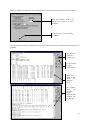
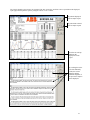
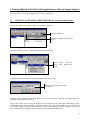
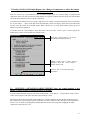
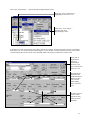
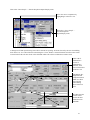
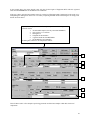
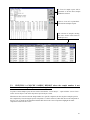
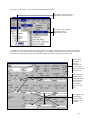
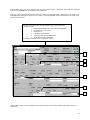
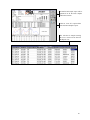
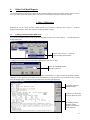
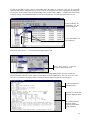
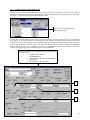
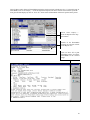
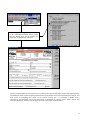
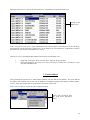
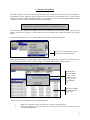
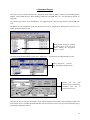
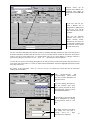
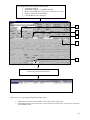
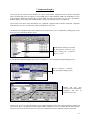
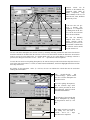
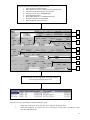
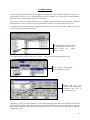
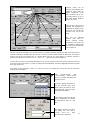
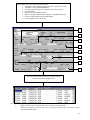
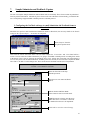
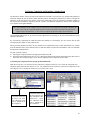
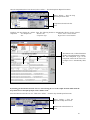
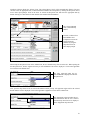
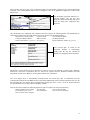
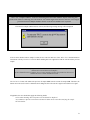
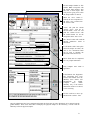
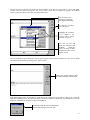
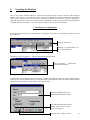
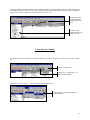
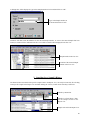
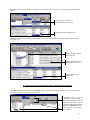
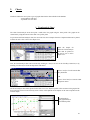
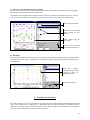
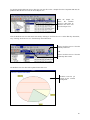
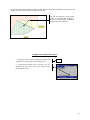
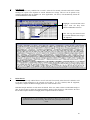
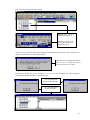
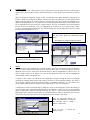
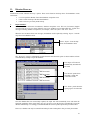
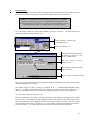
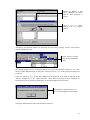
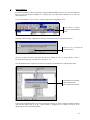
C) Profile sets with specified elements to be plotted
The user can also create his/her own profiles that must be plotted. First decide on a name for the new set of graphs
that must be profiled and enter this as the Profile name.
Then indicate which elements must be plotted for this new Profile by clicking on the elements' tick boxes. Click on
"Save" to save the new Profile set. This profile set can be used in future by selecting it when plotting charts.
Name of the new Profile.
Elements to be included
when plotting the new
Profile
Chart plotted using the
new Profile
Click on "Save" to save the
new Profile for future use.
D) Date Range
The user can also include a Date Range selection when plotting the Analysis Trend chart. Enter a Start and End date
in the "Date From" and "Date To" prompts on the Profile panel. Only the samples meeting this specified Date range
will be plotted.
Only the 3 samples
meeting the Date range
selection criteria are
plotted in the chart.
Date Range selection.
2. Problem Overview Chart
The Chart Problem Overview menu item plots a pie graph using the components/samples Problems Diagnosed field
values in the currently active List/Report view. The Problem Overview chart summarizes the Problem categories
identified of all samples from a selected Component. These Problem categories are then plotted in a pie graph as a
percentage of the total number of problems for that Component.
85

![[Product Name] Service Manual](http://vs1.manualzilla.com/store/data/006035113_1-0289c4c9f962713aa5c1b10dc8f42975-150x150.png)