1
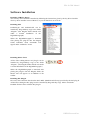
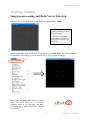
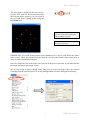
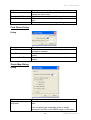
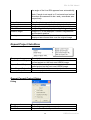
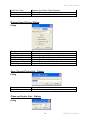
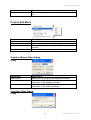
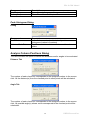
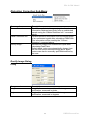
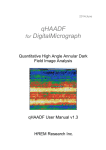
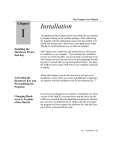
2010/March
PPA for DigitalMicrograph
Peak Pairs Analysis
High-Resolution Peak Measurement
and Strain Mapping Analysis
PPA User Manual v1.5
HREM Research Inc
PPA for DM Manual
Contact Information
General enquiries on the PPA plug-in for DigitalMicropraph should be sent to:
HREM Research Inc.
14-48 Matsukazedai
Higashimatsuyama
Saitama 355-0055
Japan
Phone: +81 493 35 3913
Fax:
+81 493 35 3919
email: [email protected]
Website: http://www.hremresearch.com /
Technical enquiries on the Peak Pairs algorithm should be directed to:
Dr. Pedro L. Galindo
Univ. de Cádiz, Spain
email: [email protected]
Copyright Statements
© Copyright 2008 HREM Research Inc (Japan) and Universidad de Cádiz (Spain)
All rights reserved. This manual is protected by international copyright laws and
treaties. Unauthorized reproduction and distribution of this manual, or any portion of it,
will be prosecuted to the maximum extent possible and may result in severe civil and
criminal penalties.
Portions of this document were prepared by HREM Research Inc. by editing the
materials supplied by Dr. Pedro L. Galindo.
DigitalMicrograph is a trade mark of Gatan Inc.
Acknowledgements
HREM Research Inc would like to thank Dr. Martin Hÿtch for his permission to use its
own DM scripts to generate an artificial dot pattern.
2
HREM Research Inc.
PPA for DM Manual
Table of contents
INTRODUCTION TO PEAK PAIRS ANALYSIS (PPA)
4
SOFTWARE REQUIREMENTS
SOFTWARE INSTALLATION
4
5
GETTING STARTED
6
IMAGE PREPROCESSING AND BASIS VECTOR SELECTION
PEAK PAIRS DETERMINATION
DISPLACEMENT AND STRAIN MAPS CALCULATION
GEOMETRIC DISTORTION CORRECTION
6
9
11
14
ADDITIONAL FUNCTIONS
17
LATTICE ANALYSIS
ANALYZE COLUMN POSITIONS
CREATE VECTOR MAPS
ADAPTIVE WIENER FILTERING
LOW PASS FILTERING
SETTING THE REFERENCE BASE VECTORS MANUALLY
IMAGE RECTIFICATION
17
18
19
20
21
22
23
APPENDIX
25
SOME USEFUL DM TRICKS
25
3
HREM Research Inc.
PPA for DM Manual
Introduction to Peak Pairs Analysis (PPA)
PPA stands for Peak Pairs Analysis, the DigitalMicrograph plug-in for High-Resolution Peak
Measurement and Strain Mapping Analysis.
All results obtained by PPA are fully compatible with the other functions present in DM. For
example, strain maps can be analysed and/or manipulated with functions such as histograms,
statistics (mean, standard deviation, min, max etc.), or using the corresponding buttons, such
as the Profile utility.
The main reference for the algorithm is:
The Peak Pairs algorithm for strain mapping from HRTEM images
Pedro L. Galindo, Sławomir Kret, Ana M. Sanchez, Jean-Yves Laval, Andrés Yáñez,
Joaquín Pizarro, Elisa Guerrero, Teresa Ben and Sergio I. Molina
Ultramicroscopy 107 (2007) 1186–1193
doi: 10.1016/j.ultramic.2007.01.019
This manual will help you to use of the PPA package with some worked examples. There is
also a quick reference guide at the end of this document.
Software requirements
The following is a list of the software requirements necessary to run the PPA plug-in:
-
DigitalMicrograph (GATANTM )
USB Key Driver
HREM Mouse Tool Plug-in (Free-ware downloadable from www.hremresearch.com)
IPU Plug-in (Free-ware downloadable from www.hremresearch.com)
4
HREM Research Inc.
PPA for DM Manual
Software Installation
Installing USB Key Driver
The user key driver should be installed by following the instructions given by the key driver installer.
The key driver installer comes with PPA, or you can find it on our web site.
Installing PPA
PeakPairs.gtk and PeakPairs.dll can be
installed by drag-and-drop copy to the folder
“PlugIns” (The PlugIns folder should exist
under a normal installation of the
DigitalMicrograph.)
When the DigitalMicrograph is launched
after placing the plug-ins into the PlugIns
folder, PeakPairs menu commands will
appear under “PeakPairs” menu.
Installing Mouse Tools
All the files relating Mouse tool plug-in can be
installed by drag-and-drop copy to the folder
“PlugIns.” (The PlugIns folder should exist under
a normal installation of the DigitalMicrograph.)
When the DigitalMicrograph is launched after
placing the plug-ins into the PlugIns folder, the
Mouse tool will appear as an addition to the
toolbar.
Installing IPU Plug-in
PPA uses some functions based on the Intel’ MKL (Math Kernel Library) provided by the IPU plug-in.
All the files relating the IPU plug-in can be installed by drag-and-drop copy. Please consult the
ReadMe file that comes with the IPU plug-in.
5
HREM Research Inc.
PPA for DM Manual
Getting Started
Image preprocessing and Basis Vector Selection
Open the file “Test image.dm3” using the DM command File…Open:
Hint: this image has been
generated artificially to show
PPA functionality.
It consists on a dot pattern
where different strains are
present, but not visible at the
naked eye.
All the commands related to PPA are located in the menu Peak Pairs. The first command to
be applied to a new image is to calculate the Power Spectrum of the image:
Now, using the mouse tool, click on desired
spots. The usual choice is to select the
brightest spots in the spectrum, but those
corresponding to higher harmonics can also
be selected:
6
HREM Research Inc.
PPA for DM Manual
The user doesn’t need to hit the spot exactly,
because PPA looks for the local maxima near
the selected point. Anyway, you can zoom in
the spectrum before hitting peaks using the
DM zoom tool:
Hint: if you wish to delete any spot,
just click on the mouse mark again
with the SHIFT key down.
Hint: Symmetry in the selection for
each spot is assumed.
IMPORTANT: First and second chosen spots (numbered as 1 and 2) will define the lattice
basis vectors. These spots should be apart from the vertical or horizontal of the central spot, in
order to obtain maximum resolution.
Don’t be surprised if the central spot is not present in the power spectrum. It just indicates that
the mean intensity of the image is zero.
We are now ready to apply a Bragg Filter. This process creates an image where the contrast
resulting from the ordered regions is clearly distinguishable from the background intensity.
7
HREM Research Inc.
PPA for DM Manual
The shape and size of the Bragg filter must be adjusted such that no loss of information
occurs. In this dialog box we can determine the size (in pixels), smoothing width(in pixels),
oval ratio(height/width) and direction(in degrees) of mask spots.
By pressing the Apply button, the mask described by the chosen parameters may be
previsualized, as it is shown in these two examples:
Let us select the second choice by
pressing the OK button, and the Bragg
filtered image will appear immediately.
If Bragg filter parameters are properly
chosen (big masks and a sufficient number
of peaks), the resulting filtered image will
preserve the location of maxima. The
great advantage in using the filtered image
is the reduction of present noise.
8
HREM Research Inc.
PPA for DM Manual
Peak Pairs Determination
Once we have a Bragg filtered image, the
next step is to locate peaks of intensity in the
image by pressing the Find Peaks option.
The following dialog box appears:
Note: Let’s ignore by now the parameters in the
checkbox. They will be discussed later.
By pressing OK, we get a first set of peaks shown as coloured spots over the filtered image.
Blue dots represent local maxima (8-neighbourhood) on a pixel basis. Red dots represent
refined maxima at subpixel-resolution. Sub-pixel resolution is achieved by fitting a 2D
quadratic function and calculating analytically the maxima, as described in [1].
Sometimes, extra peaks are obtained in this automatic Peak Finding process, especially at the
borders of the image.
Peak Threshold indicates the minimum intensity of a point to be considered as a valid peak.
Peaks having intensities below this threshold will be discarded. To determine a precise value
9
HREM Research Inc.
PPA for DM Manual
of Peak Threshold, a Peak Histogram may be very useful. This can be obtained using the
corresponding option in the Peak Pairs menu.
By looking at the histogram, a reasonable threshold could be the value 2.5. Repeating the Find
Peaks command and choosing Peak Threshold=2.5, all peaks in the border of the image will
be discarded and won’t be considered in any further calculations.
If we want to restrict the distance between peaks, it is possible to define the Minimum Peak
Distance in the same dialog box.
The next step is the calculation of Peak Pairs. This process will find pairs of peaks along two
basis vectors automatically chosen from the user selected Bragg spots (see Additional
functions for selecting the reference basis vectors manually).
Once all Peak Pairs have been determined, we can proceed to the calculation of displacement
maps using the command Displacement Maps. This generates horizontal and vertical
displacements along the two defined directions (D1h, D1v, D2h and D2v).
10
HREM Research Inc.
PPA for DM Manual
Displacement and Strain Maps calculation
Technical note: PPA uses an automatic selection of contrast and the temperature colour
scale for displaying image values.
If you prefer a grey scale or a different contrast limit, press the right button on the image,
and modify ImageDisplay options properly.
Changing this options will not change the actual values, only its appearance.
A very important step is to define the reference
area, that is to say, the area which is considered to
correspond to the reference lattice.
All displacements and strain values will be
referred to this area. Use the DM ROI tool
(region of interest tool) to select an area on any
Displacement image (D1h, D1v, D2h or D2v):
Once the reference area has been chosen, the user should select the Define Reference option.
This will change the displacement values, so as to obtain a uniform displacement in the
chosen area.
11
HREM Research Inc.
PPA for DM Manual
The final step is the determination of strain
maps (exx,eyy,exy and eyx) at the desired angle.
If angle is set equal to 0, horizontal and
vertical directions are assumed to be x and y
coordinate axis respectively.
There are two options for strain representation:
Overlay: the strain is shown at each atomic column,
and displayed as coloured dots over the original image
12
No overlay: continuous strain maps
are shown.
HREM Research Inc.
PPA for DM Manual
Once the representation is chosen, a set of 4 images corresponding to (exx,eyy,exy and eyx) are
obtained
Choosing the x-axis parallel to the picture horizontal axis (i.e. angle zero) and leaving overlay
unmarked, the following image group will be obtained:
Hint: you can modify the color
range by pressing the right
button of the mouse on the
image, and modifying
ImageDisplay options properly.
Default colour range is ±5%
strain and ±5° rotation.
The results of the PPA package is the complete strain tensor defined as follows:
Strain values
,
,
,
Strain tensor:
i.e.
,
,
Mean dilatation :
i.e.
Rotation (in radians and anti-clockwise positive):
i.e.
As we clearly see in the resulting images, the displacement and strain maps appear to be the
composition of two different sources of deformation. The reason is that distortions due to the
projector lens have been made quite visible in the example.
In the next section, we will show how to remove this distortion using an image of a perfect
crystal taken in the same conditions.
13
HREM Research Inc.
PPA for DM Manual
Geometric distortion correction
All optical systems distort the images they form. CCD cameras and scanners (for digitising
negatives for example) introduce additional distortions. If these geometric distortions are
fixed (what is usual for a given system), it is possible to eliminate them. This is valid not only
for projector lens distortions but also for any other systematic distortions present in the image.
In order to correct the distortions, an image of a perfect crystal is needed. Open the image
“Substrate.dm3”, which corresponds to a perfect crystal image, calculate the Power Spectrum,
and Bragg-filter the image in the usual way, by selecting relevant spots in the Power
Spectrum and using a custom mask at each spot.
Then calculate the Peak Pairs using the usual commands (Find Peaks followed by Find Peak
Pairs). If we analyze the displacements, we can observe that the image of a perfect crystal is
shown distorted.
The distortion information that allows rectifying the perfect crystal image can be used to
correct distortions in any other image with the same distortion. In order to do so, we have to
the extract distortion information just selecting the Bragg image of the original crystal, and
applying the command Obtain Distortion Info.
14
HREM Research Inc.
PPA for DM Manual
This Distortion info image can be saved to disk and used in further analysis having the same
distortion.
In order to rectify the original image with the distortion information obtained from the perfect
crystal image, just apply the Correct Distortion on the Target Image using the Distortion
information obtained from the reference (Perfect Crystal), as follows:
1. Open the Correct Distortion dialog
2. Select the Target Image (Test Image)
3. Select the Distortion Info (Distortion Info of
Substrate)
15
HREM Research Inc.
PPA for DM Manual
This will produce a corrected image, where
all distortions due to the microscope have
been eliminated.
We can now proceed to analyze this image in
the usual way to get the final results:
1. Power Spectrum
2. Bragg Filtering
3. Find Peaks
4. Find Peak Pairs
5. Displacement Maps
6. Define reference
7. Strain maps
If we plot a horizontal profile across exx and a vertical one across eyy, we get the expected
results (exx=0.1 and eyy=0.05).
16
HREM Research Inc.
PPA for DM Manual
Additional functions
Lattice Analysis
Selecting the Bragg filtered image after Peak Pairs, displacements maps and strains
calculation, and using the Analyze lattice points command will generate a spreadsheet
including the following columns (one row for each each lattice peak):
- Peak position at subpixel resolution (x,y coordinates)
- Peak intensity (gray level)
- Atomic column strain tensor (exx,eyy,exy and eyx).
It is also possible to get a histogram from the Spreadsheet by using the Histogram from
Spreadsheet command, thus obtaining a different histogram for each column in the
spreadsheet.
17
HREM Research Inc.
PPA for DM Manual
Analyze column positions
Once Peak Pairs have been located, it is possible to analyze column positions with respect to
its relative position within the grid. This is very useful when more than one atomic column is
present for each lattice point. For example, in the case of zincblende materials in the [110]
direction, we can evaluate peak intensities at cation and/or anion column positions. In order to
do so, go through the following steps:
- Calculate Peak Pairs in the usual way
- Use the rectangleROI tool to choose the
area of interest in the original image
- Choose the point(s) of interest inside the
image (i.e. any local maxima of intensity)
- Apply the Analyze Column Positions
command
- Select the image and Bragg Filtered
images in the corresponding dialog
Then, the user will have the option to
decide between calculating the distances
from the checked point to other points, or
the angles subtended by two adjacent
points. The results will be shown in the
image, and the peak intensity at each point
will be stored in a datasheet.
The number of columns in the datasheet will be equal to the number of points of interest
chosen by the user.
18
HREM Research Inc.
PPA for DM Manual
Create Vector maps
It is possible to create vector maps from strain maps. To do so, just select the Create Vector
Maps command after a complete strain analysis has been made. Then, select two strain maps
in order to determine the associated vector map.
19
HREM Research Inc.
PPA for DM Manual
Adaptive Wiener Filtering
The Wiener filter is widely used for image restoration and calculates the optimal filter for the
removal of noise from a signal which is corrupted by the measuring process itself. It assumes
that if noise is present in the system, then it is considered to be additive white Gaussian noise.
After selecting the original image, and applying the Adaptive Wiener Filter in the menu, the
user should decide the size of the windows used for calculating the Adaptive Average and the
Noise Estimation, as follows:
In a typical Peak Pairs session, if Wiener filtering is desired, it is usually the first operation to
be applied to the original image. The result of the Wiener filtering operation on PPA Test1
image and respective Power Spectra (Adaptive Average =3, Noise Estimation=3) is depicted
below.
20
HREM Research Inc.
PPA for DM Manual
Low Pass Filtering
In order to generate a Low-Pass filtered image, we simply select the input image and use the
Low Pass Filter command in the menu. The strength of the filter is defined by the radius of
the mask in pixels (the highest the radius, the strongest the filter):
In the following figure, the resulting images after the application of a Low-Pass filter to the
lower left part of PPA Test1 image with different radius are shown:
Original image
(right-lower corner only)
Low Pass Filtered
(radius=0.8 pixels)
21
Low Pass Filtered
(radius=1.6 pixels)
HREM Research Inc.
PPA for DM Manual
Setting the Reference Base Vectors manually
It is possible to manually set the reference base vectors. In order to do so, we need a filtered
image to reduce a random noise, obtained using available options (Bragg, Adaptive Wiener or
Low-Pass filtering).
Once a filtered image has been selected, to
manually define the Reference Base vectors,
use the Mouse Tool to select 3 points in the
order (origin of both vectors, terminal point
of vector 1, terminal point of vector 2), so
that the directions of the desired reference
base vectors are described approximately by
the directions of vectors
and
.
Approximate directions
as described by the user
The precise magnitude and direction of both reference base vectors are calculated, when
applying the Set Reference Base Vectors command, as the average of all the vectors included
in the parallelogram described by these 3 points having their extremes at intensity maxima
peaks and the same approximate directions.
Reference Base Vectors
(average of all vectors in this area)
22
HREM Research Inc.
PPA for DM Manual
Image rectification
This option allows the user to rectify an image of a perfect crystal, using Peak Pairs
information.
Open the image “Substrate.dm3”, which corresponds to a perfect crystal image and calculate
the Power Spectrum.
Bragg-filter the image in the usual way, by selecting three spots in the Power Spectrum and
using a custom mask at each spot.
Then calculate the Peak Pairs using the usual
commands (Find Peaks followed by Find
Peak Pairs)
Then calculate the displacements using
Displacement Maps
The information contained in the resulting
displacements is dominated by the
geometrical distortions.
Given that the image corresponds to a perfect crystal, we can get a rectified image. In order to
do that, just select the Bragg Filtered image and apply the Rectify image command.
23
HREM Research Inc.
PPA for DM Manual
This will produce a rectified image of the perfect crystal using the local distortions at each
point of the image. To verify this point, apply a complete analysis process to the rectified
image (Power Spectrum-Bragg Filter-Find Peaks-Find Peak Pairs-Displacements Maps), we
observe that distortions have been corrected.
24
HREM Research Inc.
PPA for DM Manual
Appendix
Some useful DM tricks
DM ROI tool:
Hint: to select a square area, hold down SHIFT.
To select powers of two, hold down SHIFT-ALT.
DM zoom tool:
Hint: to demagnify, press ALT.
HREM Mouse tool
Hint: to delete any spot, just
click on the mouse mark with
the SHIFT key down.
.
DM Image Display Option
Hint: to change the color map
of any image, press the right
mouse button on it, select
ImageDisplay, and modify the
options as desired.
For example, it is useful to set
manually the range of the
colormaps to be the same, so as
to be able to compare them.
.
25
HREM Research Inc.
PPA for DM Manual
Quick Reference Guide
The PPA Main Menu
The commands in the PPA menu are described below.
Command
Power Spectrum
Bragg Filter…
Find Peaks...
Find Peak Pairs
Displacement Maps
Description
Calculates the Fourier transform of the front most
image.and displays the power at each frequency
(commonly called the Power Spectrum).
Calculates Bragg Filter for the spots selected in the
Power Spectrum. Shape and size of the masks can
be defined by the user.
Note: spots should be selected previously in the
Power Spectrum using the Mouse Tool.
Locates peaks of intensity in a filtered image. A
threshold for the minimum allowed peak intensity and
a minimum distance for peaks can be defined.
Calculates pairs of peaks along two basis vectors
automatically chosen from the first user selected
Bragg spots
Generates horizontal and vertical displacements
along the two directions defined by the basis vectors
26
HREM Research Inc.
PPA for DM Manual
Define Reference
Strain Map...
Repeat Project
(see sub menus)
Project
(see sub menus)
Image Group
Adaptive Wiener Filter...
Low Pass Filter...
Set Reference Base
Vectors
Peak Histogram...
Analyze Lattice Points
Analyze Column
Positions...
Histogram from
Spreadsheet
Create Vector Map...
Distortion Correction
(see sub menus)
Changes the displacement values, so as to obtain a
uniform displacement in the chosen area.
Note: the area should be selected previously using
the ROI tool on any displacement image
Calculates strain maps (exx,eyy,exy and eyx) at any
desired angle.
Allows strain images and other output to be
generated directly from the front most HREM image,
exactly as for a previous project. Also allows to save
details of the current project for later use (even in
other sessions of DM).
Menu to manage all the images in a particular
project.
Menu to close or save groups of images within a
particular project.
Calculates and applies an adaptive Wiener filter for
the removal of noise from the image.
Calculates and applies a Low Pass filter to the image
It allows to manually set the reference base vectors
on a Bragg or Low-pass filtered image
It calculates a histogram of peaks intensities, helping
the user to determine a precise value for Peak
Threshold
Generates a spreadsheet of data (peak position,
peak intensities, strain values) for each peak
Analyzes column positions with respect to its relative
position within the grid
Calculates a different histogram for each column in
the spreadsheet
Create vector maps after a complete strain analysis
It eliminates systematic distortions present in the
image
Bragg Filter Dialog
The components of the dialog are described below.
Dialog
Component
Description
27
HREM Research Inc.
PPA for DM Manual
Project Name
Size
Smoothing Width
Oval Ratio
Direction
Name given to the group of images and results
Defines mask radius of hard cut-off (beyond which
values are set to zero).
Specifies mask smoothing width in pixels
Defines the shape of the oval, as major to minor axis
ratio
Sets the prescribed masks angle, in degrees
Find Peaks Dialog
Dialog
Component
Invert Peaks
Description
It allows the user to calculate intensity minima
(instead of maxima)
Peak Threshold
Specifies a minimum for the intensity of allowed
peaks
Minimum Peak Distance Specifies a minimum distance between allowed
peaks
Strain Map Dialog
Dialog
Option
Angle of x-axis to
horizontal
Description
Specifies the angle of the direction to be considered x
axis.
You can specify the orientation of the x-axis by
placing a Line ROI on the HREM image. In this case,
28
HREM Research Inc.
PPA for DM Manual
the angle of the Line ROI appears here automatically.
Note: If angle is set equal to 0, horizontal and vertical
directions are assumed to be x and y coordinate axis
respectively.
Strain Matrix
Independent
Symmetric
Mean Dilatation
Rotation Angle
Overlay
Specifies the images to be shown
Images of du/dx, du/dy, dv/dx, dv/dy to be displayed
Images of εxx, εyy and εxy to be displayed.
Image of δxy to be displayed (average of εxx and εyy).
Image of ωxy to be displayed. Values in degrees and
anticlockwise positive.
Shows the strain at each atomic column, and
displayed as coloured dots over the original image
Repeat Project Sub-Menu
Component
Repeat Current Project
Description
Repeats the same operations as carried out in the
current project on the front most HREM image.
Repeat Saved Project
Repeats the same operations as carried out in a
saved project on the front most HREM image.
Save Current Project As Saves the details of the current project for later use.
Clean up Project List
Removes project details.
Repeat Current Project Dialog
Dialog
Component
New Project
Find Peaks
Description
Defines the name of the new project.
Repeats Find Peaks Operation.
29
HREM Research Inc.
PPA for DM Manual
Find Peak Pairs
Displacement Maps
Strain Map
Repeats Find Peak Pairs Operation.
Repeats Displacement Maps Operation.
Repeats Strain Map Operation.
Repeat Saved Project Dialog
Dialog
Component
New Project
Repeat Project
Find Peaks
Find Peak Pairs
Displacement Maps
Strain Map
Description
Defines the name of the new project.
Choose the name of the saved project.
Repeats Find Peaks Operation.
Repeats Find Peak Pairs Operation.
Repeats Displacement Maps Operation.
Repeats Strain Map Operation.
Save Current Project As... Dialog
Dialog
Component
Project Name
Description
Defines the name of the save project.
Clean up Project List... Dialog
Dialog
30
HREM Research Inc.
PPA for DM Manual
Component
Project
Description
Chooses a project name to remove from the project
list.
Project Sub-Menu
Component
Hide
Show
Save
Close
Description
Hides all the images in a project.
Shows all the images in a hidden project.
Saves all the images in a project (with save dialog
window).
Closes all the images in a project without saving.
Adaptive Wiener Filter Dialog
Dialog
Component
New Project
Adaptive Average
Noise Estimation
Description
Name given to the group of images and results
Window size [(2N+1)x(2N+1) pixels] to be used in the
calculation of the adaptive average
Window size [(2N+1)x(2N+1) pixels] to be used in the
calculation of the noise estimation
Low Pass Filter Dialog
Dialog
31
HREM Research Inc.
PPA for DM Manual
Component
New Project
Radius(pixel)
Description
Name given to the group of images and results
The radius of the mask in pixels
Peak Histogram Dialog
Dialog
Component
Invert Peaks
Description
It allows the user to calculate intensity minima
histograms (instead of maxima)
Minimum Peak Distance Specifies a minimum distance between allowed
peaks
Analyze Column Positions Dialog
The user will have the option to decide the distances and/or angles to be evaluated.
Distance Tab
The number of each check box corresponds to the assigned number to the mouse
click. All the distance(s) from the checked point to other points will be calculated.
Angle Tab
The number of each check box corresponds to the assigned number to the mouse
click. All possible angle(s) whose vertex corresponds to the checked point will be
calculated.
32
HREM Research Inc.
PPA for DM Manual
Distortion Correction Sub-Menu
Command
Correct Distortion
Obtain Distortion Info
Rectify Image...
Description
Rectifies any distorted image using the distortion
information obtained previously from an undistorted
sample using the “Obtain Distortion Info” command
below.
Extracts distortion information from the Bragg image
of an undistorted crystal after calculating Peak Pairs.
This information will be used by the “Correct
Distortion” command above.
Rectifies an image of an undistorted crystal after
calculating Peak Pairs.
Default basis vector are automatically chosen from
the first and second selected Bragg spots. Basis
vectors can also be manually specified/modified by
the user.
Rectify Image Dialog
Dialog
Component
Length
Angle
Description
Length of base vector considered for image
rectification, measured in pixels
Angle of base vector considered for image
rectification, measured in degrees
33
HREM Research Inc.