1
MONITORING
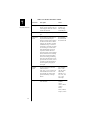
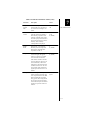
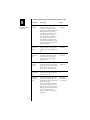
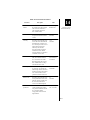
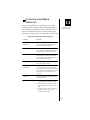
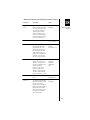
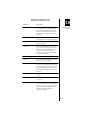
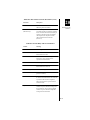
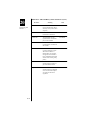
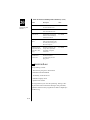
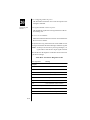
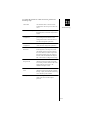
The Monitor command provides a live data trace of X.25,
frame relay, and Telnet/IP calls, providing you with information on frames and packets sent and received. You can request
a limited amount of information (such as link level only or
data packets only) and ask that the trace apply only to certain
logical channels, DLCIs, or IP addresses and port numbers.
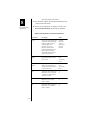
By default, all information and the first 100 bytes of data are
displayed. The Monitor command can also show you information for other types of calls (such as PPP), but disassembly
is not provided.
20
Monitoring and
Statistics
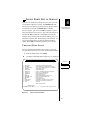
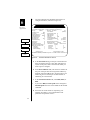
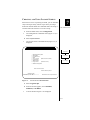
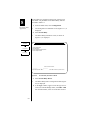
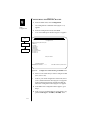
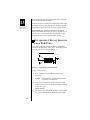
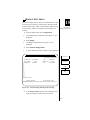
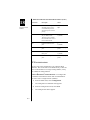
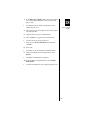
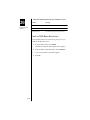
To use the Monitor command:
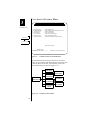
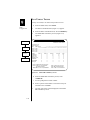
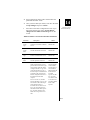
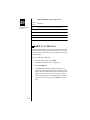
1. From the Main menu, select Status.
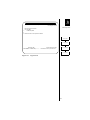
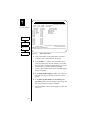
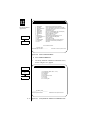
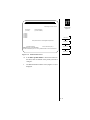
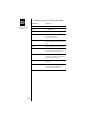
The Status Commands menu (Figure 20-1) is
displayed.
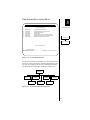
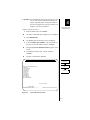
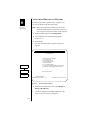
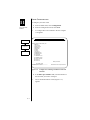
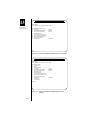
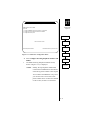
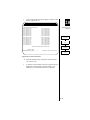
2. Select Monitoring.
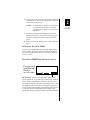
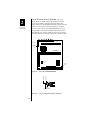
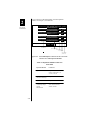
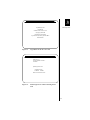
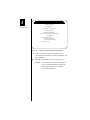
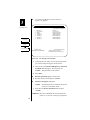
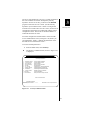
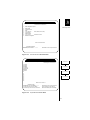
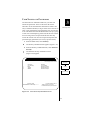
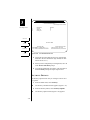
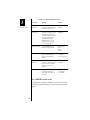
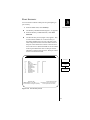
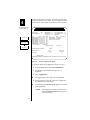
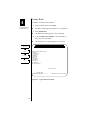
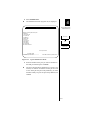
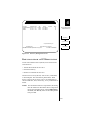
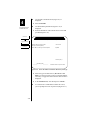
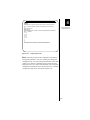
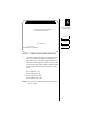
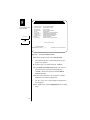
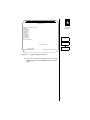
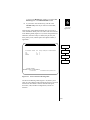
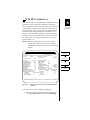
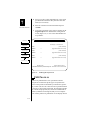
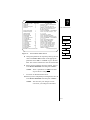
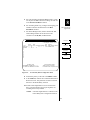
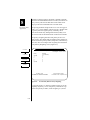
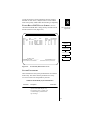
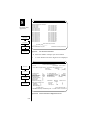
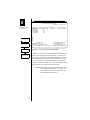
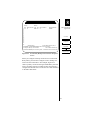
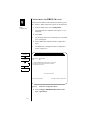
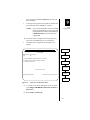
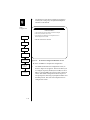
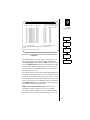
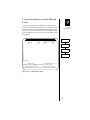
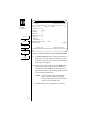
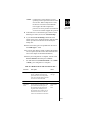
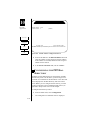
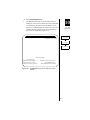
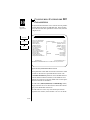
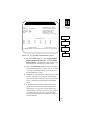
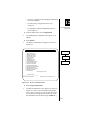
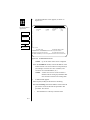
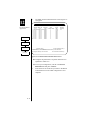
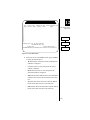
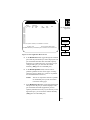
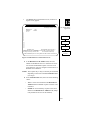
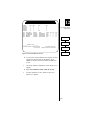
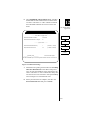
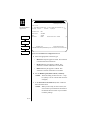
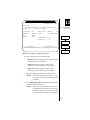
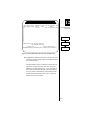
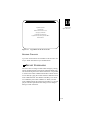
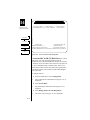
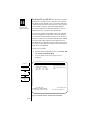
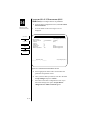
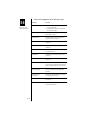
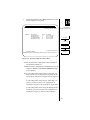
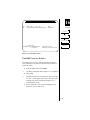
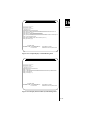
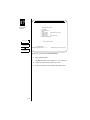
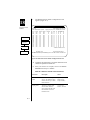
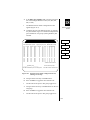
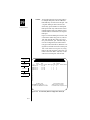
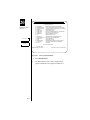
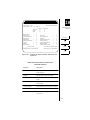
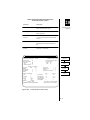
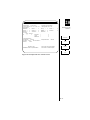
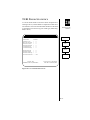
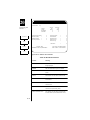
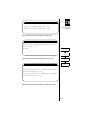
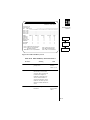
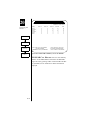
The Monitoring screen, shown in Figure 20-23, is
displayed.
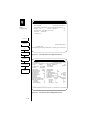
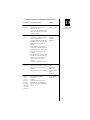
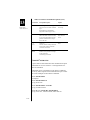
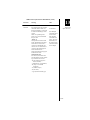
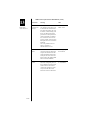
Main Menu
MOnitor
P;S
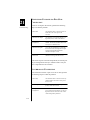
Display TX and RX frames for ports
P is port #
S is any of the following separated by commas:
#<lines>
-- maximum lines displayed per packet
<chan>—<chan> -- only selected channels
ALL
-- all frames/packets
ASCII
-- dump data in ASCII
LINK
-- X.25 layer 2 frames
PACKET
-- X.25 layer 3 packets
DATA
-- X.25 DATA and RR packets/frames
NODATA
-- X.25 non-DATA, RR packets/frames
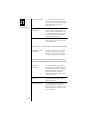
TL<socket>
-- Filter on local TCP socket
TA<socket>
-- Filter on all TCP traffic on socket
IP<IP addr>
-- Filter IP traffic by address
IPR<IP addr>
-- Filter received IP traffic by address
IPT<IP addr>
-- Filter transmitted IP traffic by address
REL or DIFF
-- Display relative or differential time in seconds
NONUM
-- Do not display frame numbers
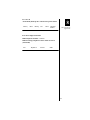
EX: "MO1;1000" monitor port 1, DLCI 1000
[ESC]
Quit monitor, [CR]
Status
Monitoring
Pause monitor display
ready:
Figure 20-23 Monitoring Screen
20-37