1
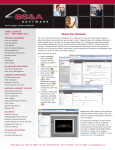
Upon disconnection of the USB cable the CsenseCO2 will begin logging when the
cable to the sensor is connected. The logger will halt logging when this cable is
disconnected.
2.3 CsenseCO2Plot
Begin program operation by clicking on CsenseCO2Plot.jar. Software presents the
screen shown below.
CsenseCO2Plot plots the files recorded by the CsenseCO2 Logger. The software
reads all CsenseCO2 files in a folder, except the CAT.txt file. The software will also
compute CO2 saturation from the voltage measured of the sensor. To do this
software must be given the sensor calibration. The sensor manufacturer supplies the
sensor calibration. If the Use Sensor Calibration is checked the plot will display
calibrated values. If not checked the plot will display sensor output in Volts.
Select the folder that contains the files recorded by CsenseCO2. If CsenseCO2Plot
is run directly from the CsenseCO2 the program will suggest the folder located on the
CsenseCO2. You may accept this by clicking on Process, or you may click on Select
Data Folder to browse to your computer’s hard drive. If the number of measurements
recorded is small, say a few thousand, these can conveniently be plotted directly from
CsenseCO2 storage. However it is best to copy large measurement sets to the host
computer and select them there since file access to on the CsenseCO2 Logger is
slow.
CsenseCO2 measurement folders must NOT contain any files besides those
CsenseCO2 records and the CAT.txt file.
Precision Measurement Engineering, Inc.
(760) 727-0300
www.pme.com
10