1
ModelSim® SE GUI Reference Manual
Software Version 10.2c
© 1991-2013 Mentor Graphics Corporation
All rights reserved.
This document contains information that is proprietary to Mentor Graphics Corporation. The original recipient of this
document may duplicate this document in whole or in part for internal business purposes only, provided that this entire
notice appears in all copies. In duplicating any part of this document, the recipient agrees to make every reasonable
effort to prevent the unauthorized use and distribution of the proprietary information.
This document is for information and instruction purposes. Mentor Graphics reserves the right to make
changes in specifications and other information contained in this publication without prior notice, and the
reader should, in all cases, consult Mentor Graphics to determine whether any changes have been
made.
The terms and conditions governing the sale and licensing of Mentor Graphics products are set forth in
written agreements between Mentor Graphics and its customers. No representation or other affirmation
of fact contained in this publication shall be deemed to be a warranty or give rise to any liability of Mentor
Graphics whatsoever.
MENTOR GRAPHICS MAKES NO WARRANTY OF ANY KIND WITH REGARD TO THIS MATERIAL
INCLUDING, BUT NOT LIMITED TO, THE IMPLIED WARRANTIES OF MERCHANTABILITY AND
FITNESS FOR A PARTICULAR PURPOSE.
MENTOR GRAPHICS SHALL NOT BE LIABLE FOR ANY INCIDENTAL, INDIRECT, SPECIAL, OR
CONSEQUENTIAL DAMAGES WHATSOEVER (INCLUDING BUT NOT LIMITED TO LOST PROFITS)
ARISING OUT OF OR RELATED TO THIS PUBLICATION OR THE INFORMATION CONTAINED IN IT,
EVEN IF MENTOR GRAPHICS HAS BEEN ADVISED OF THE POSSIBILITY OF SUCH DAMAGES.
U.S. GOVERNMENT LICENSE RIGHTS: The software and documentation were developed entirely at
private expense and are commercial computer software and commercial computer software
documentation within the meaning of the applicable acquisition regulations. Accordingly, pursuant to
FAR 48 CFR 12.212 and DFARS 48 CFR 227.7202, use, duplication and disclosure by or for the U.S.
Government or a U.S. Government subcontractor is subject solely to the terms and conditions set forth
in the license agreement provided with the software, except for provisions which are contrary to
applicable mandatory federal laws.
TRADEMARKS: The trademarks, logos and service marks ("Marks") used herein are the property of
Mentor Graphics Corporation or other parties. No one is permitted to use these Marks without the prior
written consent of Mentor Graphics or the owner of the Mark, as applicable. The use herein of a thirdparty Mark is not an attempt to indicate Mentor Graphics as a source of a product, but is intended to
indicate a product from, or associated with, a particular third party. A current list of Mentor Graphics’
trademarks may be viewed at: www.mentor.com/trademarks.
Mentor Graphics Corporation
8005 S.W. Boeckman Road, Wilsonville, Oregon 97070-7777
Telephone: 503.685.7000
Toll-Free Telephone: 800.592.2210
Website: www.mentor.com
SupportNet: supportnet.mentor.com/
Send Feedback on Documentation: supportnet.mentor.com/doc_feedback_form
Table of Contents
Chapter 1
Overview . . . . . . . . . . . . . . . . . . . . . . . . . . . . . . . . . . . . . . . . . . . . . . . . . . . . . . . . . . . . . . . . .
General GUI Tasks . . . . . . . . . . . . . . . . . . . . . . . . . . . . . . . . . . . . . . . . . . . . . . . . . . . . . . . .
Window Management. . . . . . . . . . . . . . . . . . . . . . . . . . . . . . . . . . . . . . . . . . . . . . . . . . . . .
Column-Based Windows . . . . . . . . . . . . . . . . . . . . . . . . . . . . . . . . . . . . . . . . . . . . . . . . . .
Bookmarks . . . . . . . . . . . . . . . . . . . . . . . . . . . . . . . . . . . . . . . . . . . . . . . . . . . . . . . . . . . . .
Scribble Mode. . . . . . . . . . . . . . . . . . . . . . . . . . . . . . . . . . . . . . . . . . . . . . . . . . . . . . . . . . .
Font Management . . . . . . . . . . . . . . . . . . . . . . . . . . . . . . . . . . . . . . . . . . . . . . . . . . . . . . . .
Find and Filter Functions . . . . . . . . . . . . . . . . . . . . . . . . . . . . . . . . . . . . . . . . . . . . . . . . . .
General Visual Elements . . . . . . . . . . . . . . . . . . . . . . . . . . . . . . . . . . . . . . . . . . . . . . . . . . . .
Elements of the Main Window . . . . . . . . . . . . . . . . . . . . . . . . . . . . . . . . . . . . . . . . . . . . . .
Design Object Icons and Their Meanings. . . . . . . . . . . . . . . . . . . . . . . . . . . . . . . . . . . . . .
Window Time Display . . . . . . . . . . . . . . . . . . . . . . . . . . . . . . . . . . . . . . . . . . . . . . . . . . . .
17
17
18
20
20
24
25
25
30
30
37
38
Chapter 2
Menus . . . . . . . . . . . . . . . . . . . . . . . . . . . . . . . . . . . . . . . . . . . . . . . . . . . . . . . . . . . . . . . . . . . .
Window-specific Menu . . . . . . . . . . . . . . . . . . . . . . . . . . . . . . . . . . . . . . . . . . . . . . . . . . . . .
File Menu . . . . . . . . . . . . . . . . . . . . . . . . . . . . . . . . . . . . . . . . . . . . . . . . . . . . . . . . . . . . . . . .
Edit Menu. . . . . . . . . . . . . . . . . . . . . . . . . . . . . . . . . . . . . . . . . . . . . . . . . . . . . . . . . . . . . . . .
View Menu. . . . . . . . . . . . . . . . . . . . . . . . . . . . . . . . . . . . . . . . . . . . . . . . . . . . . . . . . . . . . . .
Compile Menu . . . . . . . . . . . . . . . . . . . . . . . . . . . . . . . . . . . . . . . . . . . . . . . . . . . . . . . . . . . .
Simulate Menu . . . . . . . . . . . . . . . . . . . . . . . . . . . . . . . . . . . . . . . . . . . . . . . . . . . . . . . . . . . .
Add Menu . . . . . . . . . . . . . . . . . . . . . . . . . . . . . . . . . . . . . . . . . . . . . . . . . . . . . . . . . . . . . . .
Tools Menu . . . . . . . . . . . . . . . . . . . . . . . . . . . . . . . . . . . . . . . . . . . . . . . . . . . . . . . . . . . . . .
Layout Menu . . . . . . . . . . . . . . . . . . . . . . . . . . . . . . . . . . . . . . . . . . . . . . . . . . . . . . . . . . . . .
Bookmarks Menu. . . . . . . . . . . . . . . . . . . . . . . . . . . . . . . . . . . . . . . . . . . . . . . . . . . . . . . . . .
Window Menu . . . . . . . . . . . . . . . . . . . . . . . . . . . . . . . . . . . . . . . . . . . . . . . . . . . . . . . . . . . .
Help Menu . . . . . . . . . . . . . . . . . . . . . . . . . . . . . . . . . . . . . . . . . . . . . . . . . . . . . . . . . . . . . . .
41
41
42
44
44
45
45
47
47
49
49
49
51
Chapter 3
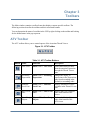
Toolbars . . . . . . . . . . . . . . . . . . . . . . . . . . . . . . . . . . . . . . . . . . . . . . . . . . . . . . . . . . . . . . . . . .
ATV Toolbar . . . . . . . . . . . . . . . . . . . . . . . . . . . . . . . . . . . . . . . . . . . . . . . . . . . . . . . . . . . . .
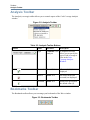
Analysis Toolbar . . . . . . . . . . . . . . . . . . . . . . . . . . . . . . . . . . . . . . . . . . . . . . . . . . . . . . . . . .
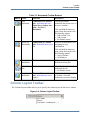
Bookmarks Toolbar . . . . . . . . . . . . . . . . . . . . . . . . . . . . . . . . . . . . . . . . . . . . . . . . . . . . . . . .
Column Layout Toolbar. . . . . . . . . . . . . . . . . . . . . . . . . . . . . . . . . . . . . . . . . . . . . . . . . . . . .
Compile Toolbar . . . . . . . . . . . . . . . . . . . . . . . . . . . . . . . . . . . . . . . . . . . . . . . . . . . . . . . . . .
Coverage Toolbar. . . . . . . . . . . . . . . . . . . . . . . . . . . . . . . . . . . . . . . . . . . . . . . . . . . . . . . . . .
Dataflow Toolbar . . . . . . . . . . . . . . . . . . . . . . . . . . . . . . . . . . . . . . . . . . . . . . . . . . . . . . . . . .
FSM Toolbar . . . . . . . . . . . . . . . . . . . . . . . . . . . . . . . . . . . . . . . . . . . . . . . . . . . . . . . . . . . . .
Help Toolbar . . . . . . . . . . . . . . . . . . . . . . . . . . . . . . . . . . . . . . . . . . . . . . . . . . . . . . . . . . . . .
Layout Toolbar. . . . . . . . . . . . . . . . . . . . . . . . . . . . . . . . . . . . . . . . . . . . . . . . . . . . . . . . . . . .
Memory Toolbar . . . . . . . . . . . . . . . . . . . . . . . . . . . . . . . . . . . . . . . . . . . . . . . . . . . . . . . . . .
53
53
54
54
55
56
57
58
59
60
61
61
ModelSim SE GUI Reference Manual, v10.2c
3
Table of Contents
Mode Toolbar. . . . . . . . . . . . . . . . . . . . . . . . . . . . . . . . . . . . . . . . . . . . . . . . . . . . . . . . . . . . .
Objectfilter Toolbar . . . . . . . . . . . . . . . . . . . . . . . . . . . . . . . . . . . . . . . . . . . . . . . . . . . . . . . .
Precision Toolbar . . . . . . . . . . . . . . . . . . . . . . . . . . . . . . . . . . . . . . . . . . . . . . . . . . . . . . . . . .
Process Toolbar . . . . . . . . . . . . . . . . . . . . . . . . . . . . . . . . . . . . . . . . . . . . . . . . . . . . . . . . . . .
Profile Toolbar . . . . . . . . . . . . . . . . . . . . . . . . . . . . . . . . . . . . . . . . . . . . . . . . . . . . . . . . . . . .
Schematic Toolbar . . . . . . . . . . . . . . . . . . . . . . . . . . . . . . . . . . . . . . . . . . . . . . . . . . . . . . . . .
Simulate Toolbar . . . . . . . . . . . . . . . . . . . . . . . . . . . . . . . . . . . . . . . . . . . . . . . . . . . . . . . . . .
Source Toolbar. . . . . . . . . . . . . . . . . . . . . . . . . . . . . . . . . . . . . . . . . . . . . . . . . . . . . . . . . . . .
Standard Toolbar . . . . . . . . . . . . . . . . . . . . . . . . . . . . . . . . . . . . . . . . . . . . . . . . . . . . . . . . . .
Step Toolbar. . . . . . . . . . . . . . . . . . . . . . . . . . . . . . . . . . . . . . . . . . . . . . . . . . . . . . . . . . . . . .
Wave Toolbar. . . . . . . . . . . . . . . . . . . . . . . . . . . . . . . . . . . . . . . . . . . . . . . . . . . . . . . . . . . . .
Wave Compare Toolbar. . . . . . . . . . . . . . . . . . . . . . . . . . . . . . . . . . . . . . . . . . . . . . . . . . . . .
Wave Cursor Toolbar. . . . . . . . . . . . . . . . . . . . . . . . . . . . . . . . . . . . . . . . . . . . . . . . . . . . . . .
Wave Edit Toolbar. . . . . . . . . . . . . . . . . . . . . . . . . . . . . . . . . . . . . . . . . . . . . . . . . . . . . . . . .
Wave Expand Time Toolbar . . . . . . . . . . . . . . . . . . . . . . . . . . . . . . . . . . . . . . . . . . . . . . . . .
Zoom Toolbar . . . . . . . . . . . . . . . . . . . . . . . . . . . . . . . . . . . . . . . . . . . . . . . . . . . . . . . . . . . .
Tabbed Toolbars . . . . . . . . . . . . . . . . . . . . . . . . . . . . . . . . . . . . . . . . . . . . . . . . . . . . . . . . . .
Window Specific Buttons . . . . . . . . . . . . . . . . . . . . . . . . . . . . . . . . . . . . . . . . . . . . . . . . . .
61
62
63
64
64
65
66
69
70
73
74
76
77
78
79
79
80
81
Chapter 4
Window Reference . . . . . . . . . . . . . . . . . . . . . . . . . . . . . . . . . . . . . . . . . . . . . . . . . . . . . . . . .
Assertions Window . . . . . . . . . . . . . . . . . . . . . . . . . . . . . . . . . . . . . . . . . . . . . . . . . . . . . . . .
Assertions Window Tasks. . . . . . . . . . . . . . . . . . . . . . . . . . . . . . . . . . . . . . . . . . . . . . . . . .
GUI Elements of the Assertions Window. . . . . . . . . . . . . . . . . . . . . . . . . . . . . . . . . . . . . .
ATV Window. . . . . . . . . . . . . . . . . . . . . . . . . . . . . . . . . . . . . . . . . . . . . . . . . . . . . . . . . . . . .
ATV Window Tasks . . . . . . . . . . . . . . . . . . . . . . . . . . . . . . . . . . . . . . . . . . . . . . . . . . . . . .
GUI Elements of the ATV Window . . . . . . . . . . . . . . . . . . . . . . . . . . . . . . . . . . . . . . . . . .
Call Stack Window . . . . . . . . . . . . . . . . . . . . . . . . . . . . . . . . . . . . . . . . . . . . . . . . . . . . . . . .
Call Stack Window Tasks. . . . . . . . . . . . . . . . . . . . . . . . . . . . . . . . . . . . . . . . . . . . . . . . . .
Related Commands of the Call Stack Window. . . . . . . . . . . . . . . . . . . . . . . . . . . . . . . . . .
GUI Elements of the Call Stack Window . . . . . . . . . . . . . . . . . . . . . . . . . . . . . . . . . . . . . .
Capacity Window. . . . . . . . . . . . . . . . . . . . . . . . . . . . . . . . . . . . . . . . . . . . . . . . . . . . . . . . . .
GUI Elements of the Capacity Window . . . . . . . . . . . . . . . . . . . . . . . . . . . . . . . . . . . . . . .
Class Graph Window . . . . . . . . . . . . . . . . . . . . . . . . . . . . . . . . . . . . . . . . . . . . . . . . . . . . . . .
Class Graph Window Tasks . . . . . . . . . . . . . . . . . . . . . . . . . . . . . . . . . . . . . . . . . . . . . . . .
GUI Elements of the Class Graph Window . . . . . . . . . . . . . . . . . . . . . . . . . . . . . . . . . . . .
Class Instances Window . . . . . . . . . . . . . . . . . . . . . . . . . . . . . . . . . . . . . . . . . . . . . . . . . . . .
GUI Elements of the Class Instances Window . . . . . . . . . . . . . . . . . . . . . . . . . . . . . . . . . .
Class Tree Window . . . . . . . . . . . . . . . . . . . . . . . . . . . . . . . . . . . . . . . . . . . . . . . . . . . . . . . .
GUI Elements of the Class Tree Window. . . . . . . . . . . . . . . . . . . . . . . . . . . . . . . . . . . . . .
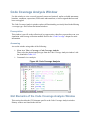
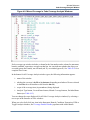
Code Coverage Analysis Window . . . . . . . . . . . . . . . . . . . . . . . . . . . . . . . . . . . . . . . . . . . . .
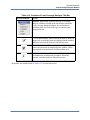
GUI Elements of the Code Coverage Analysis Window . . . . . . . . . . . . . . . . . . . . . . . . . .
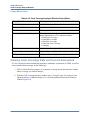
Viewing Code Coverage Data and Current Exclusions . . . . . . . . . . . . . . . . . . . . . . . . . . .
Cover Directives Window . . . . . . . . . . . . . . . . . . . . . . . . . . . . . . . . . . . . . . . . . . . . . . . . . . .
GUI Elements of the Cover Directives Window . . . . . . . . . . . . . . . . . . . . . . . . . . . . . . . .
Cover Directives Window Tasks . . . . . . . . . . . . . . . . . . . . . . . . . . . . . . . . . . . . . . . . . . . .
Coverage Details Window . . . . . . . . . . . . . . . . . . . . . . . . . . . . . . . . . . . . . . . . . . . . . . . . . . .
Covergroups Window . . . . . . . . . . . . . . . . . . . . . . . . . . . . . . . . . . . . . . . . . . . . . . . . . . . . . .
83
86
86
86
91
92
92
95
95
96
96
97
97
100
100
101
102
103
104
104
106
106
108
111
111
112
114
119
4
ModelSim SE GUI Reference Manual, v10.2c
Table of Contents
GUI Elements of the Covergroups Window. . . . . . . . . . . . . . . . . . . . . . . . . . . . . . . . . . . .
Covergroups Window Tasks. . . . . . . . . . . . . . . . . . . . . . . . . . . . . . . . . . . . . . . . . . . . . . . .
Dataflow Window . . . . . . . . . . . . . . . . . . . . . . . . . . . . . . . . . . . . . . . . . . . . . . . . . . . . . . . . .
Dataflow Window Tasks. . . . . . . . . . . . . . . . . . . . . . . . . . . . . . . . . . . . . . . . . . . . . . . . . . .
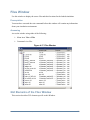
Files Window . . . . . . . . . . . . . . . . . . . . . . . . . . . . . . . . . . . . . . . . . . . . . . . . . . . . . . . . . . . . .
GUI Elements of the Files Window . . . . . . . . . . . . . . . . . . . . . . . . . . . . . . . . . . . . . . . . . .
FSM List Window . . . . . . . . . . . . . . . . . . . . . . . . . . . . . . . . . . . . . . . . . . . . . . . . . . . . . . . . .
GUI Elements of the FSM List Window . . . . . . . . . . . . . . . . . . . . . . . . . . . . . . . . . . . . . .
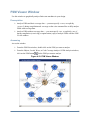
FSM Viewer Window . . . . . . . . . . . . . . . . . . . . . . . . . . . . . . . . . . . . . . . . . . . . . . . . . . . . . .
FSM Viewer Window Tasks. . . . . . . . . . . . . . . . . . . . . . . . . . . . . . . . . . . . . . . . . . . . . . . .
GUI Elements of the FSM Viewer Window. . . . . . . . . . . . . . . . . . . . . . . . . . . . . . . . . . . .
Instance Coverage Window . . . . . . . . . . . . . . . . . . . . . . . . . . . . . . . . . . . . . . . . . . . . . . . . . .
Instance Coverage Window Tasks . . . . . . . . . . . . . . . . . . . . . . . . . . . . . . . . . . . . . . . . . . .
GUI Elements of the Instance Coverage Window . . . . . . . . . . . . . . . . . . . . . . . . . . . . . . .
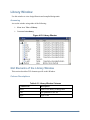
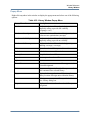
Library Window. . . . . . . . . . . . . . . . . . . . . . . . . . . . . . . . . . . . . . . . . . . . . . . . . . . . . . . . . . .
GUI Elements of the Library Window . . . . . . . . . . . . . . . . . . . . . . . . . . . . . . . . . . . . . . . .
List Window. . . . . . . . . . . . . . . . . . . . . . . . . . . . . . . . . . . . . . . . . . . . . . . . . . . . . . . . . . . . . .
List Window Tasks . . . . . . . . . . . . . . . . . . . . . . . . . . . . . . . . . . . . . . . . . . . . . . . . . . . . . . .
GUI Elements of the List Window . . . . . . . . . . . . . . . . . . . . . . . . . . . . . . . . . . . . . . . . . . .
Locals Window . . . . . . . . . . . . . . . . . . . . . . . . . . . . . . . . . . . . . . . . . . . . . . . . . . . . . . . . . . .
Locals Window Tasks. . . . . . . . . . . . . . . . . . . . . . . . . . . . . . . . . . . . . . . . . . . . . . . . . . . . .
GUI Elements of the Locals Window. . . . . . . . . . . . . . . . . . . . . . . . . . . . . . . . . . . . . . . . .
Memory Data Window . . . . . . . . . . . . . . . . . . . . . . . . . . . . . . . . . . . . . . . . . . . . . . . . . . . . .
Memory Data Window Tasks . . . . . . . . . . . . . . . . . . . . . . . . . . . . . . . . . . . . . . . . . . . . . . .
GUI Elements of the Memory Data Window . . . . . . . . . . . . . . . . . . . . . . . . . . . . . . . . . . .
Memory List Window . . . . . . . . . . . . . . . . . . . . . . . . . . . . . . . . . . . . . . . . . . . . . . . . . . . . . .
Memory List Window Tasks . . . . . . . . . . . . . . . . . . . . . . . . . . . . . . . . . . . . . . . . . . . . . . .
GUI Elements of the Memory List Window. . . . . . . . . . . . . . . . . . . . . . . . . . . . . . . . . . . .
Message Viewer Window . . . . . . . . . . . . . . . . . . . . . . . . . . . . . . . . . . . . . . . . . . . . . . . . . . .
Message Viewer Window Tasks. . . . . . . . . . . . . . . . . . . . . . . . . . . . . . . . . . . . . . . . . . . . .
GUI Elements of the Message Viewer Window. . . . . . . . . . . . . . . . . . . . . . . . . . . . . . . . .
Objects Window. . . . . . . . . . . . . . . . . . . . . . . . . . . . . . . . . . . . . . . . . . . . . . . . . . . . . . . . . . .
Objects Window Tasks . . . . . . . . . . . . . . . . . . . . . . . . . . . . . . . . . . . . . . . . . . . . . . . . . . . .
GUI Elements of the Objects Window . . . . . . . . . . . . . . . . . . . . . . . . . . . . . . . . . . . . . . . .
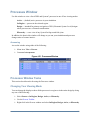
Processes Window . . . . . . . . . . . . . . . . . . . . . . . . . . . . . . . . . . . . . . . . . . . . . . . . . . . . . . . . .
Processes Window Tasks . . . . . . . . . . . . . . . . . . . . . . . . . . . . . . . . . . . . . . . . . . . . . . . . . .
GUI Elements of the Processes Window . . . . . . . . . . . . . . . . . . . . . . . . . . . . . . . . . . . . . .
Profiling Windows . . . . . . . . . . . . . . . . . . . . . . . . . . . . . . . . . . . . . . . . . . . . . . . . . . . . . . . . .
GUI Elements of the Profile Windows . . . . . . . . . . . . . . . . . . . . . . . . . . . . . . . . . . . . . . . .
Schematic Window . . . . . . . . . . . . . . . . . . . . . . . . . . . . . . . . . . . . . . . . . . . . . . . . . . . . . . . .
Schematic Window Tasks. . . . . . . . . . . . . . . . . . . . . . . . . . . . . . . . . . . . . . . . . . . . . . . . . .
GUI Elements of the Schematic Window. . . . . . . . . . . . . . . . . . . . . . . . . . . . . . . . . . . . . .
Source Window . . . . . . . . . . . . . . . . . . . . . . . . . . . . . . . . . . . . . . . . . . . . . . . . . . . . . . . . . . .
Opening Source Files . . . . . . . . . . . . . . . . . . . . . . . . . . . . . . . . . . . . . . . . . . . . . . . . . . . . .
Displaying Multiple Source Files . . . . . . . . . . . . . . . . . . . . . . . . . . . . . . . . . . . . . . . . . . . .
Dragging and Dropping Objects into the Wave and List Windows . . . . . . . . . . . . . . . . . .
Setting your Context by Navigating Source Files. . . . . . . . . . . . . . . . . . . . . . . . . . . . . . . .
Coverage Data in the Source Window . . . . . . . . . . . . . . . . . . . . . . . . . . . . . . . . . . . . . . . .
Debugging with Source Annotation . . . . . . . . . . . . . . . . . . . . . . . . . . . . . . . . . . . . . . . . . .
ModelSim SE GUI Reference Manual, v10.2c
120
122
124
125
129
129
132
132
135
136
139
142
142
143
148
148
150
151
167
170
170
171
173
173
174
176
178
179
182
183
184
190
191
194
196
196
199
201
203
206
207
212
215
216
216
217
217
220
223
5
Table of Contents
Accessing Textual Connectivity Information . . . . . . . . . . . . . . . . . . . . . . . . . . . . . . . . . . .
Language Templates . . . . . . . . . . . . . . . . . . . . . . . . . . . . . . . . . . . . . . . . . . . . . . . . . . . . . .
Setting File-Line Breakpoints with the GUI. . . . . . . . . . . . . . . . . . . . . . . . . . . . . . . . . . . .
Adding File-Line Breakpoints with the bp Command . . . . . . . . . . . . . . . . . . . . . . . . . . . .
Editing File-Line Breakpoints. . . . . . . . . . . . . . . . . . . . . . . . . . . . . . . . . . . . . . . . . . . . . . .
Setting Conditional Breakpoints . . . . . . . . . . . . . . . . . . . . . . . . . . . . . . . . . . . . . . . . . . . . .
Checking Object Values and Descriptions . . . . . . . . . . . . . . . . . . . . . . . . . . . . . . . . . . . . .
Marking Lines with Bookmarks . . . . . . . . . . . . . . . . . . . . . . . . . . . . . . . . . . . . . . . . . . . . .
Performing Incremental Search for Specific Code . . . . . . . . . . . . . . . . . . . . . . . . . . . . . . .
Customizing the Source Window . . . . . . . . . . . . . . . . . . . . . . . . . . . . . . . . . . . . . . . . . . . .
Structure Window . . . . . . . . . . . . . . . . . . . . . . . . . . . . . . . . . . . . . . . . . . . . . . . . . . . . . . . . .
Viewing the Structure Window . . . . . . . . . . . . . . . . . . . . . . . . . . . . . . . . . . . . . . . . . . . . .
Structure Window Tasks. . . . . . . . . . . . . . . . . . . . . . . . . . . . . . . . . . . . . . . . . . . . . . . . . . .
GUI Elements of the Structure Window. . . . . . . . . . . . . . . . . . . . . . . . . . . . . . . . . . . . . . .
Code Coverage in the Structure Window . . . . . . . . . . . . . . . . . . . . . . . . . . . . . . . . . . . . . .
Transaction View Window . . . . . . . . . . . . . . . . . . . . . . . . . . . . . . . . . . . . . . . . . . . . . . . . . .
Transcript Window . . . . . . . . . . . . . . . . . . . . . . . . . . . . . . . . . . . . . . . . . . . . . . . . . . . . . . . .
Displaying the Transcript Window. . . . . . . . . . . . . . . . . . . . . . . . . . . . . . . . . . . . . . . . . . .
Viewing Data in the Transcript Window . . . . . . . . . . . . . . . . . . . . . . . . . . . . . . . . . . . . . .
Saving the Transcript File. . . . . . . . . . . . . . . . . . . . . . . . . . . . . . . . . . . . . . . . . . . . . . . . . .
Colorizing the Transcript . . . . . . . . . . . . . . . . . . . . . . . . . . . . . . . . . . . . . . . . . . . . . . . . . .
Disabling Creation of the Transcript File . . . . . . . . . . . . . . . . . . . . . . . . . . . . . . . . . . . . . .
Performing an Incremental Search . . . . . . . . . . . . . . . . . . . . . . . . . . . . . . . . . . . . . . . . . . .
Using Automatic Command Help. . . . . . . . . . . . . . . . . . . . . . . . . . . . . . . . . . . . . . . . . . . .
Using drivers and Readers Command Results . . . . . . . . . . . . . . . . . . . . . . . . . . . . . . . . . .
Using Transcript Menu Items . . . . . . . . . . . . . . . . . . . . . . . . . . . . . . . . . . . . . . . . . . . . . . .
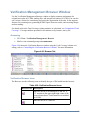
Verification Management Browser Window . . . . . . . . . . . . . . . . . . . . . . . . . . . . . . . . . . . . .
Verification Browser Window Tasks . . . . . . . . . . . . . . . . . . . . . . . . . . . . . . . . . . . . . . . . .
GUI Elements of the Verification Browser Window . . . . . . . . . . . . . . . . . . . . . . . . . . . . .
Watch Window . . . . . . . . . . . . . . . . . . . . . . . . . . . . . . . . . . . . . . . . . . . . . . . . . . . . . . . . . . .
Watch Window Tasks . . . . . . . . . . . . . . . . . . . . . . . . . . . . . . . . . . . . . . . . . . . . . . . . . . . . .
GUI Elements of the Watch Window . . . . . . . . . . . . . . . . . . . . . . . . . . . . . . . . . . . . . . . . .
Wave Window . . . . . . . . . . . . . . . . . . . . . . . . . . . . . . . . . . . . . . . . . . . . . . . . . . . . . . . . . . . .
Add Objects to the Wave Window . . . . . . . . . . . . . . . . . . . . . . . . . . . . . . . . . . . . . . . . . . .
Wave Window Panes . . . . . . . . . . . . . . . . . . . . . . . . . . . . . . . . . . . . . . . . . . . . . . . . . . . . .
Objects You Can View in the Wave Window . . . . . . . . . . . . . . . . . . . . . . . . . . . . . . . . . .
Wave Window Toolbar. . . . . . . . . . . . . . . . . . . . . . . . . . . . . . . . . . . . . . . . . . . . . . . . . . . .
225
226
229
230
231
233
235
236
236
237
239
239
240
244
251
253
254
254
254
254
255
256
256
257
257
258
259
260
260
266
267
267
271
271
272
278
279
Chapter 5
Keyboard Shortcuts and Mouse Actions . . . . . . . . . . . . . . . . . . . . . . . . . . . . . . . . . . . . . . .
........................................................................
Window Specific Keyboard Shortcuts. . . . . . . . . . . . . . . . . . . . . . . . . . . . . . . . . . . . . . . . . .
User Defined Keyboard Shortcuts . . . . . . . . . . . . . . . . . . . . . . . . . . . . . . . . . . . . . . . . . . . . .
The Keyboard Shortcuts Dialog Box . . . . . . . . . . . . . . . . . . . . . . . . . . . . . . . . . . . . . . . . .
Main and Source Window Mouse and Keyboard Shortcuts . . . . . . . . . . . . . . . . . . . . . . . . .
List of Keyboard Shortcuts in GUI Windows. . . . . . . . . . . . . . . . . . . . . . . . . . . . . . . . . . .
List Window Keyboard Shortcuts . . . . . . . . . . . . . . . . . . . . . . . . . . . . . . . . . . . . . . . . . . . . .
Wave Window Mouse and Keyboard Shortcuts . . . . . . . . . . . . . . . . . . . . . . . . . . . . . . . . . .
281
281
281
282
282
285
288
289
289
6
ModelSim SE GUI Reference Manual, v10.2c
Table of Contents
Chapter 6
GUI Customization . . . . . . . . . . . . . . . . . . . . . . . . . . . . . . . . . . . . . . . . . . . . . . . . . . . . . . . . .
Customizing the Simulator GUI Layout . . . . . . . . . . . . . . . . . . . . . . . . . . . . . . . . . . . . . . . .
Layout Mode Loading Priority . . . . . . . . . . . . . . . . . . . . . . . . . . . . . . . . . . . . . . . . . . . . . .
Configure Window Layouts Dialog Box . . . . . . . . . . . . . . . . . . . . . . . . . . . . . . . . . . . . . .
Creating a Custom Layout Mode . . . . . . . . . . . . . . . . . . . . . . . . . . . . . . . . . . . . . . . . . . . .
Changing Layout Mode Behavior. . . . . . . . . . . . . . . . . . . . . . . . . . . . . . . . . . . . . . . . . . . .
Resetting a Layout Mode to its Default . . . . . . . . . . . . . . . . . . . . . . . . . . . . . . . . . . . . . . .
Deleting a Custom Layout Mode . . . . . . . . . . . . . . . . . . . . . . . . . . . . . . . . . . . . . . . . . . . .
Configuring Default Windows for Restored Layouts. . . . . . . . . . . . . . . . . . . . . . . . . . . . .
Configuring the Column Layout. . . . . . . . . . . . . . . . . . . . . . . . . . . . . . . . . . . . . . . . . . . . .
User Defined Buttons and Menus . . . . . . . . . . . . . . . . . . . . . . . . . . . . . . . . . . . . . . . . . . . . .
User-Defined Radices . . . . . . . . . . . . . . . . . . . . . . . . . . . . . . . . . . . . . . . . . . . . . . . . . . . . . .
Using the radix define Command . . . . . . . . . . . . . . . . . . . . . . . . . . . . . . . . . . . . . . . . . . . .
293
293
293
294
294
294
295
295
295
296
297
299
299
Chapter 7
GUI Preferences . . . . . . . . . . . . . . . . . . . . . . . . . . . . . . . . . . . . . . . . . . . . . . . . . . . . . . . . . . .
Simulator GUI Preferences . . . . . . . . . . . . . . . . . . . . . . . . . . . . . . . . . . . . . . . . . . . . . . . . . .
Setting Preference Variables from the GUI . . . . . . . . . . . . . . . . . . . . . . . . . . . . . . . . . . . .
Setting Preference Variables from the Command Line . . . . . . . . . . . . . . . . . . . . . . . . . . .
Saving GUI Preferences . . . . . . . . . . . . . . . . . . . . . . . . . . . . . . . . . . . . . . . . . . . . . . . . . . .
The modelsim.tcl File . . . . . . . . . . . . . . . . . . . . . . . . . . . . . . . . . . . . . . . . . . . . . . . . . . . . .
GUI Preference Variables . . . . . . . . . . . . . . . . . . . . . . . . . . . . . . . . . . . . . . . . . . . . . . . . . . .
Wave Window Variables . . . . . . . . . . . . . . . . . . . . . . . . . . . . . . . . . . . . . . . . . . . . . . . . . .
Modifying Wave Window Variables from the Command Line . . . . . . . . . . . . . . . . . . . . .
305
305
305
307
308
308
310
310
312
Index
End-User License Agreement
ModelSim SE GUI Reference Manual, v10.2c
7
List of Examples
Example 6-1. Using the radix define Command . . . . . . . . . . . . . . . . . . . . . . . . . . . . . . . . . . 300
Example 6-2. Using radix define to Specify Color . . . . . . . . . . . . . . . . . . . . . . . . . . . . . . . . 301
8
ModelSim SE GUI Reference Manual, v10.2c
List of Figures
Figure 1-1. Graphical User Interface . . . . . . . . . . . . . . . . . . . . . . . . . . . . . . . . . . . . . . . . . . .
Figure 1-2. Window Header Handle . . . . . . . . . . . . . . . . . . . . . . . . . . . . . . . . . . . . . . . . . . .
Figure 1-3. Tab Handle . . . . . . . . . . . . . . . . . . . . . . . . . . . . . . . . . . . . . . . . . . . . . . . . . . . . .
Figure 1-4. Window Undock Button . . . . . . . . . . . . . . . . . . . . . . . . . . . . . . . . . . . . . . . . . . .
Figure 1-5. Manage Bookmarks Dialog Box . . . . . . . . . . . . . . . . . . . . . . . . . . . . . . . . . . . .
Figure 1-6. Bookmark Options Dialog Box. . . . . . . . . . . . . . . . . . . . . . . . . . . . . . . . . . . . . .
Figure 1-7. Scribble Mode . . . . . . . . . . . . . . . . . . . . . . . . . . . . . . . . . . . . . . . . . . . . . . . . . . .
Figure 1-8. Find Mode . . . . . . . . . . . . . . . . . . . . . . . . . . . . . . . . . . . . . . . . . . . . . . . . . . . . . .
Figure 1-9. Filter Mode . . . . . . . . . . . . . . . . . . . . . . . . . . . . . . . . . . . . . . . . . . . . . . . . . . . . .
Figure 1-10. Find Mode Popup Displaying Matches. . . . . . . . . . . . . . . . . . . . . . . . . . . . . . .
Figure 1-11. Find Options Popup Menu . . . . . . . . . . . . . . . . . . . . . . . . . . . . . . . . . . . . . . . .
Figure 1-12. Main Window of the GUI . . . . . . . . . . . . . . . . . . . . . . . . . . . . . . . . . . . . . . . . .
Figure 1-13. Main Window — Menu Bar . . . . . . . . . . . . . . . . . . . . . . . . . . . . . . . . . . . . . . .
Figure 1-14. Main Window — Toolbar Frame . . . . . . . . . . . . . . . . . . . . . . . . . . . . . . . . . . .
Figure 1-15. Main Window — Toolbar. . . . . . . . . . . . . . . . . . . . . . . . . . . . . . . . . . . . . . . . .
Figure 1-16. GUI Windows . . . . . . . . . . . . . . . . . . . . . . . . . . . . . . . . . . . . . . . . . . . . . . . . . .
Figure 1-17. GUI Tab Group . . . . . . . . . . . . . . . . . . . . . . . . . . . . . . . . . . . . . . . . . . . . . . . . .
Figure 1-18. Wave Window Panes . . . . . . . . . . . . . . . . . . . . . . . . . . . . . . . . . . . . . . . . . . . .
Figure 1-19. Main Window Status Bar . . . . . . . . . . . . . . . . . . . . . . . . . . . . . . . . . . . . . . . . .
Figure 1-20. Current Time Label . . . . . . . . . . . . . . . . . . . . . . . . . . . . . . . . . . . . . . . . . . . . .
Figure 1-21. Enter Current Time Value. . . . . . . . . . . . . . . . . . . . . . . . . . . . . . . . . . . . . . . . .
Figure 3-1. ATV Toolbar. . . . . . . . . . . . . . . . . . . . . . . . . . . . . . . . . . . . . . . . . . . . . . . . . . . .
Figure 3-2. Analysis Toolbar . . . . . . . . . . . . . . . . . . . . . . . . . . . . . . . . . . . . . . . . . . . . . . . . .
Figure 3-3. Bookmarks Toolbar. . . . . . . . . . . . . . . . . . . . . . . . . . . . . . . . . . . . . . . . . . . . . . .
Figure 3-4. Column Layout Toolbar . . . . . . . . . . . . . . . . . . . . . . . . . . . . . . . . . . . . . . . . . . .
Figure 3-5. Compile Toolbar . . . . . . . . . . . . . . . . . . . . . . . . . . . . . . . . . . . . . . . . . . . . . . . . .
Figure 3-6. Coverage Toolbar . . . . . . . . . . . . . . . . . . . . . . . . . . . . . . . . . . . . . . . . . . . . . . . .
Figure 3-7. Dataflow Toolbar . . . . . . . . . . . . . . . . . . . . . . . . . . . . . . . . . . . . . . . . . . . . . . . .
Figure 3-8. FSM Toolbar . . . . . . . . . . . . . . . . . . . . . . . . . . . . . . . . . . . . . . . . . . . . . . . . . . . .
Figure 3-9. Help Toolbar . . . . . . . . . . . . . . . . . . . . . . . . . . . . . . . . . . . . . . . . . . . . . . . . . . . .
Figure 3-10. Layout Toolbar . . . . . . . . . . . . . . . . . . . . . . . . . . . . . . . . . . . . . . . . . . . . . . . . .
Figure 3-11. Memory Toolbar . . . . . . . . . . . . . . . . . . . . . . . . . . . . . . . . . . . . . . . . . . . . . . . .
Figure 3-12. Mode Toolbar . . . . . . . . . . . . . . . . . . . . . . . . . . . . . . . . . . . . . . . . . . . . . . . . . .
Figure 3-13. Objectfilter Toolbar. . . . . . . . . . . . . . . . . . . . . . . . . . . . . . . . . . . . . . . . . . . . . .
Figure 3-14. Precision Toolbar . . . . . . . . . . . . . . . . . . . . . . . . . . . . . . . . . . . . . . . . . . . . . . .
Figure 3-15. Process Toolbar. . . . . . . . . . . . . . . . . . . . . . . . . . . . . . . . . . . . . . . . . . . . . . . . .
Figure 3-16. Profile Toolbar . . . . . . . . . . . . . . . . . . . . . . . . . . . . . . . . . . . . . . . . . . . . . . . . .
Figure 3-17. Schematic Toolbar . . . . . . . . . . . . . . . . . . . . . . . . . . . . . . . . . . . . . . . . . . . . . .
Figure 3-18. Simulate Toolbar. . . . . . . . . . . . . . . . . . . . . . . . . . . . . . . . . . . . . . . . . . . . . . . .
Figure 3-19. Show Cause Dropdown Menu . . . . . . . . . . . . . . . . . . . . . . . . . . . . . . . . . . . . .
ModelSim SE GUI Reference Manual, v10.2c
17
19
19
20
22
23
24
25
26
28
30
31
32
32
33
34
35
36
36
39
40
53
54
54
55
56
57
58
59
60
61
61
62
62
63
64
64
65
66
69
9
List of Figures
Figure 3-20. Source Toolbar . . . . . . . . . . . . . . . . . . . . . . . . . . . . . . . . . . . . . . . . . . . . . . . . .
Figure 3-21. Standard Toolbar. . . . . . . . . . . . . . . . . . . . . . . . . . . . . . . . . . . . . . . . . . . . . . . .
Figure 3-22. Add Selected to Window Dropdown Menu . . . . . . . . . . . . . . . . . . . . . . . . . . .
Figure 3-23. Step Toolbar . . . . . . . . . . . . . . . . . . . . . . . . . . . . . . . . . . . . . . . . . . . . . . . . . . .
Figure 3-24. Wave Toolbar . . . . . . . . . . . . . . . . . . . . . . . . . . . . . . . . . . . . . . . . . . . . . . . . . .
Figure 3-25. Wave Compare Toolbar . . . . . . . . . . . . . . . . . . . . . . . . . . . . . . . . . . . . . . . . . .
Figure 3-26. Wave Cursor Toolbar . . . . . . . . . . . . . . . . . . . . . . . . . . . . . . . . . . . . . . . . . . . .
Figure 3-27. Wave Edit Toolbar . . . . . . . . . . . . . . . . . . . . . . . . . . . . . . . . . . . . . . . . . . . . . .
Figure 3-28. Wave Expand Time Toolbar . . . . . . . . . . . . . . . . . . . . . . . . . . . . . . . . . . . . . . .
Figure 3-29. Zoom Toolbar . . . . . . . . . . . . . . . . . . . . . . . . . . . . . . . . . . . . . . . . . . . . . . . . . .
Figure 3-30. Tabbed Toolbars and Overflow Menu . . . . . . . . . . . . . . . . . . . . . . . . . . . . . . .
Figure 3-31. Window Specific Buttons . . . . . . . . . . . . . . . . . . . . . . . . . . . . . . . . . . . . . . . .
Figure 4-1. Assertions Window . . . . . . . . . . . . . . . . . . . . . . . . . . . . . . . . . . . . . . . . . . . . . . .
Figure 4-2. ATV Window . . . . . . . . . . . . . . . . . . . . . . . . . . . . . . . . . . . . . . . . . . . . . . . . . . .
Figure 4-3. Call Stack Window . . . . . . . . . . . . . . . . . . . . . . . . . . . . . . . . . . . . . . . . . . . . . . .
Figure 4-4. Capacity Window . . . . . . . . . . . . . . . . . . . . . . . . . . . . . . . . . . . . . . . . . . . . . . . .
Figure 4-5. Class Graph Window . . . . . . . . . . . . . . . . . . . . . . . . . . . . . . . . . . . . . . . . . . . . .
Figure 4-6. Class Instances Window . . . . . . . . . . . . . . . . . . . . . . . . . . . . . . . . . . . . . . . . . . .
Figure 4-7. Class Tree Window . . . . . . . . . . . . . . . . . . . . . . . . . . . . . . . . . . . . . . . . . . . . . . .
Figure 4-8. Code Coverage Analysis . . . . . . . . . . . . . . . . . . . . . . . . . . . . . . . . . . . . . . . . . .
Figure 4-9. Missed Coverage in Code Coverage Analysis Windows . . . . . . . . . . . . . . . . . .
Figure 4-10. Cover Directives Window. . . . . . . . . . . . . . . . . . . . . . . . . . . . . . . . . . . . . . . . .
Figure 4-11. Coverage Details Window Showing Expression Truth Table . . . . . . . . . . . . .
Figure 4-12. Coverage Details Window Showing Toggle Details . . . . . . . . . . . . . . . . . . . .
Figure 4-13. Coverage Details Window Showing FSM Details . . . . . . . . . . . . . . . . . . . . . .
Figure 4-14. Covergroups Window . . . . . . . . . . . . . . . . . . . . . . . . . . . . . . . . . . . . . . . . . . . .
Figure 4-15. Dataflow Window . . . . . . . . . . . . . . . . . . . . . . . . . . . . . . . . . . . . . . . . . . . . . . .
Figure 4-16. Dataflow Window and Panes . . . . . . . . . . . . . . . . . . . . . . . . . . . . . . . . . . . . . .
Figure 4-17. Files Window . . . . . . . . . . . . . . . . . . . . . . . . . . . . . . . . . . . . . . . . . . . . . . . . . .
Figure 4-18. FSM List Window. . . . . . . . . . . . . . . . . . . . . . . . . . . . . . . . . . . . . . . . . . . . . . .
Figure 4-19. FSM Viewer Window . . . . . . . . . . . . . . . . . . . . . . . . . . . . . . . . . . . . . . . . . . . .
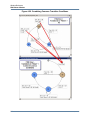
Figure 4-20. Combining Common Transition Conditions. . . . . . . . . . . . . . . . . . . . . . . . . . .
Figure 4-21. Instance Coverage Window . . . . . . . . . . . . . . . . . . . . . . . . . . . . . . . . . . . . . . .
Figure 4-22. Filter Instance List Dialog Box . . . . . . . . . . . . . . . . . . . . . . . . . . . . . . . . . . . . .
Figure 4-23. Library Window . . . . . . . . . . . . . . . . . . . . . . . . . . . . . . . . . . . . . . . . . . . . . . . .
Figure 4-24. Tabular Format of the List Window . . . . . . . . . . . . . . . . . . . . . . . . . . . . . . . . .
Figure 4-25. List Window . . . . . . . . . . . . . . . . . . . . . . . . . . . . . . . . . . . . . . . . . . . . . . . . . . .
Figure 4-26. Time Markers in the List Window . . . . . . . . . . . . . . . . . . . . . . . . . . . . . . . . . .
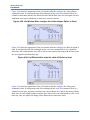
Figure 4-27. List Window After configure list -delta none Option is Used . . . . . . . . . . . . .
Figure 4-28. List Window After configure list -delta collapse Option is Used. . . . . . . . . . .
Figure 4-29. List Window After write list -delta all Option is Used . . . . . . . . . . . . . . . . . . .
Figure 4-30. List Window After write list -event Option is Used . . . . . . . . . . . . . . . . . . . . .
Figure 4-31. Wave Signal Search Dialog Box. . . . . . . . . . . . . . . . . . . . . . . . . . . . . . . . . . . .
Figure 4-32. Expression Builder Dialog Box . . . . . . . . . . . . . . . . . . . . . . . . . . . . . . . . . . . .
Figure 4-33. Selecting Signals for Expression Builder . . . . . . . . . . . . . . . . . . . . . . . . . . . . .
10
70
70
72
73
74
76
77
78
79
79
81
82
86
92
95
97
100
102
104
106
109
111
116
117
118
119
125
127
129
132
135
138
142
143
148
150
151
152
153
154
154
155
156
157
158
ModelSim SE GUI Reference Manual, v10.2c
List of Figures
Figure 4-34. Modifying List Window Display Properties . . . . . . . . . . . . . . . . . . . . . . . . . . .
Figure 4-35. List Signal Properties Dialog . . . . . . . . . . . . . . . . . . . . . . . . . . . . . . . . . . . . . .
Figure 4-36. Changing the Radix in the List Window. . . . . . . . . . . . . . . . . . . . . . . . . . . . . .
Figure 4-37. Line Triggering in the List Window . . . . . . . . . . . . . . . . . . . . . . . . . . . . . . . . .
Figure 4-38. Setting Trigger Properties . . . . . . . . . . . . . . . . . . . . . . . . . . . . . . . . . . . . . . . . .
Figure 4-39. Trigger Gating Using Expression Builder. . . . . . . . . . . . . . . . . . . . . . . . . . . . .
Figure 4-40. Locals Window . . . . . . . . . . . . . . . . . . . . . . . . . . . . . . . . . . . . . . . . . . . . . . . . .
Figure 4-41. Change Selected Variable Dialog Box . . . . . . . . . . . . . . . . . . . . . . . . . . . . . . .
Figure 4-42. Memory Data Window . . . . . . . . . . . . . . . . . . . . . . . . . . . . . . . . . . . . . . . . . . .
Figure 4-43. Split Screen View of Memory Contents . . . . . . . . . . . . . . . . . . . . . . . . . . . . . .
Figure 4-44. Memory LIst Window. . . . . . . . . . . . . . . . . . . . . . . . . . . . . . . . . . . . . . . . . . . .
Figure 4-45. Message Viewer Window . . . . . . . . . . . . . . . . . . . . . . . . . . . . . . . . . . . . . . . . .
Figure 4-46. Message Viewer Window — Tasks . . . . . . . . . . . . . . . . . . . . . . . . . . . . . . . . .
Figure 4-47. Message Viewer Filter Dialog Box. . . . . . . . . . . . . . . . . . . . . . . . . . . . . . . . . .
Figure 4-48. Objects Window . . . . . . . . . . . . . . . . . . . . . . . . . . . . . . . . . . . . . . . . . . . . . . . .
Figure 4-49. Setting the Global Signal Radix from the Objects Window . . . . . . . . . . . . . . .
Figure 4-50. Objects Window - Toggle Coverage. . . . . . . . . . . . . . . . . . . . . . . . . . . . . . . . .
Figure 4-51. Processes Window . . . . . . . . . . . . . . . . . . . . . . . . . . . . . . . . . . . . . . . . . . . . . .
Figure 4-52. Column Heading Changes When States are Filtered . . . . . . . . . . . . . . . . . . . .
Figure 4-53. Next Active Process Displayed in Order Column. . . . . . . . . . . . . . . . . . . . . . .
Figure 4-54. Sample Process Report in the Transcript Window . . . . . . . . . . . . . . . . . . . . . .
Figure 4-55. Profile Calltree Window . . . . . . . . . . . . . . . . . . . . . . . . . . . . . . . . . . . . . . . . . .
Figure 4-56. Profile Design Unit Window. . . . . . . . . . . . . . . . . . . . . . . . . . . . . . . . . . . . . . .
Figure 4-57. Profile Ranked Window . . . . . . . . . . . . . . . . . . . . . . . . . . . . . . . . . . . . . . . . . .
Figure 4-58. Profile Structural Window . . . . . . . . . . . . . . . . . . . . . . . . . . . . . . . . . . . . . . . .
Figure 4-59. Profile Details Window. . . . . . . . . . . . . . . . . . . . . . . . . . . . . . . . . . . . . . . . . . .
Figure 4-60. Schematic View Indicator . . . . . . . . . . . . . . . . . . . . . . . . . . . . . . . . . . . . . . . . .
Figure 4-61. Schematic Window . . . . . . . . . . . . . . . . . . . . . . . . . . . . . . . . . . . . . . . . . . . . . .
Figure 4-62. Code Preview Window . . . . . . . . . . . . . . . . . . . . . . . . . . . . . . . . . . . . . . . . . . .
Figure 4-63. Incremental Schematic Options Dialog . . . . . . . . . . . . . . . . . . . . . . . . . . . . . .
Figure 4-64. Current Time Label in the Schematic Window. . . . . . . . . . . . . . . . . . . . . . . . .
Figure 4-65. Source Window Showing Language Templates . . . . . . . . . . . . . . . . . . . . . . . .
Figure 4-66. Displaying Multiple Source Files . . . . . . . . . . . . . . . . . . . . . . . . . . . . . . . . . . .
Figure 4-67. Setting Context from Source Files . . . . . . . . . . . . . . . . . . . . . . . . . . . . . . . . . .
Figure 4-68. Coverage in Source Window . . . . . . . . . . . . . . . . . . . . . . . . . . . . . . . . . . . . . .
Figure 4-69. Source Annotation Example . . . . . . . . . . . . . . . . . . . . . . . . . . . . . . . . . . . . . . .
Figure 4-70. Popup Menu Choices for Textual Dataflow Information . . . . . . . . . . . . . . . . .
Figure 4-71. Window Shows all Driving Processes . . . . . . . . . . . . . . . . . . . . . . . . . . . . . . .
Figure 4-72. Source Readers Dialog Displays All Signal Readers . . . . . . . . . . . . . . . . . . . .
Figure 4-73. Language Templates . . . . . . . . . . . . . . . . . . . . . . . . . . . . . . . . . . . . . . . . . . . . .
Figure 4-74. Create New Design Wizard. . . . . . . . . . . . . . . . . . . . . . . . . . . . . . . . . . . . . . . .
Figure 4-75. Language Template Context Menus . . . . . . . . . . . . . . . . . . . . . . . . . . . . . . . . .
Figure 4-76. Breakpoint in the Source Window . . . . . . . . . . . . . . . . . . . . . . . . . . . . . . . . . .
Figure 4-77. Modifying Existing Breakpoints . . . . . . . . . . . . . . . . . . . . . . . . . . . . . . . . . . . .
Figure 4-78. Source Code for source.sv. . . . . . . . . . . . . . . . . . . . . . . . . . . . . . . . . . . . . . . . .
ModelSim SE GUI Reference Manual, v10.2c
159
160
161
163
164
165
170
172
173
174
178
183
184
189
190
191
194
196
197
198
198
201
202
202
203
203
206
207
209
210
211
215
217
218
220
224
225
226
226
227
228
229
230
232
233
11
List of Figures
Figure 4-79. Source Window Description . . . . . . . . . . . . . . . . . . . . . . . . . . . . . . . . . . . . . . .
Figure 4-80. Source Window with Find Toolbar. . . . . . . . . . . . . . . . . . . . . . . . . . . . . . . . . .
Figure 4-81. Preferences Dialog for Customizing Source Window . . . . . . . . . . . . . . . . . . .
Figure 4-82. Structure Window . . . . . . . . . . . . . . . . . . . . . . . . . . . . . . . . . . . . . . . . . . . . . . .
Figure 4-83. Find Mode Popup Displays Matches . . . . . . . . . . . . . . . . . . . . . . . . . . . . . . . .
Figure 4-84. Change Top Level Category Expansion . . . . . . . . . . . . . . . . . . . . . . . . . . . . . .
Figure 4-85. Change Default Ordering of Structure Window . . . . . . . . . . . . . . . . . . . . . . . .
Figure 4-86. Code Coverage Data in the Structure Window . . . . . . . . . . . . . . . . . . . . . . . . .
Figure 4-87. Changing the colorizeTranscript Preference Value . . . . . . . . . . . . . . . . . . . . .
Figure 4-88. Transcript Window with Find Toolbar . . . . . . . . . . . . . . . . . . . . . . . . . . . . . . .
Figure 4-89. drivers Command Results in Transcript . . . . . . . . . . . . . . . . . . . . . . . . . . . . . .
Figure 4-90. Browser Tab . . . . . . . . . . . . . . . . . . . . . . . . . . . . . . . . . . . . . . . . . . . . . . . . . . .
Figure 4-91. Watch Window . . . . . . . . . . . . . . . . . . . . . . . . . . . . . . . . . . . . . . . . . . . . . . . . .
Figure 4-92. Expanded Array . . . . . . . . . . . . . . . . . . . . . . . . . . . . . . . . . . . . . . . . . . . . . . . .
Figure 4-93. Scrollable Hierarchical Display . . . . . . . . . . . . . . . . . . . . . . . . . . . . . . . . . . . .
Figure 4-94. Wave Window. . . . . . . . . . . . . . . . . . . . . . . . . . . . . . . . . . . . . . . . . . . . . . . . . .
Figure 4-95. Pathnames Pane. . . . . . . . . . . . . . . . . . . . . . . . . . . . . . . . . . . . . . . . . . . . . . . . .
Figure 4-96. Setting the Global Signal Radix from the Wave Window . . . . . . . . . . . . . . . .
Figure 4-97. Values Pane. . . . . . . . . . . . . . . . . . . . . . . . . . . . . . . . . . . . . . . . . . . . . . . . . . . .
Figure 4-98. Waveform Pane. . . . . . . . . . . . . . . . . . . . . . . . . . . . . . . . . . . . . . . . . . . . . . . . .
Figure 4-99. Analog Sidebar Toolbox . . . . . . . . . . . . . . . . . . . . . . . . . . . . . . . . . . . . . . . . . .
Figure 4-100. Cursor Pane . . . . . . . . . . . . . . . . . . . . . . . . . . . . . . . . . . . . . . . . . . . . . . . . . . .
Figure 4-101. Wave Window - Message Bar. . . . . . . . . . . . . . . . . . . . . . . . . . . . . . . . . . . . .
Figure 4-102. View Objects Window Dropdown Menu . . . . . . . . . . . . . . . . . . . . . . . . . . . .
Figure 5-1. Keyboard Shortcuts for Source Window . . . . . . . . . . . . . . . . . . . . . . . . . . . . . .
Figure 5-2. Keyboard Shortcuts Dialog Box . . . . . . . . . . . . . . . . . . . . . . . . . . . . . . . . . . . . .
Figure 5-3. Add Keyboard Shortcut Dialog Box . . . . . . . . . . . . . . . . . . . . . . . . . . . . . . . . . .
Figure 5-4. Schematic Window Keyboard Shortcuts . . . . . . . . . . . . . . . . . . . . . . . . . . . . . .
Figure 6-1. Configure Column Layout Dialog . . . . . . . . . . . . . . . . . . . . . . . . . . . . . . . . . . .
Figure 6-2. Edit Column Layout Dialog . . . . . . . . . . . . . . . . . . . . . . . . . . . . . . . . . . . . . . . .
Figure 6-3. Create Column Layout Dialog . . . . . . . . . . . . . . . . . . . . . . . . . . . . . . . . . . . . . .
Figure 6-4. User-Defined Buttons and Menus. . . . . . . . . . . . . . . . . . . . . . . . . . . . . . . . . . . .
Figure 6-5. User-Defined Radix “States” in the Wave Window . . . . . . . . . . . . . . . . . . . . . .
Figure 6-6. User-Defined Radix “States” in the List Window . . . . . . . . . . . . . . . . . . . . . . .
Figure 6-7. Setting the Global Signal Radix . . . . . . . . . . . . . . . . . . . . . . . . . . . . . . . . . . . . .
Figure 6-8. Fixed Point Radix Dialog . . . . . . . . . . . . . . . . . . . . . . . . . . . . . . . . . . . . . . . . . .
Figure 7-1. Change Text Fonts for Selected Windows . . . . . . . . . . . . . . . . . . . . . . . . . . . . .
Figure 7-2. Making Global Font Changes . . . . . . . . . . . . . . . . . . . . . . . . . . . . . . . . . . . . . . .
Figure 7-3. Persistent Buttons and Menus . . . . . . . . . . . . . . . . . . . . . . . . . . . . . . . . . . . . . . .
Figure 7-4. Modifying Signal Display Attributes in the Wave Window. . . . . . . . . . . . . . . .
12
236
237
238
240
243
250
251
251
256
257
257
259
266
267
268
271
273
274
274
275
275
276
277
278
281
282
284
288
296
297
297
298
300
301
302
303
306
307
309
311
ModelSim SE GUI Reference Manual, v10.2c
List of Tables
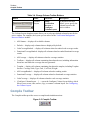
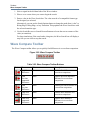
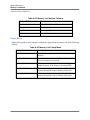
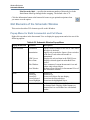
Table 1-1. Scribble Mode Menu . . . . . . . . . . . . . . . . . . . . . . . . . . . . . . . . . . . . . . . . . . . . . .
Table 1-2. Graphic Elements of Toolbar in Find Mode . . . . . . . . . . . . . . . . . . . . . . . . . . . .
Table 1-3. Graphic Elements of Toolbar in Filter Mode . . . . . . . . . . . . . . . . . . . . . . . . . . .
Table 1-4. Information Displayed in Status Bar . . . . . . . . . . . . . . . . . . . . . . . . . . . . . . . . . .
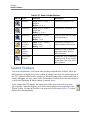
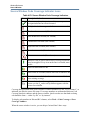
Table 1-5. Design Object Icons . . . . . . . . . . . . . . . . . . . . . . . . . . . . . . . . . . . . . . . . . . . . . .
Table 1-6. Icon Shapes and Design Object Types . . . . . . . . . . . . . . . . . . . . . . . . . . . . . . . .
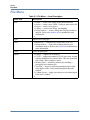
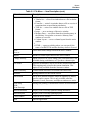
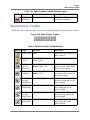
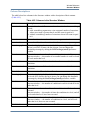
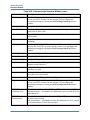
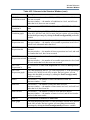
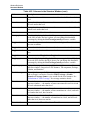
Table 2-1. File Menu — Item Description . . . . . . . . . . . . . . . . . . . . . . . . . . . . . . . . . . . . . .
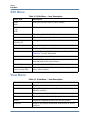
Table 2-2. Edit Menu — Item Description . . . . . . . . . . . . . . . . . . . . . . . . . . . . . . . . . . . . . .
Table 2-3. View Menu — Item Description . . . . . . . . . . . . . . . . . . . . . . . . . . . . . . . . . . . . .
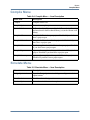
Table 2-4. Compile Menu — Item Description . . . . . . . . . . . . . . . . . . . . . . . . . . . . . . . . . .
Table 2-5. Simulate Menu — Item Description . . . . . . . . . . . . . . . . . . . . . . . . . . . . . . . . . .
Table 2-6. Add Menu — Item Description . . . . . . . . . . . . . . . . . . . . . . . . . . . . . . . . . . . . . .
Table 2-7. Tools Menu — Item Description . . . . . . . . . . . . . . . . . . . . . . . . . . . . . . . . . . . . .
Table 2-8. Layout Menu — Item Description . . . . . . . . . . . . . . . . . . . . . . . . . . . . . . . . . . .
Table 2-9. Bookmarks Menu — Item Description . . . . . . . . . . . . . . . . . . . . . . . . . . . . . . . .
Table 2-10. Window Menu — Item Description . . . . . . . . . . . . . . . . . . . . . . . . . . . . . . . . .
Table 2-11. Help Menu — Item Description . . . . . . . . . . . . . . . . . . . . . . . . . . . . . . . . . . . .
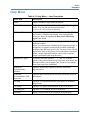
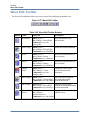
Table 3-1. ATV Toolbar Buttons . . . . . . . . . . . . . . . . . . . . . . . . . . . . . . . . . . . . . . . . . . . . .
Table 3-2. Analysis Toolbar Buttons . . . . . . . . . . . . . . . . . . . . . . . . . . . . . . . . . . . . . . . . . .
Table 3-3. Bookmarks Toolbar Buttons . . . . . . . . . . . . . . . . . . . . . . . . . . . . . . . . . . . . . . . .
Table 3-4. Change Column Toolbar Buttons . . . . . . . . . . . . . . . . . . . . . . . . . . . . . . . . . . . .
Table 3-5. Compile Toolbar Buttons . . . . . . . . . . . . . . . . . . . . . . . . . . . . . . . . . . . . . . . . . .
Table 3-6. Coverage Toolbar Buttons . . . . . . . . . . . . . . . . . . . . . . . . . . . . . . . . . . . . . . . . . .
Table 3-7. Dataflow Toolbar Buttons . . . . . . . . . . . . . . . . . . . . . . . . . . . . . . . . . . . . . . . . . .
Table 3-8. FSM Toolbar Buttons . . . . . . . . . . . . . . . . . . . . . . . . . . . . . . . . . . . . . . . . . . . . .
Table 3-9. Help Toolbar Buttons . . . . . . . . . . . . . . . . . . . . . . . . . . . . . . . . . . . . . . . . . . . . .
Table 3-10. Layout Toolbar Buttons . . . . . . . . . . . . . . . . . . . . . . . . . . . . . . . . . . . . . . . . . . .
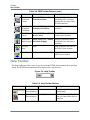
Table 3-11. Memory Toolbar Buttons . . . . . . . . . . . . . . . . . . . . . . . . . . . . . . . . . . . . . . . . .
Table 3-12. Mode Toolbar Buttons . . . . . . . . . . . . . . . . . . . . . . . . . . . . . . . . . . . . . . . . . . . .
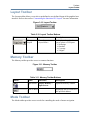
Table 3-13. Objectfilter Toolbar Buttons . . . . . . . . . . . . . . . . . . . . . . . . . . . . . . . . . . . . . . .
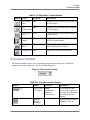
Table 3-14. Precision Toolbar Buttons . . . . . . . . . . . . . . . . . . . . . . . . . . . . . . . . . . . . . . . . .
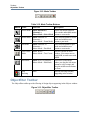
Table 3-15. Process Toolbar Buttons . . . . . . . . . . . . . . . . . . . . . . . . . . . . . . . . . . . . . . . . . .
Table 3-16. Profile Toolbar Buttons . . . . . . . . . . . . . . . . . . . . . . . . . . . . . . . . . . . . . . . . . . .
Table 3-17. Schematic Toolbar Buttons . . . . . . . . . . . . . . . . . . . . . . . . . . . . . . . . . . . . . . . .
Table 3-18. Simulate Toolbar Buttons . . . . . . . . . . . . . . . . . . . . . . . . . . . . . . . . . . . . . . . . .
Table 3-19. Source Toolbar Buttons . . . . . . . . . . . . . . . . . . . . . . . . . . . . . . . . . . . . . . . . . . .
Table 3-20. Standard Toolbar Buttons . . . . . . . . . . . . . . . . . . . . . . . . . . . . . . . . . . . . . . . . .
Table 3-21. Step Toolbar Buttons . . . . . . . . . . . . . . . . . . . . . . . . . . . . . . . . . . . . . . . . . . . . .
Table 3-22. Wave Toolbar Buttons . . . . . . . . . . . . . . . . . . . . . . . . . . . . . . . . . . . . . . . . . . . .
Table 3-23. Wave Compare Toolbar Buttons . . . . . . . . . . . . . . . . . . . . . . . . . . . . . . . . . . . .
ModelSim SE GUI Reference Manual, v10.2c
25
27
28
36
37
37
42
44
44
45
45
47
47
49
49
49
51
53
54
55
56
57
57
58
59
60
61
61
62
63
63
64
64
65
67
70
71
73
74
76
13
List of Tables
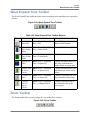
Table 3-24. Wave Cursor Toolbar Buttons . . . . . . . . . . . . . . . . . . . . . . . . . . . . . . . . . . . . . .
Table 3-25. Wave Edit Toolbar Buttons . . . . . . . . . . . . . . . . . . . . . . . . . . . . . . . . . . . . . . . .
Table 3-26. Wave Expand Time Toolbar Buttons . . . . . . . . . . . . . . . . . . . . . . . . . . . . . . . .
Table 3-27. Zoom Toolbar Buttons . . . . . . . . . . . . . . . . . . . . . . . . . . . . . . . . . . . . . . . . . . .
Table 4-1. GUI Windows . . . . . . . . . . . . . . . . . . . . . . . . . . . . . . . . . . . . . . . . . . . . . . . . . . .
Table 4-2. Assertions Window Columns . . . . . . . . . . . . . . . . . . . . . . . . . . . . . . . . . . . . . . .
Table 4-3. Assertions Window Popup Menu . . . . . . . . . . . . . . . . . . . . . . . . . . . . . . . . . . . .
Table 4-4. Graphic Symbols for Current Directive State . . . . . . . . . . . . . . . . . . . . . . . . . . .
Table 4-5. Graphic Symbols for Clock, Thread, and Directive Status . . . . . . . . . . . . . . . . .
Table 4-6. ATV WIndow Popup Menu . . . . . . . . . . . . . . . . . . . . . . . . . . . . . . . . . . . . . . . .
Table 4-7. Commands Related to the Call Stack Window . . . . . . . . . . . . . . . . . . . . . . . . . .
Table 4-8. Call Stack Window Columns . . . . . . . . . . . . . . . . . . . . . . . . . . . . . . . . . . . . . . .
Table 4-9. Capacity Window Columns . . . . . . . . . . . . . . . . . . . . . . . . . . . . . . . . . . . . . . . . .
Table 4-10. Class Graph Window Popup Menu . . . . . . . . . . . . . . . . . . . . . . . . . . . . . . . . . .
Table 4-11. Class Instances Window Popup Menu . . . . . . . . . . . . . . . . . . . . . . . . . . . . . . .
Table 4-12. Class Tree Window Icons . . . . . . . . . . . . . . . . . . . . . . . . . . . . . . . . . . . . . . . . .
Table 4-13. Class Tree Window Columns . . . . . . . . . . . . . . . . . . . . . . . . . . . . . . . . . . . . . .
Table 4-14. Class Tree Window Popup Menu . . . . . . . . . . . . . . . . . . . . . . . . . . . . . . . . . . .
Table 4-15. Contents of Code Coverage Analysis Title Bar . . . . . . . . . . . . . . . . . . . . . . . .
Table 4-16. Code Coverage Analysis Window Popup Menu . . . . . . . . . . . . . . . . . . . . . . . .
Table 4-17. Cover Directives Window Columns . . . . . . . . . . . . . . . . . . . . . . . . . . . . . . . . .
Table 4-18. Covergroups Window Columns . . . . . . . . . . . . . . . . . . . . . . . . . . . . . . . . . . . .
Table 4-19. Covergroup Window Popup Menu . . . . . . . . . . . . . . . . . . . . . . . . . . . . . . . . . .
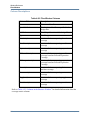
Table 4-20. Files Window Columns . . . . . . . . . . . . . . . . . . . . . . . . . . . . . . . . . . . . . . . . . . .
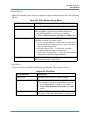
Table 4-21. Files Window Popup Menu . . . . . . . . . . . . . . . . . . . . . . . . . . . . . . . . . . . . . . . .
Table 4-22. Files Menu . . . . . . . . . . . . . . . . . . . . . . . . . . . . . . . . . . . . . . . . . . . . . . . . . . . . .
Table 4-23. FSM List Window Columns . . . . . . . . . . . . . . . . . . . . . . . . . . . . . . . . . . . . . . .
Table 4-24. FSM List Window Popup Menu . . . . . . . . . . . . . . . . . . . . . . . . . . . . . . . . . . . .
Table 4-25. FSM List Menu . . . . . . . . . . . . . . . . . . . . . . . . . . . . . . . . . . . . . . . . . . . . . . . . .
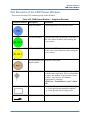
Table 4-26. FSM Viewer Window — Graphical Elements . . . . . . . . . . . . . . . . . . . . . . . . .
Table 4-27. FSM View Window Popup Menu . . . . . . . . . . . . . . . . . . . . . . . . . . . . . . . . . . .
Table 4-28. FSM View Menu . . . . . . . . . . . . . . . . . . . . . . . . . . . . . . . . . . . . . . . . . . . . . . . .
Table 4-29. Columns in the Instance Coverage Window . . . . . . . . . . . . . . . . . . . . . . . . . . .
Table 4-30. Instance Coverage Popup Menu . . . . . . . . . . . . . . . . . . . . . . . . . . . . . . . . . . . .
Table 4-31. Library Window Columns . . . . . . . . . . . . . . . . . . . . . . . . . . . . . . . . . . . . . . . . .
Table 4-32. Library Window Popup Menu . . . . . . . . . . . . . . . . . . . . . . . . . . . . . . . . . . . . . .
Table 4-33. Actions for Time Markers . . . . . . . . . . . . . . . . . . . . . . . . . . . . . . . . . . . . . . . . .
Table 4-34. Triggering Options . . . . . . . . . . . . . . . . . . . . . . . . . . . . . . . . . . . . . . . . . . . . . .
Table 4-35. List Window Popup Menu . . . . . . . . . . . . . . . . . . . . . . . . . . . . . . . . . . . . . . . . .
Table 4-36. Locals Window Columns . . . . . . . . . . . . . . . . . . . . . . . . . . . . . . . . . . . . . . . . .
Table 4-37. Locals Window Popup Menu . . . . . . . . . . . . . . . . . . . . . . . . . . . . . . . . . . . . . .
Table 4-38. Memory Data Popup Menu — Address Pane . . . . . . . . . . . . . . . . . . . . . . . . . .
Table 4-40. Memory Data Menu . . . . . . . . . . . . . . . . . . . . . . . . . . . . . . . . . . . . . . . . . . . . .
Table 4-39. Memory Data Popup Menu — Data Pane . . . . . . . . . . . . . . . . . . . . . . . . . . . . .
Table 4-41. Memory Identification . . . . . . . . . . . . . . . . . . . . . . . . . . . . . . . . . . . . . . . . . . . .
14
77
78
79
80
83
86
90
93
93
94
96
96
97
101
103
104
105
105
107
108
111
120
122
130
131
131
133
133
133
139
140
140
143
147
148
149
153
164
168
171
171
174
175
175
176
ModelSim SE GUI Reference Manual, v10.2c
List of Tables
Table 4-42. Memory List Window Columns . . . . . . . . . . . . . . . . . . . . . . . . . . . . . . . . . . . .
Table 4-43. Memory List Popup Menu . . . . . . . . . . . . . . . . . . . . . . . . . . . . . . . . . . . . . . . . .
Table 4-44. Memories Menu . . . . . . . . . . . . . . . . . . . . . . . . . . . . . . . . . . . . . . . . . . . . . . . . .
Table 4-45. Message Viewer Tasks . . . . . . . . . . . . . . . . . . . . . . . . . . . . . . . . . . . . . . . . . . .
Table 4-46. Message Viewer Window Columns . . . . . . . . . . . . . . . . . . . . . . . . . . . . . . . . .
Table 4-47. Message Viewer Window Popup Menu . . . . . . . . . . . . . . . . . . . . . . . . . . . . . .
Table 4-48. Objects Window Popup Menu . . . . . . . . . . . . . . . . . . . . . . . . . . . . . . . . . . . . . .
Table 4-49. Toggle Coverage Columns in the Objects Window . . . . . . . . . . . . . . . . . . . . .
Table 4-50. Processes Window Column Descriptions . . . . . . . . . . . . . . . . . . . . . . . . . . . . .
Table 4-51. Profile Calltree Window Column Descriptions . . . . . . . . . . . . . . . . . . . . . . . . .
Table 4-52. Schematic Window Popup Menu . . . . . . . . . . . . . . . . . . . . . . . . . . . . . . . . . . .
Table 4-53. Source Window Code Coverage Indicators . . . . . . . . . . . . . . . . . . . . . . . . . . .
Table 4-54. Structure Window Popup Menu . . . . . . . . . . . . . . . . . . . . . . . . . . . . . . . . . . . .
Table 4-55. Columns in the Structure Window . . . . . . . . . . . . . . . . . . . . . . . . . . . . . . . . . .
Table 4-56. Verification Browser Icons . . . . . . . . . . . . . . . . . . . . . . . . . . . . . . . . . . . . . . . .
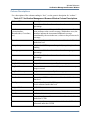
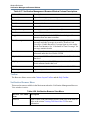
Table 4-57. Verification Management Browser Window Column Descriptions . . . . . . . . .
Table 4-58. Verification Browser View Menu . . . . . . . . . . . . . . . . . . . . . . . . . . . . . . . . . . .
Table 4-59. Verification Management Browser Window Popup Menu . . . . . . . . . . . . . . . .
Table 4-60. Watch Window Popup Menu . . . . . . . . . . . . . . . . . . . . . . . . . . . . . . . . . . . . . .
Table 4-61. Watch Window Menu . . . . . . . . . . . . . . . . . . . . . . . . . . . . . . . . . . . . . . . . . . . .
Table 4-62. Analog Sidebar Icons . . . . . . . . . . . . . . . . . . . . . . . . . . . . . . . . . . . . . . . . . . . .
Table 4-63. Window Icons . . . . . . . . . . . . . . . . . . . . . . . . . . . . . . . . . . . . . . . . . . . . . . . . . .
Table 5-1. Mouse Shortcuts . . . . . . . . . . . . . . . . . . . . . . . . . . . . . . . . . . . . . . . . . . . . . . . . .
Table 5-2. Keyboard Shortcuts . . . . . . . . . . . . . . . . . . . . . . . . . . . . . . . . . . . . . . . . . . . . . . .
Table 5-3. List Window Keyboard Shortcuts . . . . . . . . . . . . . . . . . . . . . . . . . . . . . . . . . . . .
Table 5-4. Wave Window Mouse Shortcuts . . . . . . . . . . . . . . . . . . . . . . . . . . . . . . . . . . . . .
Table 5-5. Wave Window Keyboard Shortcuts . . . . . . . . . . . . . . . . . . . . . . . . . . . . . . . . . .
Table 7-1. Global Fonts . . . . . . . . . . . . . . . . . . . . . . . . . . . . . . . . . . . . . . . . . . . . . . . . . . . .
Table 7-2. Default ListTranslateTable Values . . . . . . . . . . . . . . . . . . . . . . . . . . . . . . . . . . .
Table 7-3. Default LogicStyleTable Values . . . . . . . . . . . . . . . . . . . . . . . . . . . . . . . . . . . . .
ModelSim SE GUI Reference Manual, v10.2c
180
180
181
184
185
187
192
194
199
204
212
222
240
245
259
261
262
265
269
270
276
278
285
286
289
289
290
307
310
311
15
List of Tables
16
ModelSim SE GUI Reference Manual, v10.2c
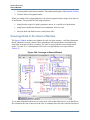
Chapter 1
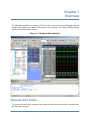
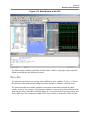
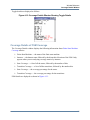
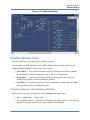
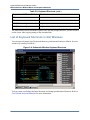
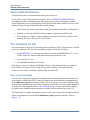
Overview
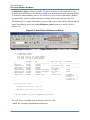
The ModelSim graphical user interface (GUI) provides access to numerous debugging tools and
windows that enable you to analyze different parts of your design. All windows initially display
within the ModelSim Main window.
Figure 1-1. Graphical User Interface
General GUI Tasks
This section describes tasks common to more than one individual window and is organized into
the following categories:
ModelSim SE GUI Reference Manual, v10.2c
17
Overview
General GUI Tasks
•
•
•
•
•
•
Window Management
Column-Based Windows
Bookmarks
Scribble Mode
Font Management
Find and Filter Functions
Window Management
The following tasks define actions you can take with the various windows.
Saving the Layout Upon Exit
By default when you exit ModelSim, the current layout is saved for a given design so that it
appears the same the next time you invoke the tool.
Resetting the Window Layout to the Default
The windows are customizable in that you can position and size them as you see fit, and
ModelSim will remember your settings upon subsequent invocations. You can restore
ModelSim windows and panes to their original settings by selecting Layout > Reset in the
menu bar.
Copying Text from a Window Header
You can copy the title text in a window header by selecting it and right-clicking to display a
popup menu. This is useful for copying the file name of a source file for use elsewhere (see
Figure 4-19 for an example of this in an FSM Viewer window).
Selecting the Active Window
When the title bar of a window is highlighted - solid blue - it is the active window. All menu
selections will correspond to this active window. You can change the active window in the
following ways.
•
•
(default) Click anywhere in a window or on its title bar.
Move the mouse pointer into the window.
To turn on this feature, select Window > FocusFollowsMouse. Default time delay for
activating a window after the mouse cursor has entered the window is 300ms. You can
change the time delay with the PrefMain(FFMDelay) preference variable.
18
ModelSim SE GUI Reference Manual, v10.2c
Overview
General GUI Tasks
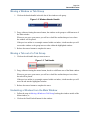
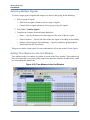
Moving a Window or Tab Group
1. Click on the header handle in the title bar of the window or tab group.
Figure 1-2. Window Header Handle
2. Drag, without releasing the mouse button, the window or tab group to a different area of
the Main window
Wherever you move your mouse you will see a dark blue outline that previews where
the window will be placed.
If the preview outline is a rectangle centered within a window, it indicates that you will
convert the window or tab group into new tabs within the highlighted window.
3. Release the mouse button to complete the move.
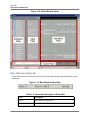
Moving a Tab out of a Tab Group
1. Click on the tab handle that you want to move.
Figure 1-3. Tab Handle
2. Drag, without releasing the mouse button, the tab to a different area of the Main window
Wherever you move your mouse you will see a dark blue outline that previews where
the tab will be placed.
If the preview outline is a rectangle centered within a window, it indicates that you will
move the tab into the highlighted window.
3. Release the mouse button to complete the move.
Undocking a Window from the Main Window
•
Follow the steps in Moving a Window or Tab Group, but drag the window outside of the
Main window, or
•
Click on the Dock/Undock button for the window.
ModelSim SE GUI Reference Manual, v10.2c
19
Overview
General GUI Tasks
Figure 1-4. Window Undock Button
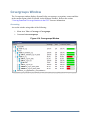
Column-Based Windows
This section describes tasks related to column-based windows throughout the GUI.
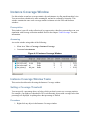
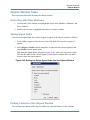
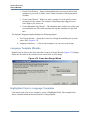
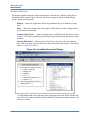
Customizing the Column Views
You can customize the display of columns column-based windows, and then save these views
for later use.
Procedure
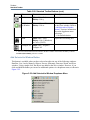
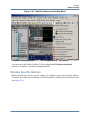
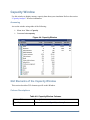
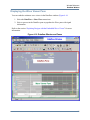
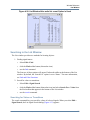
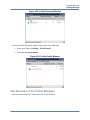
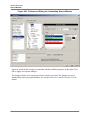
1. Right-click in the column headings and select Configure Column Layout. This
displays the Configure Column Layout dialog box.
a. Select Create. This displays the Create Column Layout dialog box.
i. Layout Name — enter a name for the layout for future reference.
ii. Column Selections — move columns to your desired state.
iii. Click OK.
b. Your new layout is added to the Layouts list.
c. Click Done.
After applying your selections, the rearranged columns and custom layouts are saved and
appear when you next open that column view in the window.
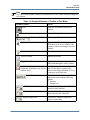
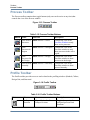
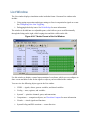
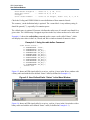
Bookmarks
You can create bookmarks that allow you to return to a specific view or place in your design for
some of the windows. The bookmarks you make can be saved and automatically restored. Some
of the windows that allow bookmarking include the Structure, Files, Objects, Wave, and
Objects windows.
Working with Bookmarks
The Bookmarks toolbar and the Bookmarks menu give you access to the following
bookmarking features:
•
20
Add Bookmarks
ModelSim SE GUI Reference Manual, v10.2c
Overview
General GUI Tasks
Bookmarks are added to an active window by selecting Bookmarks > Add
Bookmark or by clicking the Add Bookmark button. You will be prompted to
automatically save and restore your bookmarks when you set the first bookmark.
You can change the automatic save and restore settings in the Bookmark Options
Dialog Box.
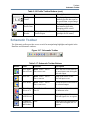
•
Add Custom
Selecting Add Custom opens the New Bookmark dialog box with the context
field(s) populated and a field for specifying an alias for the bookmark. Click and
hold the Add Bookmark button to access this feature from the Bookmarks toolbar.
Note
Aliases are mapped to the window in which a bookmark is set. You can use the same alias
for different bookmarks as long as each alias is assigned to a bookmark set in a different
window.
•
Deleting Bookmarks
You can choose to delete the bookmarks from the currently active window or from
all windows.
•
Manage Bookmarks
Opens the Manage Bookmarks dialog box. Refer to Managing Your Bookmarks
for more information.
•
Load Bookmarks
Loads the bookmarks saved in the bookmarks.do file. You can choose whether to
load bookmarks for the currently active window or all the bookmarks saved in the
bookmarks.do file. Bookmarks are automatically loaded from the saved
bookmarks.do file when you start a new simulation session.
Note
You must reload bookmarks for a window if you close then reopen that window during
the current session.
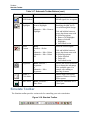
•
Jump to Bookmark
Shows the available bookmarks in the currently active window followed by a drop
down list of bookmarks for each window. You can set the maximum number of
bookmarks listed in the Bookmark Options Dialog Box.
ModelSim SE GUI Reference Manual, v10.2c
21
Overview
General GUI Tasks
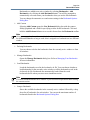
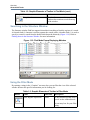
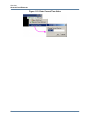
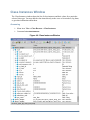
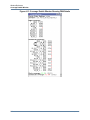
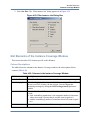
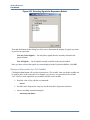
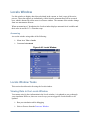
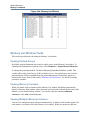
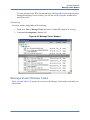
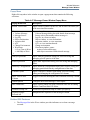
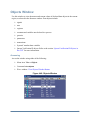
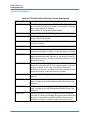
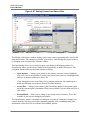
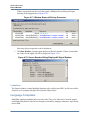
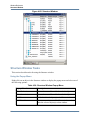
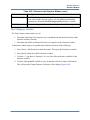
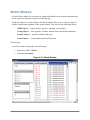
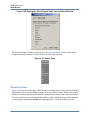
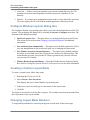
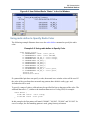
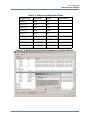
Managing Your Bookmarks
You can open the Manage Bookmarks dialog box with the Manage Bookmarks toolbar button
or by selecting Bookmarks > Manage Bookmarks. The dialog box can be kept open during
your simulation (Figure 1-5).
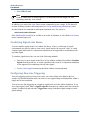
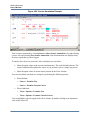
Figure 1-5. Manage Bookmarks Dialog Box
•
•
22
Simple view mode changes the buttons from name and icon mode to icon only mode.
Checking Active window only changes the display to show the bookmarks in the
currently active window. Selecting a different window in the tool changes the display to
the bookmarks set in that window.
•
Selecting New opens the New Bookmark dialog box. The fields in the dialog
automatically load the settings of the view in the currently active window. You can
choose to name the bookmark with an alias to provide a more meaningful description.
Aliases are displayed in the Alias column in the Manage Bookmarks dialog box.
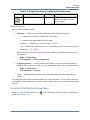
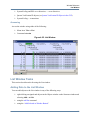
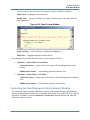
•
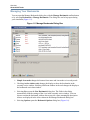
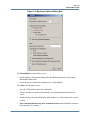
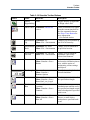
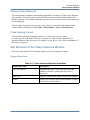
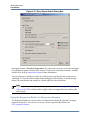
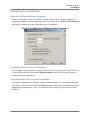
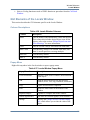
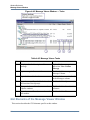
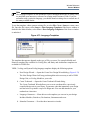
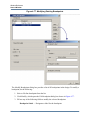
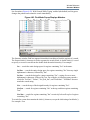
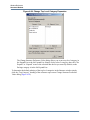
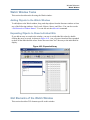
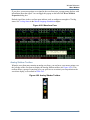
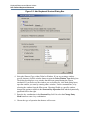
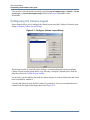
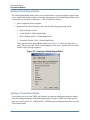
Selecting Options opens the Bookmark Options dialog box (Figure 1-6).
ModelSim SE GUI Reference Manual, v10.2c
Overview
General GUI Tasks
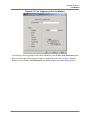
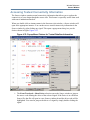
Figure 1-6. Bookmark Options Dialog Box
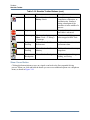
The Menu Display section allows you to:
o
Set the number of bookmarks displayed in the Bookmarks menu or the Jump to
Bookmark button menu.
o
Select the types of information displayed for each bookmark.
The Other section allows you to:
o
Specify a different base name for bookmarks.
o
Choose whether you want to automatically save bookmarks and when they are
saved.
o
Automatically restore the bookmarks when windows are first loaded in the current
session.
o
Show informational message after bookmark actions sends bookmark actions to
the transcript. For example:
ModelSim SE GUI Reference Manual, v10.2c
23
Overview
General GUI Tasks
# Bookmark(s) were restored for window "Source"
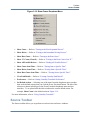
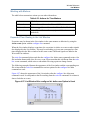
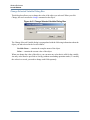
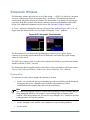
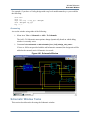
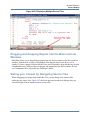
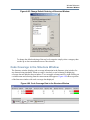
Saving and Reloading Formats and Content
You can use the write format restart command to create a single .do file that will recreate all
debug windows and breakpoints (see Saving and Restoring Breakpoints) when invoked with the
do command in subsequent simulation runs. The syntax is:
write format restart <filename>
If the ShutdownFile modelsim.ini variable is set to this .do filename, it will call the write
format restart command upon exit.
Scribble Mode
On Linux systems, you can capture an image of the desktop or a single window, make line
drawings and take notes, then save the image for later review or to share with others. Scribble
mode provides a quick way to make annotions directly on the GUI.
Figure 1-7. Scribble Mode
24
ModelSim SE GUI Reference Manual, v10.2c
Overview
General GUI Tasks
You can access this feature by selecting Window > Enable Scribble Mode from either the
main window or a separate window. A new window with a red border is superimposed over a
window or the desktop and access to all window and toolbar functions are suspended until you
exit Scribble Mode. Use the left mouse button to draw and drag a text box into position. Use the
right mouse button to open a menu with the following options:
Table 1-1. Scribble Mode Menu
Menu Item
Description
Add Text
Opens the Scribble Text
dialog box for entering and
formatting text
Attributes
Choose color and line
thickness
Clear Items
Choose which graphic
elements to delete
Save Image
Saves the image as a bitmap
to the current directory
Exit Scribble Mode
Font Management
You may need to adjust font settings to accommodate the aspect ratios of wide screen and
double screen displays or to handle launching ModelSim from an X-session. Refer to Making
Global Font Changes for more information.
Font Scaling
To change font scaling, select the Transcript window, then Transcript > Adjust Font Scaling.
You will need a ruler to complete the instructions in the lower right corner of the dialog. When
you have entered the pixel and inches information, click OK to close the dialog. Then, restart
ModelSim to see the change. This is a one time setting; you should not need to set it again
unless you change display resolution or the hardware (monitor or video card). The font scaling
applies to Windows and UNIX operating systems. On UNIX systems, the font scaling is stored
based on the $DISPLAY environment variable.
Find and Filter Functions
Finding and/or filtering capabilities are available for most windows. The Find mode toolbar is
shown in Figure 1-8. The filtering function is denoted by a “Contains” field (Figure 1-9).
Figure 1-8. Find Mode
ModelSim SE GUI Reference Manual, v10.2c
25
Overview
General GUI Tasks
Figure 1-9. Filter Mode
Windows that support both Find (Figure 1-8) and Filter modes (Figure 1-9) allow you to toggle
between the two modes by doing any one of the following:
•
•
•
Use the Ctrl+M hotkey.
Click the “Find” or “Contains” words in the toolbar at the bottom of the window.
Select the mode from the Find Options popup menu (see Using the Find Options Popup
Menu).
The last selected mode is remembered between sessions.
A “Find” toolbar will appear along the bottom edge of the active window when you do either of
the following:
•
•
Select Edit > Find in the menu bar.
Click the Find icon in the Standard Toolbar.
All of the above actions are toggles - repeat the action and the Find toolbar will close.
The Find or Filter entry fields prefill as you type, based on the context of the current window
selection. The find or filter action begins as you type.
There is a simple history mechanism that saves find or filter strings for later use. The keyboard
shortcuts to use this feature are:
•
•
Ctrl+P — retrieve previous search string
Ctrl+N — retrieve next search string
Other hotkey actions include:
•
•
•
Esc — closes the Find toolbar
Enter (Windows) or Return (UNIX or Linux) — initiates a “Find Next” action
Ctrl+T — search while typing (default is on)
The entry field turns red if no matches are found.
The graphic elements associated with the Find toolbar are shown in Table 1-2.
26
ModelSim SE GUI Reference Manual, v10.2c
Overview
General GUI Tasks
Note
The Find Toolbar graphic elements are context driven. The actions available change for
each window.
Table 1-2. Graphic Elements of Toolbar in Find Mode
Graphic Element
Action
Find
opens the find toolbar in the active
window
Close
closes the find toolbar
Find entry field
allows entry of find parameters
Find Options
opens the Find Options popup menu at
the bottom of the active window. The
contents of the menu changes for each
window.
Clear Entry Field
clears the entry field
Execute Search
initiates the search
Toggle Search Direction
toggles search direction upward or
downward through the active window
Find All Matches;
Bookmark All Matches (for Source
window only)
highlights every occurrence of the find
item; for the Source window only,
places a blue flag (bookmark) at every
occurrence of the find item
Search For
Click and hold the button to open a
drop down menu with the following
options:
• Instance
• Design Unit
Match Case
search must match the case of the text
entered in the Find field
Exact (whole word)
searches for whole words that match
those entered in the Find field
Regular Expression
ModelSim SE GUI Reference Manual, v10.2c
Searches for a regular expression;
Source window only.
27
Overview
General GUI Tasks
Table 1-2. Graphic Elements of Toolbar in Find Mode (cont.)
Graphic Element
Action
Wrap Search
Searches from cursor to bottom of
window then continues search from top
of the window.
Searching in the Structure Window
The Structure window Find bar supports hierarchical searching to limit the regions of a search.
A forward slash (/) character is used to separate the search words. A double slash (//) is used to
specify a recursive search from the double slash down the hierarchy (Figure 1-10). Refer to
Finding Items in the Structure Window for more information.
Figure 1-10. Find Mode Popup Displaying Matches
Using the Filter Mode
By entering a string in the “Contains” text entry box you can filter the view of the selected
window down to the specific information you are looking for.
Table 1-3. Graphic Elements of Toolbar in Filter Mode
Button
Name
Shortcuts
Description
Filter Regular Expression
None
A drop down menu that allows
you to set the wildcard mode.
A text entry box for your filter
string.
28
ModelSim SE GUI Reference Manual, v10.2c
Overview
General GUI Tasks
Table 1-3. Graphic Elements of Toolbar in Filter Mode (cont.)
Button
Name
Shortcuts
Description
Clear Filter
None
Clears the text entry box and
removes the filter from the
active window.
Wildcard Usage
There are three wildcard modes:
•
glob-style — Allows you to use the following special wildcard characters:
* — matches any sequence of characters in the string
? — matches any single character in the string
[<chars>] — matches any character in the set <chars>
\<x> — matches the single character <x>, which allows you to match on any special
characters (*, ?, [, ], and \)
Refer to Finding Items in the Structure Window and the Tcl documentation for more
information:
Help > Tcl Man Pages
Tcl Commands > string > string match
•
regular-expression — (Source window only) allows you to use wildcard characters
based on Tcl regular expressions. For more information refer to the Tcl documentation:
Help > Tcl Man Pages
Tcl Commands > re_syntax
•
exact — indicates that no characters have special meaning, thus disabling wildcard
features.
The string entry field of the Contains toolbar item is case-insensitive, If you need to search for
case-sensitive strings in the Source window select “regular-expression” and prepend the string
with (?c).
Using the Find Options Popup Menu
When you click the Find Options icon
popup menu (Figure 1-11).
ModelSim SE GUI Reference Manual, v10.2c
in the Find entry field it will open a Find Options
29
Overview
General Visual Elements
Figure 1-11. Find Options Popup Menu
The Find Options menu displays the options available to you as well as hot keys for initiating
the actions without the menu.
General Visual Elements
This section descibes elements that are used by multiple windows.
Elements of the Main Window
The following sections outline the GUI terminology used in this manual.
Menu Bar
Toolbar Frame
Toolbar
Window
Tab Group
Pane
The Main window is the primary access point in the GUI. Figure 1-12 shows an example of the
Main window during a simulation run.
30
ModelSim SE GUI Reference Manual, v10.2c
Overview
General Visual Elements
Figure 1-12. Main Window of the GUI
The Main window contains a menu bar, toolbar frame, windows, tab groups, and a status bar,
which are described in the following sections.
Menu Bar
The menu bar provides access to many tasks available for your workflow. Figure 1-13 shows
the selection in the menu bar that changes based on whichever window is currently active.
The menu items that are available and how certain menu items behave depend on which
window is active. For example, if the Structure window is active and you choose Edit from the
menu bar, the Clear command is disabled. However, if you click in the Transcript window and
choose Edit, the Clear command is enabled. The active window is denoted by a blue title bar
ModelSim SE GUI Reference Manual, v10.2c
31
Overview
General Visual Elements
Figure 1-13. Main Window — Menu Bar
Toolbar Frame
The toolbar frame contains several toolbars that provide quick access to various commands and
functions.
Figure 1-14. Main Window — Toolbar Frame
Toolbar
A toolbar is a collection of GUI elements in the toolbar frame and grouped by similarity of task.
There are many toolbars available within the GUI, refer to the section “Toolbars” for more
information about each toolbar. Figure 1-15 highlights the Compile toolbar in the toolbar frame.
32
ModelSim SE GUI Reference Manual, v10.2c
Overview
General Visual Elements
Figure 1-15. Main Window — Toolbar
Window
ModelSim can display over 40 different windows you can use with your workflow. This manual
refers to all of these objects as windows, even though you can rearrange them such that they
appear as a single window with tabs identifying each window.
Figure 1-16 shows an example of a layout with five windows visible; the Structure, Objects,
Processes, Wave and Transcript windows.
ModelSim SE GUI Reference Manual, v10.2c
33
Overview
General Visual Elements
Figure 1-16. GUI Windows
Tab Group
You can group any number of windows into a single space called a tab group, allowing you to
show and hide windows by selecting their tabs. Figure 1-17 shows a tab group of the Library,
Files, Capacity and Structure windows, with the Structure (sim) window visible.
34
ModelSim SE GUI Reference Manual, v10.2c
Overview
General Visual Elements
Figure 1-17. GUI Tab Group
Pane
Some windows contain panes, which are separate areas of a window display containing distinct
information within that window. One way to tell if a window has panes is whether you receive
different popup menus (right-click menu) in different areas. Windows that have panes include
the Wave, Source, and List windows. Figure 1-18 shows the Wave window with its the three
panes.
ModelSim SE GUI Reference Manual, v10.2c
35
Overview
General Visual Elements
Figure 1-18. Wave Window Panes
Main Window Status Bar
Fields at the bottom of the Main window provide the following information about the current
simulation:
Figure 1-19. Main Window Status Bar
Table 1-4. Information Displayed in Status Bar
36
Field
Description
Project
name of the current project
Now
the current simulation time
ModelSim SE GUI Reference Manual, v10.2c
Overview
General Visual Elements
Table 1-4. Information Displayed in Status Bar (cont.)
Field
Description
Delta
the current simulation iteration number
Profile Samples
the number of profile samples collected during the
current simulation
Memory
the total memory used during the current simulation
environment
name of the current context (object selected in the
active Structure window)
line/column
line and column numbers of the cursor in the active
Source window
Total Coverage
the aggregated coverage, as a percent, of the top level
object in the design
coverage mode
recursive or non-recursive
Design Object Icons and Their Meanings
The color and shape of icons convey information about the language and type of a design
object. Table 1-5 shows the icon colors and the languages they indicate.
Table 1-5. Design Object Icons
Icon color
Design Language
light blue
Verilog or SystemVerilog
dark blue
VHDL
green
SystemC
magenta
PSL
orange
virtual object
Here is a list of icon shapes and the design object types they indicate:
Table 1-6. Icon Shapes and Design Object Types
Icon shape
Example
Design Object Type
Square
any scope (VHDL block, Verilog named block, SC module,
class, interface, task, function, and so forth.)
Square and
red asterix
SystemVerilog object, OVM, and UVM test bench scope or
object
Circle
process
ModelSim SE GUI Reference Manual, v10.2c
37
Overview
General Visual Elements
Table 1-6. Icon Shapes and Design Object Types (cont.)
Icon shape
Example
Design Object Type
Diamond
valued object (signals, nets, registers, SystemC channel, and
so forth.)
Diamond
and yellow
pulse on red
dot
an editable waveform created with the waveform editor
Diamond
and red
asterix
valued object (abstract)
Diamond
and green
arrow
indicates mode (In, Inout, Out) of an object port
Triangle
assertions (SV, PSL)
Triangle
caution sign on comparison object
Chevron
cover directives (SV, PSL)
Star
transaction; The color of the star for each transaction depends
on the language of the region in which the transaction stream
occurs: dark blue for VHDL, light blue for Verilog and
SystemVerilog, green for SystemC.
Window Time Display
There are two basic time designations used to control display of object values in many simulator
windows.
•
•
Now — The end-of-simulation time or the time at which the simulation has stopped.
Current Time — The current time displayed in an open window. The time may be any
time between 0 and the end of simulation, and is set in several ways:
o
by moving a wave cursor
o
by executing a causality trace that traces back through simulation time to find an
event
o
by interacting with the Current Time Label. Refer to Current Time Label for
more information.
A number of windows are dynamically linked to update when the time setting in one is changed.
The windows include the Dataflow, FSM, Objects, Schematic, Source, and Watch windows.
38
ModelSim SE GUI Reference Manual, v10.2c
Overview
General Visual Elements
Current Time Label
The Current Time Label allows you to interact with and change the simulation time displayed in
several windows. The Current Time Label displays the Now (end of simulation) or Current
Time, and allows you to search the time line for a transition on a selected object in the window
(Figure 1-20).
Figure 1-20. Current Time Label
When you run a simulation and it comes to an end, the Current Time Label displays the Now
time which is the end-of-simulation time. When you select a cursor in the Wave windowor in
the Wave viewer of the Schematic or Dataflow window, the Current Time Label automatically
changes to display the time of the current active cursor and updates the other windows to the
same time.
The Current Time Label includes a minimize/maximize button that allows you to hide or
display the label.
When you select an object in a window displaying the Current Time label, you can jump to the
previous or next transition for that object, with respect to the current time, by clicking the Find
Previous or Find Next button.
To change the display from showing the Current Time to showing the Now time (default), or
vice versa, click on the time display in the Current Time label to open a drop down menu
(Figure 1-21) or select View > Time Mode.
ModelSim SE GUI Reference Manual, v10.2c
39
Overview
General Visual Elements
Figure 1-21. Enter Current Time Value
40
ModelSim SE GUI Reference Manual, v10.2c
Chapter 2
Menus
The main window menu bar is dynamic based on which window is selected, resulting in some
menu items changing name or becoming unavailable (greyed out). This section describes the
menu items at the highest-possible level.
Window-specific Menu
Every window has a window-specific menu that appears in the menu bar between the Add and
Tools menus.
The menu options available pertain only to that window and are described in the windowspecific section of the chapter “Window Reference”.
ModelSim SE GUI Reference Manual, v10.2c
41
Menus
File Menu
File Menu
Table 2-1. File Menu — Item Description
Menu Item
New
Description
•
•
•
•
•
•
Open
Load
Close
Import
Open a file of any type.
•
•
Macro File — Load and run a macro file (.do or .tcl)
Debug Archive — load archived debug data for postsimulation analysis. Refer to the archive load command for
more information.
Close an opened file
•
•
•
•
•
•
42
Folder — create a new folder in the current directory
Source — create a new VHDL, Verilog or other source file
Project — create a new project
Library — create a new library and mapping
Debug Archive — archive debug data for post-simulation
analysis. Refer to the archive write command for more
information.
Library — import FPGA libraries
EVCD — import an extended VCD file previously created
with the ModelSim Waveform Editor. This item is enabled
only when a Wave window is active
Memory Data — initialize a memory by reloading a
previously saved memory file.
Test Plan — import a verification management test plan.
Only applies to the Verification Management Browser
window.
Column Layout — apply a previously saved column layout
to the active window
ModelSim SE GUI Reference Manual, v10.2c
Menus
File Menu
Table 2-1. File Menu — Item Description (cont.)
Menu Item
Export
Description
•
•
•
•
•
•
•
•
•
Waveform — export a created waveform
Tabular list — writes List window data to a file in tabular
format
Event list — writes List window data to a file as a series of
transitions that occurred during simulation
TSSI list — writes List window data to a file in TSSI
format
Image — saves an image of the active window
Memory Data — saves data from the selected memory in
the Memory List window or an active Memory Data
window to a text file
Column Layout — saves a column layout from the active
window
HTML — opens up a dialog where you can specify the
name of an HMTL file and the directory where it is saved
Save
Save as
These menu items change based on the active window.
Report
Produce a textual report based on the active window
Change Directory
Opens a browser for you to change your current directory. Not
available during a simulation, or if you have a dataset open.
Use Source
Specifies an alternative file to use for the current source file.
This mapping only exists for the current simulation. This
option is only available from the Structure window.
Source Directory
Control which directories are searched for source files.
Datasets
Manage datasets for the current session.
Environment
Set up how different windows should be updated, by dataset,
process, and/or context. This is only available when the
Structure, Locals, Processes, and Objects windows are active.
Page Setup
Print
Print Postscript
Manage the printing of information from the selected window.
Recent Directories
Display a list of recently opened working directories
Recent Projects
Display a list of recently opened projects
Close Window
Close the active window
Quit
Quit the application
ModelSim SE GUI Reference Manual, v10.2c
43
Menus
Edit Menu
Edit Menu
Table 2-2. Edit Menu — Item Description
Menu Item
Description
Undo
Redo
Alter your previous edit in a Source window.
Cut
Copy
Paste
Use or remove selected text.
Delete
Remove an object from the Wave and List windows
Clear
Clear the Transcript window
Select All
Unselect All
Change the selection of items in a window
Expand
Expand or collapse hierarchy information
Goto
Goto a specific line number in the Source window
Find
Open the find toolbar. Refer to the section “Find and Filter
Functions” for more information
Replace
Find and replace text in a Source window.
Signal Search
Search the Wave or List windows for a specified value, or the
next transition for the selected object
Find in Files
search for text in saved files
Previous Coverage Miss
Next Coverage Miss
Find the previous or next line with missed coverage in the
active Source window
View Menu
Table 2-3. View Menu — Item Description
44
Menu Item
Description
window name
Displays the selected window
New Window
Open additional instances of the Wave, List, Schematic or
Dataflow windows
Sort
Change the sort order of the Wave window
Filter
Filters information from the Objects and Structure windows.
Justify
Change the alignment of data in the selected window.
Properties
Displays file property information from the Files or Source
windows.
ModelSim SE GUI Reference Manual, v10.2c
Menus
Compile Menu
Compile Menu
Table 2-4. Compile Menu — Item Description
Menu Item
Description
Compile
Compile source files
Compile Options
Set various compile options.
SystemC Link
Collect the object files created in the different design libraries,
and uses them to build a shared library (.so) in the current work
library
Compile All
Compile all files in the open project. Disabled if you don’t
have a project open
Compile Selected
Compile the files selected in the project tab. Disabled if you
don’t have a project open
Compile Order
Set the compile order of the files in the open project. Disabled
if you don’t have a project open
Compile Report
report on the compilation history of the selected file(s) in the
project. Disabled if you don’t have a project open
Compile Summary
report on the compilation history of all files in the project.
Disabled if you don’t have a project open
Simulate Menu
Table 2-5. Simulate Menu — Item Description
Menu item
Description
Design Optimization
Open the Design Optimization dialog to configure simulation
optimizations
Start Simulation
Load the selected design unit
Runtime Options
Set various simulation runtime options
ModelSim SE GUI Reference Manual, v10.2c
45
Menus
Simulate Menu
Table 2-5. Simulate Menu — Item Description (cont.)
Menu item
Run
Description
•
•
•
•
•
•
•
46
Run <default> — run simulation for one default run length;
change the run length with Simulate > Runtime Options,
or use the Run Length text box on the toolbar
Run -All — run simulation until you stop it
Continue — continue the simulation
Run -Next — run to the next event time
Step — single-step the simulator
Step -Over — execute without single-stepping through a
subprogram call
Restart — reload the design elements and reset the
simulation time to zero; only design elements that have
changed are reloaded; you specify whether to maintain
various objects (logged signals, breakpoints, etc.)
Break
Stop the current simulation run
End Simulation
Quit the current simulation run
ModelSim SE GUI Reference Manual, v10.2c
Menus
Add Menu
Add Menu
Table 2-6. Add Menu — Item Description
Menu Item
Description
To Wave
Add information to the Wave window
To List
Add information to the List window
To Log
Add information to the Log file
To Schematic
Add information to the Schematic window
To Dataflow
Add information to the Dataflow window
Window Pane
Add an additional pane to the Wave window. You can remove
this pane by selecting Wave > Delete Window Pane.
Tools Menu
Table 2-7. Tools Menu — Item Description
Menu Item
Description
Waveform Compare
Access tasks for waveform comparison. Refer to the section
“Waveform Compare” for more information.
Code Coverage
Access tasks for code coverage. Refer to the chapter “Code
Coverage Analysis Window” for more information.
Functional Coverage
Access menus for configuring cover directives and filtering
functional coverage items. See “Functional Coverage Control
Options” and “Filtering Functional Coverage Data” for more
information.
Toggle Coverage
Add toggle coverage tracking. Refer to the section “Toggle
Coverage” for more information.
Coverage Save
Save the coverage metrics to a UCDB file.
Coverage Report
Save the coverage metrics to report file.
Coverage Configuration
Access menus for configuring coverage related items, such as
goal, weight and colorization. Refer to the secton “Viewing
Test Data in the GUI” for more information.
Profile
Access tasks for the memory and performance profilers. Refer
to the chapter “Profiling Performance and Memory Use” for
more information.
Breakpoints
Manage breakpoints
Trace
Perform signal trace actions.
Dataset Snapshot
Enable periodic saving of simulation data to a .wlf file.
ModelSim SE GUI Reference Manual, v10.2c
47
Menus
Tools Menu
Table 2-7. Tools Menu — Item Description (cont.)
48
Menu Item
Description
C Debug
Access tasks for the C Debug interface. Refer to the chapter “C
Debug” for more information.
JobSpy
Access tasks for the JobSpy utility. Refer to the chapter
“Monitoring Simulations with JobSpy” for more information.
Tcl
Execute or debug a Tcl macro.
Wildcard Filter
Refer to the section “Using the WildcardFilter Preference
Variable” for more information
Edit Preferences
Set GUI preference variables. Refer to the section “Simulator
GUI Preferences” for more information.
ModelSim SE GUI Reference Manual, v10.2c
Menus
Layout Menu
Layout Menu
Table 2-8. Layout Menu — Item Description
Menu Item
Description
Reset
Reset the GUI to the default appearance for the selected layout.
Save Layout As
Save your reorganized view to a custom layout. Refer to the
section “Customizing the Simulator GUI Layout” for more
information.
Configure
Configure the layout-specific behavior of the GUI. Refer to the
section “Configure Window Layouts Dialog Box” for more
information.
Delete
Delete a customized layout. You can not delete any of the five
standard layouts.
layout name
Select a standard or customized layout.
Bookmarks Menu
Table 2-9. Bookmarks Menu — Item Description
Menu Item
Description
Add
Clicking this button bookmarks the current view of the Wave
window.
Add Custom
Opens the New Bookmark dialog box.
Manage
Opens the Manage Bookmarks dialog box.
•
•
•
•
Delete All
Reload from File
Active Window Only
All Windows.
Active Window Only
All Windows.
Window Menu
Table 2-10. Window Menu — Item Description
Menu Item
Description
Cascade
Tile Horizontally
Tile Vertically
Arrange all undocked windows. These options do not impact
any docked windows.
Icon Children
Icon All
Deicon All
Minimize (Icon) or Maximize (Deicon) undocked windows.
These options do not impact any docked windows.
ModelSim SE GUI Reference Manual, v10.2c
49
Menus
Window Menu
Table 2-10. Window Menu — Item Description (cont.)
50
Menu Item
Description
Show Toolbar
Toggle the appearance of the Toolbar frame of the Main
window
Show Window Headers
Toggle the appearance of the window headers. Note that you
will be unable to rearrange windows if you do not show the
window headers.
FocusFollowsMouse
Mouse pointer makes window active when pointer hovers in
the window briefly. Refer to Selecting the Active Window for
more information.
Keyboard Shortcuts
Opens the Keyboard Shortcuts dialog box. Refer to User
Defined Keyboard Shortcuts for more information.
Customize Toolbar
Add a button to the toolbar frame.
Toolbars
Toggle the appearance of available toolbars. Similar behavior
to right-clicking in the toolbar frame.
window name
Make the selected window active.
Windows
Display the Windows dialog box, which allows you to activate,
close or undock the selected window(s).
ModelSim SE GUI Reference Manual, v10.2c
Menus
Help Menu
Help Menu
Table 2-11. Help Menu — Item Description
Menu Item
Description
About
Display ModelSim application information.
Release Notes
Display the current Release Notes in the ModelSim Notepad
editor. You can find past release notes in the
<install_dir>/docs/rlsnotes/ directory.
Welcome Window
Display the Important Information splash screen. By default
this window is displayed on startup. You can disable the
automatic display by toggling the Don’t show this dialog
again radio button.
Command Completion
Toggles the command completion dropdown box in the
transcript window.
When you start typing a command at the Transcript prompt, a
dropdown box appears which lists the available commands
matching what has been typed so far. You may use the Up and
Down arrow keys or the mouse to select the desired command.
When a unique command has been entered, the command
usage is presented in the drop down box.
Register File Types
Associate files types (such as .v, .sv, .vhd, .do) with the
product. These associations are typically made upon install, but
this option allows you to update your system in case changes
have been made since installation.
ModelSim
Documentation InfoHub
Open the HTML-based portal for all PDF and HTML
documentation.
ModelSim
Documentation - PDF
Bookcase
Open the PDF-based portal for the most commonly used PDF
documents.
Tcl Help
Open the Tcl command reference (man pages) in Windows
help format.
Tcl Syntax
Open the Tcl syntax documentation in your web browser.
Tcl Man pages
Open the Tcl/Tk manual in your web browser.
Technotes
Open a technical note in the ModelSim Notepad editor.
ModelSim SE GUI Reference Manual, v10.2c
51
Menus
Help Menu
52
ModelSim SE GUI Reference Manual, v10.2c
Chapter 3
Toolbars
The Main window contains a toolbar frame that displays context-specific toolbars. The
following sections describe the toolbars and their associated buttons.
You can determine the name of a toolbar in the GUI by right-clicking on the toolbar and looking
for the bolded name in the pop-up menu.
ATV Toolbar
The ATV toolbar allows you to control aspects of the Assertion Thread Viewer.
Figure 3-1. ATV Toolbar
Table 3-1. ATV Toolbar Buttons
Button
Name
Shortcuts
Description
View Grid
Menu: ATV > View Grid
creates horizontal grid lines
from the assertion expression
through the Thread Viewer
pane
Ascending
Expressions
Menu: ATV > Ascending
Expressions
changes the display of
expressions in the Expressions
pane from descending order
(default) to ascending order
Annotate
Local Vars
Menu: ATV > Annotate
Local Vars
displays annotation of local
variables in the Thread Viewer
pane
Show Local
Vars
Menu: ATV > Show Local
Vars
displays the Local Variables
pane at the bottom of the
viewer
Show Design Menu: ATV > Show Design displays the Design Objects
Objects
Objects
pane at the bottom of the
ATVviewer
ModelSim SE GUI Reference Manual, v10.2c
53
Toolbars
Analysis Toolbar
Analysis Toolbar
The Analysis (coverage) toolbar allows you to control aspects of the Code Coverage Analysis
window.
Figure 3-2. Analysis Toolbar
Table 3-2. Analysis Toolbar Buttons
Button
Name
Shortcuts
Description
Type
Command: view A dropdown box that
canalysis
allows you to specify the
type of code coverage to
view in the Code
Coverage Analysis
Window.
Covered
Menu: N/A
All covered (hit) items are
displayed.
Missed
Menu: N/A
All missed items (not
executed) are displayed.
Excluded
Menu: N/A
Restores the precision to
the default value (2).
Bookmarks Toolbar
The Bookmark toolbar allows you to manage your bookmarks of the Wave window
Figure 3-3. Bookmarks Toolbar
54
ModelSim SE GUI Reference Manual, v10.2c
Toolbars
Column Layout Toolbar
Table 3-3. Bookmarks Toolbar Buttons
Button
Name
Shortcuts
Description
Add
Bookmark
Command Wave window
only: bookmark add wave
Menu Wave window only:
Add > To Wave >
Bookmark
Clicking this button
bookmarks the current view of
the active window.
CommandWave window
only: bookmark delete wave
-all
Removes all bookmarks, after
prompting for your
confirmation.
Delete All
Bookmarks
Click and hold the button to
open a drop down menu with
the following options:
• Add Current View
• Add Custom ...
• Set Default Action
Click and hold the button to
open a drop down menu with
the following options:
• Active Window
• All Windows
Manage
Bookmarks
None
Displays the Manage
Bookmarks dialog box.
Reload from
File
None
Reloads bookmarks from the
bookmarks.do file.
• Set Default Action
Jump to
Bookmark
CommandWave window
only: bookmark goto wave
<name>
Displays bookmarks grouped
by window. Select the
bookmark you want to display.
Column Layout Toolbar
The Column Layout toolbar allows you to specify the column layout for the active window.
Figure 3-4. Column Layout Toolbar
ModelSim SE GUI Reference Manual, v10.2c
55
Toolbars
Compile Toolbar
Table 3-4. Change Column Toolbar Buttons
Button
Name
Shortcuts
Description
Column
Layout
Menu:
Verification
Browser >
Configure
Column Layout
A dropdown box that
allows you to specify the
column layout for the
active window.
The Column Layout dropdown menu allows you to select pre-defined column layouts for the
active window. For example, the layouts you can select for the Verification Management
Browser Window include:
•
•
•
•
AllColumns — displays all available columns.
•
•
AllCoverage — displays all columns related to coverage statistics.
•
Testplan — displays all columns containing data about the testplan, including Testplan
Section / Coverage Link, Type, Goal, % of Goal, Weight.
•
•
•
•
AllCoverageRanked — displays all columns related to ranking results.
Default — displays only columns that are displayed by default.
CodeCoverageRanked — displays all columns related to ranked code coverage results.
FunctionalCoverageRanked - displays all columns related to ranked functional coverage
results.
TestData — displays all columns containing data about the test, including information
about how and when the coverage data was generated.
FunctionalCoverage — displays all columns related to functional coverage statistics.
CodeCoverage — displays all columns related to code coverage statistics.
[Configure ColumnLayout . . .] — opens the Configure Column Layout dialog, which
allows you to create, edit, remove, copy, or rename a column layout. See Configuring
the Column Layout.
Compile Toolbar
The Compile toolbar provides access to compile and simulation actions.
Figure 3-5. Compile Toolbar
56
ModelSim SE GUI Reference Manual, v10.2c
Toolbars
Coverage Toolbar
Table 3-5. Compile Toolbar Buttons
Button
Name
Shortcuts
Description
Compile
Command: vcom or vlog
Menu: Compile > Compile
Opens the Compile Source
Files dialog box.
Compile All
Command: vcom or vlog
Menu: Compile > Compile
all
Compiles all files in the open
project.
Simulate
Command: vsim
Menu: Simulate > Start
Simulation
Opens the Start Simulation
dialog box.
Break
Menu: Simulate > Break
Hotkey: Break
Stop a compilation,
elaboration, or the current
simulation run.
Coverage Toolbar
The Coverage toolbar provides tools for filtering code coverage data in the Structure and
Instance Coverage windows.
Figure 3-6. Coverage Toolbar
Table 3-6. Coverage Toolbar Buttons
Button
Name
Shortcuts
Description
Enable
Filtering
None
Enables display filtering of
coverage statistics in the
Structure and Instance
Coverage windows.
Threshold
Above
None
Displays all coverage statistics
above the Filter Threshold for
selected columns.
Threshold
Below
None
Displays all coverage statistics
below the Filter Threshold for
selected columns
ModelSim SE GUI Reference Manual, v10.2c
57
Toolbars
Dataflow Toolbar
Table 3-6. Coverage Toolbar Buttons (cont.)
Button
Name
Shortcuts
Description
Filter
Threshold
None
Specifies the display coverage
percentage for the selected
coverage columns
Statement
None
Applies the display filter to all
Statement coverage columns in
the Structure and Instance
Coverage windows.
Branch
None
Applies the display filter to all
Branch coverage columns in
the Structure and Instance
Coverage windows.
Condition
None
Applies the display filter to all
Condition coverage columns in
the Structure and Instance
Coverage windows.
Expression
None
Applies the display filter to all
Expression coverage columns
in the Structure and Instance
Coverage windows.
Toggle
None
Applies the display filter to all
Toggle coverage columns in
the Structure and Instance
Coverage windows.
Dataflow Toolbar
The Dataflow toolbar provides access to various tools to use in the Dataflow window.
Figure 3-7. Dataflow Toolbar
Table 3-7. Dataflow Toolbar Buttons
Button
58
Name
Shortcuts
Description
Trace Input
Net to Event
Menu: Tools > Trace >
Trace next event
Move the next event cursor to
the next input event driving the
selected output.
ModelSim SE GUI Reference Manual, v10.2c
Toolbars
FSM Toolbar
Table 3-7. Dataflow Toolbar Buttons (cont.)
Button
Name
Shortcuts
Description
Trace Set
Menu: Tools > Trace >
Trace event set
Jump to the source of the
selected input event.
Trace Reset
Menu: Tools > Trace >
Trace event reset
Return the next event cursor to
the selected output.
Trace Net to
Driver of X
Menu: Tools > Trace >
TraceX
Step back to the last driver of
an unknown value.
Expand Net None
to all Drivers
Display driver(s) of the
selected signal, net, or register.
Expand Net None
to all Drivers
and Readers
Display driver(s) and reader(s)
of the selected signal, net, or
register.
Expand Net None
to all Readers
Display reader(s) of the
selected signal, net, or register.
Show Wave
Display the embedded wave
viewer pane.
Menu: Dataflow >
Show Wave
FSM Toolbar
The FSM toolbar provides access to tools that control the information displayed in the FSM
Viewer window.
Figure 3-8. FSM Toolbar
Table 3-8. FSM Toolbar Buttons
Button
Name
Shortcuts
Description
Show State
Counts
Menu: FSM View > Show
State Counts
(only available when
simulating with -coverage)
Displays the coverage count
over each state.
ModelSim SE GUI Reference Manual, v10.2c
59
Toolbars
Help Toolbar
Table 3-8. FSM Toolbar Buttons (cont.)
Button
Name
Shortcuts
Description
Show
Transition
Counts
Menu: FSM View > Show
Transition Counts
(only available when
simulating with -coverage)
Displays the coverage count
for each transition.
Show
Transition
Conditions
Menu: FSM View > Show
Transition Conditions
Displays the conditions of each
transition.
Track Wave
Cursor
Menu: FSM View > Track
Wave Cursor
The FSM Viewer tracks your
current cursor location.
Enable Info
Menu: FSM View > Enable Displays information when
Mode Popups Info Mode Popups
you mouse over each state or
transition
Previous
State
None
Steps to the previous state in
the FSM Viewer window.
Next State
None
Steps to the next state in the
FSM Viewer window.
Help Toolbar
The Help toolbar provides a way for you to search the HTML documentation for a specified
string. The HTML documentation will be displayed in a web browser.
Figure 3-9. Help Toolbar
Table 3-9. Help Toolbar Buttons
Button
60
Name
Shortcuts
Description
Search
Documentation
None
A text entry box for your
search string.
Search
Documentation
Hotkey: Enter
Activates the search for the
term you entered into the text
entry box.
ModelSim SE GUI Reference Manual, v10.2c
Toolbars
Layout Toolbar
Layout Toolbar
The Layout toolbar allows you to select a predefined or user-defined layout of the graphical user
interface. Refer to the section “Customizing the Simulator GUI Layout” for more information.
Figure 3-10. Layout Toolbar
Table 3-10. Layout Toolbar Buttons
Button
Name
Shortcuts
Description
Change
Layout
Menu: Layout >
<layoutName>
A dropdown box that allows
you to select a GUI layout.
• NoDesign
• Simulate
• Coverage
• VMgmt
Memory Toolbar
The Memory toolbar provides access to common functions.
Figure 3-11. Memory Toolbar
Table 3-11. Memory Toolbar Buttons
Button
Name
Shortcuts
Description
Split Screen
Menu: Memory >
Split Screen
Splits the memory window.
Goto Address
Highlights the first element of
the specified address.
Mode Toolbar
The Mode toolbar provides access to tools for controlling the mode of mouse navigation.
ModelSim SE GUI Reference Manual, v10.2c
61
Toolbars
Objectfilter Toolbar
Figure 3-12. Mode Toolbar
Table 3-12. Mode Toolbar Buttons
Button
Name
Shortcuts
Description
Select Mode
Set the left mouse button to
Menu: Dataflow or
select mode and middle mouse
Schematic >
Mouse Mode > Select Mode button to zoom mode.
Zoom Mode
Menu: Dataflow or
Schematic >
Mouse Mode > Zoom Mode
Set left mouse button to zoom
mode and middle mouse
button to pan mode.
Pan Mode
Menu: Dataflow or
Schematic >
Mouse Mode > Pan Mode
Set left mouse button to pan
mode and middle mouse
button to zoom mode.
Two Cursor
Mode
Menu: Wave >
Mouse Mode > Two Cursor
Sets two cursors in Wave
window. First cursor moves
with LMB, second cursor with
MMB.
Edit Mode
Menu: Wave or Dataflow >
Mouse Mode > Edit Mode
Set mouse to Edit Mode,
where you drag the left mouse
button to select a range and
drag the middle mouse button
to zoom.
Stop
Drawing
None
Halt any drawing currently
happening in the window.
Objectfilter Toolbar
The Objectfilter toolbar provides filtering of design objects appearing in the Objects window.
Figure 3-13. Objectfilter Toolbar
62
ModelSim SE GUI Reference Manual, v10.2c
Toolbars
Precision Toolbar
Table 3-13. Objectfilter Toolbar Buttons
Button
Name
Shortcuts
Description
View Inputs
Only
None
Changes the view of the Objects Window
to show inputs.
View
None
Outputs Only
Changes the view of the Objects Window
to show outputs.
View Inouts
Only
None
Changes the view of the Objects Window
to show inouts.
Vies Internal
Signals
None
Changes the view of the Objects Window
to show Internal Signals.
Reset All
Filters
None
Clears the filtering of Objects Window
entries and displays all objects.
Change Filter None
Opens the Filter Objects dialog box.
Precision Toolbar
The Precision toolbar allows you to control the precision of the data in the Verification
Management windows (Browser, Tracker, Results Analysis).
Figure 3-14. Precision Toolbar
Table 3-14. Precision Toolbar Buttons
Button
Name
Shortcuts
Description
Set Precision Menu:
for VMgmt
Verification
Browser >
Set Precision
A text entry box that
allows you to control the
precision of the data in the
Verification Browser
window.
Restore
Default
Precision
Restores the precision to
the default value (2).
ModelSim SE GUI Reference Manual, v10.2c
63
Toolbars
Process Toolbar
Process Toolbar
The Process toolbar contains three toggle buttons (only one can be active at any time) that
controls the view of the Process window.
Figure 3-15. Process Toolbar
Table 3-15. Process Toolbar Buttons
Button
Name
Shortcuts
Description
View Active
Processes
Menu: Process > Active
Changes the view of the
Processes Window to only
show active processes.
View
Processes in
Region
Menu: Process > In Region
Changes the view of the
Processes window to only
show processes in the active
region.
Menu: Process > Design
View
Processes for
the Design
Changes the view of the
Processes window to show
processes in the design.
View Process Menu: Process > Hierarchy
hierarchy
Changes the view of the
Processes window to show
process hierarchy.
Profile Toolbar
The Profile toolbar provides access to tools related to the profiling windows (Ranked, Calltree,
Design Unit, and Structural.
Figure 3-16. Profile Toolbar
Table 3-16. Profile Toolbar Buttons
Button
64
Name
Shortcuts
Description
Collapse
Sections
Menu: Tools > Profile >
Collapse Sections
Toggle the reporting for
collapsed processes and
functions.
ModelSim SE GUI Reference Manual, v10.2c
Toolbars
Schematic Toolbar
Table 3-16. Profile Toolbar Buttons (cont.)
Button
Name
Shortcuts
Description
Profile
Cutoff
None
Display performance and
memory profile data equal to
or greater than set percentage.
Refresh
Profile Data
None
Refresh profile performance
and memory data after
changing profile cutoff.
Save Profile
Results
Menu: Tools > Profile >
Profile Report
Save profile data to output file
(prompts for file name).
Schematic Toolbar
The Schematic toolbar provides access to tools for manipulating highlights and signals in the
Dataflow and Schematic windows.
Figure 3-17. Schematic Toolbar
Table 3-17. Schematic Toolbar Buttons
Button
Name
Shortcuts
Description
Trace Input
Net to Event
Menu: Tools > Trace >
Trace next event
Move the next event cursor to
the next input event driving the
selected output.
Trace Set
Menu: Tools > Trace >
Trace event set
Jump to the source of the
selected input event.
Trace Reset
Menu: Tools > Trace >
Trace event reset
Return the next event cursor to
the selected output.
Trace Net to
Driver of X
Menu: Tools > Trace >
TraceX
Step back to the last driver of
an unknown value.
Expand Net None
to all Drivers
Display driver(s) of the
selected signal, net, or register.
Expand Net None
to all Drivers
and Readers
Display driver(s) and reader(s)
of the selected signal, net, or
register.
ModelSim SE GUI Reference Manual, v10.2c
65
Toolbars
Simulate Toolbar
Table 3-17. Schematic Toolbar Buttons (cont.)
Button
Name
Shortcuts
Description
Expand Net None
to all Readers
Display reader(s) of the
selected signal, net, or register.
Remove All
Highlights
Menu: Dataflow >
Remove Highlight
or
Schematic > Edit > Remove
Highlight
Clear the red highlighting
identifying the path you’ve
traversed through the design.
Menu:
Dataflow > Delete
or
Schematic > Edit > Delete
Schematic > Edit > Delete
All
Delete the selected signal.
Menu: Dataflow >
Regenerate
or
Schematic > Edit >
Regenerate
Redraws the current schematic
view to better take advantage
of the available space. For
example, after adding or
removing elements.
Delete
Content
Regenerate
Enable 1Click Mode
Show Wave
Click and hold the button to
open a drop down menu with
the following options:
• Remove All Highlights
• Remove Selected
Highlights
• Set Default Action
Click and hold the button to
open a drop down menu with
the following options:
• Delete Selected
• Delete All
• Set Default Action
Enables single-click sprout
expansion. Default is doubleclick to sprout.
Menu: Schematic >
Show Wave
Display the embedded Wave
Viewer pane.
Simulate Toolbar
The Simulate toolbar provides various tools for controlling your active simulation.
Figure 3-18. Simulate Toolbar
66
ModelSim SE GUI Reference Manual, v10.2c
Toolbars
Simulate Toolbar
Table 3-18. Simulate Toolbar Buttons
Button
Name
Shortcuts
Description
Source
None
Hyperlinking
Toggles display of hyperlinks
in design source files.
Show Cause
Traces a selected wave signal
from the current time back to
the first sequential element.
See Show Cause Button for
more information.
• Set Default Action
Command: find drivers
-active
Environment Command: env ..
Up
Menu: File > Environment
Changes your environment up
one level of hierarchy.
Environment Command: env -back
Back
Menu: File > Environment
Change your environment to
its previous location.
Environment Command: env -forward
Forward
Menu: File > Environment
Change your environment
forward to a previously
selected environment.
Restart
Command: restart
Menu: Simulate > Run >
Restart
Reload the design elements
and reset the simulation time to
zero, with the option of
maintaining various settings
and objects.
Run Length
Command: run
Menu: Simulate >
Runtime Options
Specify the run length for the
current simulation.
Run
Command: run
Menu: Simulate > Run >
Run default_run_length
Run the current simulation for
the specified run length.
Continue
Run
Command: run
-continue
Menu: Simulate > Run >
Continue
Continue the current
simulation run until the end of
the specified run length or until
it hits a breakpoint or specified
break event.
Run All
Command: run -all
Menu: Simulate > Run >
Run -All
Run the current simulation
forever, or until it hits a
breakpoint or specified break
event.
ModelSim SE GUI Reference Manual, v10.2c
67
Toolbars
Simulate Toolbar
Table 3-18. Simulate Toolbar Buttons (cont.)
Button
Name
Shortcuts
Description
Break
Menu: Simulate > Break
Hotkey: Break
Immediate stop of a
compilation, elaboration, or
simulation run. Similar to
hitting a breakpoint if the
simulator is in the middle of a
process.
Stop -sync
None
Stop simulation the next time
time/delta is advanced.
C Interrupt
Command: cdbg interrupt
Menu: Tools > C Debug >
C Interrupt
Reactivate the C debugger
when stopped in HDL code.
Performance
Profiling
Menu: Tools > Profile >
Performance
Enable collection of statistical
performance data.
Memory
Profiling
Menu: Tools > Profile >
Memory
Enable collection of memory
usage data.
Edit
Breakpoints
Menu: Tools > Breakpoint
Enable breakpoint editing,
loading, and saving.
Show Cause Button
Clicking this button initiates a trace on a signal event back to the first sequential driving
process. When you click-and-hold the button you can access additional options via a dropdown
menu, as shown in Figure 3-19.
68
ModelSim SE GUI Reference Manual, v10.2c
Toolbars
Source Toolbar
Figure 3-19. Show Cause Dropdown Menu
•
•
•
•
•
•
•
•
•
•
•
Show Cause — Refer to “Tracing to the First Sequential Process”.
Show Driver — Refer to “Tracing to the Immediate Driving Process”.
Show Root Cause — Refer to “Tracing to the Root Cause”.
Show ‘X’ Cause (ChaseX) — Refer to “Tracing to the Root Cause of an ‘X’”
Show All Possible Drivers — Refer to “Finding All Possible Drivers”.
Show Cause from Time — Refer to “Tracing from a Specific Time”.
Show Driver from Time — Refer to “Tracing from a Specific Time”.
Show Root Cause from Time — Refer to “Tracing from a Specific Time”.
View Path Details — Refer to “Viewing Causality Path Details”.
Preferences — Refer to “Setting Causality Traceback Preferences”.
Set Default Action — Selecting one of the items from the dropdown menu sets that
item as the default action when you click the Event Traceback button. The title of the
selection is shown in bold type in the Event Traceback dropdown menu and two
asterisks ( **) are placed after the title to indicate the current default action. For
example, Show Cause is the default action in Figure 3-19.
For more information, refer to “Using Causality Traceback”.
Source Toolbar
The Source toolbar allows you to perform several activities on Source windows.
ModelSim SE GUI Reference Manual, v10.2c
69
Toolbars
Standard Toolbar
Figure 3-20. Source Toolbar
Table 3-19. Source Toolbar Buttons
Button
Name
Shortcuts
Description
Previous
Zero Hits
None
Jump to previous line with
zero coverage.
Next Zero
Hits
None
Jump to next line with zero
coverage.
Show
Language
Templates
Menu: Source >
Show Language Templates
Display language templates in
the left hand side of every open
source file.
Source
Annotation
Menu: Source >
Show Annotation
Allows Debugging with
Source Annotation in every
open source file.
Clear
Bookmarks
Menu: Source >
Clear Bookmarks
Removes any bookmarks in
the active source file.
Standard Toolbar
The Standard toolbar contains common buttons that apply to most windows.
Figure 3-21. Standard Toolbar
70
ModelSim SE GUI Reference Manual, v10.2c
Toolbars
Standard Toolbar
Table 3-20. Standard Toolbar Buttons
Button
Name
Shortcuts
Description
New File
Menu: File > New > Source
Opens a new Source text file.
The icon changes to reflect the
default file type set with the
Set Default Action menu pick
from the dropdown menu.
Click and hold the button to
open a dropdown menu with
the following options:
• VHDL
• Verilog
• SystemC
• SystemVerilog
• Do
• Other
• Set Default Action
Open
Menu: File > Open
Opens the Open File dialog
Save
Menu: File > Save
Saves the contents of the active
window or
Saves the current wave
window display and signal
preferences to a macro file
(DO fie).
Reload
Command: Dataset Restart
Menu: File > Datasets
Reload the current dataset.
Print
Menu: File > Print
Opens the Print dialog box.
Cut
Menu: Edit > Cut
Hotkey: Ctrl+x
Copy
Menu: Edit > Copy
Hotkey: Ctrl+c
Paste
Menu: Edit > Paste
Hotkey: Ctrl+v
Undo
Menu: Edit > Undo
Hotkey: Ctrl+z
ModelSim SE GUI Reference Manual, v10.2c
71
Toolbars
Standard Toolbar
Table 3-20. Standard Toolbar Buttons (cont.)
Button
Name
Shortcuts
Redo
Menu: Edit > Redo
Hotkey: Ctrl+y
Description
Add Selected Menu: Add > to Wave
to Window
Hotkey: Ctrl+w
Clicking adds selected objects
to the Wave window. Refer to
“Add Selected to Window
Button” for more information
about the dropdown menu
selections. 1
• Set Default Action
Find
Menu: Edit > Find
Hotkey: Ctrl+f (Windows)
or Ctrl+s (UNIX)
Opens the Find dialog box.
Collapse All
Menu: Edit > Expand >
Collapse All
1. You can set the default insertion location in the Wave window from menus and hotkeys with the
PrefWave(InsertMode) preference variable.
Add Selected to Window Button
This button is available when you have selected an object in any of the following windows:
Dataflow, List, Locals, Memory, Objects, Process, Schematic, Structure, Watch, and Wave
windows. Using a single click, the objects are added to the Wave window. However, if you
click-and-hold the button you can access additional options via a dropdown menu, as shown in
Figure 3-22.
Figure 3-22. Add Selected to Window Dropdown Menu
72
ModelSim SE GUI Reference Manual, v10.2c
Toolbars
Step Toolbar
•
Add to Wave (Anchor Location) — Adds selected signals above the Insertion Point Bar
in the Pathname Pane by default.
•
Add to Wave (Append Point) — Adds selected signals below the insertion pointer in the
Pathname Pane.
•
•
•
•
•
•
•
Add to Wave (End) — Adds selected signals after the last signal in the Wave Window.
•
Add to Wave (Top) — Adds selected signals above the first signal in the Wave window.
Add to List — Adds selected objects to the List Window.
Add to Dataflow — Adds selected objects to the Dataflow Window.
Add to Schematic — Adds selected objects to the Schematic Window.
Add to Watch — Adds selected objects to the Watch Window.
Set Default Action — Selecting one of the items from the dropdown menu sets that item
as the default action when you click the Add Selected to Window button. The title of
the selection is shown in bold type in the Add Selected to Window dropdown menu and
two asterisks ( **) are placed after the title to indicate the current default action. For
example, Add to Wave (Anchor Location) is the default action in Figure 3-22.
You can change the default
Step Toolbar
The Step toolbar allows you to step through your source code.
Figure 3-23. Step Toolbar
Table 3-21. Step Toolbar Buttons
Button
Name
Shortcuts
Description
Step Into
Command: step
Menu: Simulate > Run >
Step
Step the current simulation to
the next statement.
Step Over
Command: step -over
Menu: Simulate > Run >
Step -Over
Execute HDL statements,
treating them as simple
statements instead of entered
and traced line by line.
ModelSim SE GUI Reference Manual, v10.2c
73
Toolbars
Wave Toolbar
Table 3-21. Step Toolbar Buttons (cont.)
Button
Name
Shortcuts
Description
Step Out
Command: step -out
Step the current simulation out
of the current function or
procedure.
Step Into
Current
Command: step -current
Step the simulation into the
current instance, process, or
thread.
Step Over
Current
Command: step -over
-current
Step the simulation over the
current instance, process, or
thread.
Step Out
Current
Command: step -out
-current
Step the simulation out of the
current instance, process, or
thread.
Wave Toolbar
The Wave toolbar allows you to perform specific actions in the Wave window.
Figure 3-24. Wave Toolbar
Table 3-22. Wave Toolbar Buttons
Button
Name
Shortcuts
Description
Show Drivers
None
Display driver(s) of the
selected signal, net, or
register in the Schematic and
Source windows.
Show Drivers
(source only)
Display drivers only in the
Source window
The source window is not
shown if there are no
drivers.
74
ModelSim SE GUI Reference Manual, v10.2c
Toolbars
Wave Toolbar
Table 3-22. Wave Toolbar Buttons (cont.)
Button
Name
Shortcuts
Description
Show Readers None
Display reader(s) of the
selected signal, net, or
register in the Dataflow
window.
Show Readers
(source only)
Display drivers only in the
Source window
The source window is not
shown if there are no
readers.
Add
Contributing
Signals
Menu: Add > To Wave
> Contributing Signals
Creates a group labeled
Contributors: <name>,
where <name> is the name
of the currently selected
signal. This group contains
the inputs to the process
driving <name>.
Wave Search
Box
Click on the box when in
transition mode (Falling
Edge, Rising Edge, or
Any Transition) to cycle
through these options.
Text-entry box for the search
string. Dropdown button
displays previous search
strings. Long search times
result in the display of a stop
icon you can use to cancel
the search.
Search
Previous: Shift+Enter
Previous/Next Next: enter
Searches for the next
occurrence of the string,
either backward or forward
in time, from the cursor.
Search
Options
Dropdown button to:
• Change Mode: value,
rising edge, falling edge,
or any transition.
• Display the Wave Signal
Search Dialog Box for
advanced search
behavior.
• Clear the value history.
Using the Wave Search Box
You can use the Wave Search box to search the timeline of a selected signal for transitions to a
specific value, or just for transitions themselves.
ModelSim SE GUI Reference Manual, v10.2c
75
Toolbars
Wave Compare Toolbar
1. Select a signal in the left-hand side of the Wave window.
2. Place a wave cursor where you want to begin the search.
3. Enter a value in the Wave Search box. The value must be of a compatible format type
for the signal you selected.
Alternatively you can use the Search Options button to change the mode from “value” to
Rising Edge, Falling Edge, or Any Transition. This populates the Wave Search box with
the selected transition type.
4. Use the Search Reverse or Search Forward buttons to locate the next occurrence of the
value (or transition).
For large simulations, if the search takes a long time, the Wave Search box will display a
stop icon you can click to stop the search.
Wave Compare Toolbar
The Wave Compare toolbar allows you to quickly find differences in a waveform comparison.
Figure 3-25. Wave Compare Toolbar
Table 3-23. Wave Compare Toolbar Buttons
Button
76
Name
Shortcuts
Description
Find First
Difference
None
Find the first difference in a
waveform comparison
Find
Previous
Annotated
Difference
None
Find the previous annotated
difference in a waveform
comparison
Find
Previous
Difference
None
Find the previous difference in
a waveform comparison
Find Next
Difference
None
Find the next difference in a
waveform comparison
Find Next
Annotated
Difference
None
Find the next annotated
difference in a waveform
comparison
ModelSim SE GUI Reference Manual, v10.2c
Toolbars
Wave Cursor Toolbar
Table 3-23. Wave Compare Toolbar Buttons (cont.)
Button
Name
Shortcuts
Description
Find Last
Difference
None
Find the last difference in a
waveform comparison
Wave Cursor Toolbar
The Wave Cursor toolbar provides various tools for manipulating cursors in the Wave window.
Figure 3-26. Wave Cursor Toolbar
Table 3-24. Wave Cursor Toolbar Buttons
Button
Name
Shortcuts
Description
Insert Cursor None
Adds a new cursor to the active
Wave window.
Delete
Cursor
Menu: Wave >
Delete Cursor
Deletes the active cursor.
Find
Previous
Transition
Menu: Edit > Signal Search
Hotkey: Shift + Tab
Moves the active cursor to the
previous signal value change
for the selected signal.
Find Next
Transition
Menu: Edit > Signal Search
Hotkey: Tab
Moves the active cursor to the
next signal value change for
the selected signal.
Find
Previous
Falling Edge
Menu: Edit > Signal Search
Moves the active cursor to the
previous falling edge for the
selected signal.
Find Next
Falling Edge
Menu: Edit > Signal Search
Moves the active cursor to the
next falling edge for the
selected signal.
Find
Previous
Rising Edge
Menu: Edit > Signal Search
Moves the active cursor to the
previous rising edge for the
selected signal.
Find Next
Rising Edge
Menu: Edit > Signal Search
Moves the active cursor to the
next rising edge for the
selected signal.
ModelSim SE GUI Reference Manual, v10.2c
77
Toolbars
Wave Edit Toolbar
Wave Edit Toolbar
The Wave Edit toolbar provides easy access to tools for modifying an editable wave.
Figure 3-27. Wave Edit Toolbar
Table 3-25. Wave Edit Toolbar Buttons
Button
78
Name
Shortcuts
Description
Insert Pulse
Menu: Wave >
Wave Editor > Insert Pulse
Command: wave edit
insert_pulse
Insert a transition at the
selected time.
Delete Edge
Delete the selected transition.
Menu: Wave >
Wave Editor > Delete Edge
Command: wave edit delete
Invert
Invert the selected section of
Menu: Wave >
the waveform.
Wave Editor > Invert
Command: wave edit invert
Mirror
Mirror the selected section of
Menu: Wave >
the waveform.
Wave Editor > Mirror
Command: wave edit mirror
Change
Value
Menu: Wave >
Wave Editor > Value
Command: wave edit
change_value
Stretch Edge
Move the selected edge by
Menu: Wave >
Wave Editor > Stretch Edge increasing/decreasing
Command: wave edit stretch waveform duration.
Move Edge
Menu: Wave >
Wave Editor > Move Edge
Command: wave edit move
Extend All
Waves
Increase the duration of all
Menu: Wave >
editable waves.
Wave Editor >
Extend All Waves
Command: wave edit extend
Change the value of the
selected section of the
waveform.
Move the selected edge
without increasing/decreasing
waveform duration.
ModelSim SE GUI Reference Manual, v10.2c
Toolbars
Wave Expand Time Toolbar
Wave Expand Time Toolbar
The Wave Expand Time toolbar provides access to enabling and controlling wave expansion
features.
Figure 3-28. Wave Expand Time Toolbar
Table 3-26. Wave Expand Time Toolbar Buttons
Button
Name
Shortcuts
Description
Expanded
Time Off
Menu: Wave > Expanded
Time > Off
turns off the expanded time
display (default mode)
Expanded
Time Deltas
Mode
Menu: Wave > Expanded
Time > Deltas Mode
displays delta time steps
Expanded
Time Events
Mode
Menu: Wave > Expanded
Time > Events Mode
displays event time steps
Expand All
Time
Menu: Wave > Expanded
Time > Expand All
expands simulation time over
the entire simulation time
range, from 0 to current time
Expand Time Menu: Wave > Expanded
Time > Expand Cursor
at Active
Cursor
expands simulation time at the
simulation time of the active
cursor
Collapse All
Time
Menu: Wave > Expanded
Time > Collapse All
collapses simulation time over
entire simulation time range
Collapse
Time at
Active
Cursor
Menu: Wave > Expanded
Time > Collapse Cursor
collapses simulation time at
the simulation time of the
active cursor
Zoom Toolbar
The Zoom toolbar allows you to change the view of the Wave window.
Figure 3-29. Zoom Toolbar
ModelSim SE GUI Reference Manual, v10.2c
79
Toolbars
Tabbed Toolbars
Table 3-27. Zoom Toolbar Buttons
Button
Name
Shortcuts
Description
Zoom In
Menu: Wave > Zoom >
Zoom In
Hotkey: i, I, or +
Zooms in by a factor of 2x.
Zoom Out
Menu: Wave > Zoom >
Zoom Out
Hotkey: o, O, or -
Zooms out by a factor of 2x.
Zoom Full
Menu: Wave > Zoom >
Zoom Full
Hotkey: f or F
Zooms to show the full length
of the simulation.
Zoom in
on Active
Cursor
Menu: Wave > Zoom >
Zoom Cursor
Hotkey: c or C
Zooms in by a factor of 2x,
centered on the active cursor.
Zoom
between
Cursors
Zooms in or out to show the
range between the last two
selected cursors.
Zoom Other
Window
Changes the view in additional
instances of the Wave window
to match the view of the active
Wave window.
Tabbed Toolbars
You can use an alternative GUI format when working with ModelSim Toolbars. Where the
default format is to display every active toolbar in multiple rows above the window portion of
the GUI, Tabbed Toolbars present a single row of buttons grouped into common tasks such as
editing, debugging, coverage, and so forth. The buttons are context driven and either operative
or greyed out depending on which window is currently active.
As the width of the GUI changes, the buttons on a toolbar may not be able to fit in the
space available. When this happens, an Overflow button appears on the right edge of the
Tabbed Toolbar. Clicking the Overflow icon opens an Overflow Menu Figure 3-30 which
displays the remaining buttons.
80
ModelSim SE GUI Reference Manual, v10.2c
Toolbars
Tabbed Toolbars
Figure 3-30. Tabbed Toolbars and Overflow Menu
You can turn on the Tabbed Toolbars GUI by setting the PrefToolbar(newEnabled)
preference variable to 1 and then restarting ModelSim.
Window Specific Buttons
Buttons that function only in a specific window are available in a bar at the top of the window.
To display the window specific buttons, click the Show/Hide Toolbar button in the window title
bar (Figure 3-31).
ModelSim SE GUI Reference Manual, v10.2c
81
Toolbars
Tabbed Toolbars
Figure 3-31. Window Specific Buttons
82
ModelSim SE GUI Reference Manual, v10.2c
Chapter 4
Window Reference
The following table summarizes all of the available windows.
Table 4-1. GUI Windows
Window
Description
ATV Window
displays a graphical, time-based view of your
SystemVerilog and PSL assertions
Assertions Window
manages SystemVerilog and PSL assertions
Call Stack Window
displays the current call stack, allowing you to debug
your design by analyzing the depth of function calls
Capacity Window
displays capacity data (memory usage) about
SystemVerilog constructs
Class Graph Window
displays interactive relationships of SystemVerilog
classes in graphical form
Class Instances Window
displays class instances
Class Tree Window
displays interactive relationships of SystemVerilog
classes in tabular form
Code Coverage Analysis
Window
displays missing code coverage, details, and code
coverage exclusions
Cover Directives Window
manages SystemVerilog and PSL cover directives
Covergroups Window
manages SystemVerilog covergroups
Coverage Details Window
contains details about coverage metrics based on
selections in other coverage windows
Dataflow Window
displays "physical" connectivity and lets you trace
events (causality)
Files Window
displays the source files and their locations for the
loaded simulation
FSM List Window
lists all recognized FSMs in the design
FSM Viewer Window
graphical representation of a recognized FSM
Instance Coverage Window
displays coverage statistics for each instance in a flat,
non-hierarchical view
Library Window
lists design libraries and compiled design units
ModelSim SE GUI Reference Manual, v10.2c
83
Window Reference
Table 4-1. GUI Windows (cont.)
84
Window
Description
List Window
shows waveform data in a tabular format
Locals Window
displays data objects that are immediately visible at the
current execution point of the selected process
Memory List Window
Memory Data Window
windows that show memories and their contents
Message Viewer Window
allows easy access, organization, and analysis of Note,
Warning, Errors or other messages written to transcript
during simulation
Objects Window
displays all declared data objects in the current scope
OVM-Aware Debug Windows
windows to assist in debugging OVM testbenches
Processes Window
displays all processes that are scheduled to run during
the current simulation cycle
Profiling Windows
windows that display performance and memory
profiling data
Projects
provides access to information about Projects
Schematic Window
displays information about the design in schematic
format
Source Window
a text editor for viewing and editing files, such as
Verilog, VHDL, SystemC, and DO files
Structure Window
Also known as the “sim”
window.
displays hierarchical view of active simulation. Name of
window is either “sim” or “<dataset_name>”
Transaction View Window
displays the details of Questa Verification IP transaction
instances. Not available for any other type of
transactions
Transcript Window
keeps a running history of commands and messages and
provides a command-line interface
Verification Management
Browser Window
displays information about UCDB tests for the purpose
of managing the verification process
Watch Window
displays signal or variable values at the current
simulation time
Wave Window
displays waveforms
ModelSim SE GUI Reference Manual, v10.2c
Window Reference
ModelSim SE GUI Reference Manual, v10.2c
85
Assertions Window
Use this window to view all embedded and external assertions that were successfully compiled
and simulated during the current session.
Window Reference
Accessing
•
•
Menu item: View > Coverage > Assertions
Command: view assertions
Figure 4-1. Assertions Window
Assertions Window Tasks
Refer to the section “Viewing Assertions in the Assertions Window” for more information.
GUI Elements of the Assertions Window
This section describes GUI elements specific to this Window.
Column Descriptions
Table 4-2. Assertions Window Columns
Column Title
Description
Active Count
The number of active assertion attempts at the current time.
Only enabled if the simulator is invoked with the
“-assertdebug” option or the .ini file variable
AutoExclusionsDisable is set to 1.
Assertion Expression
Displays the actual assertion expression.
ModelSim SE GUI Reference Manual, v10.2c
86
Window Reference
Assertions Window
Table 4-2. Assertions Window Columns (cont.)
Column Title
Description
Assertion Type
Indicates the assertion type: Immediate or Concurrent.
Attempt Count
The number of times the assertion has been attempted.
This is the number of assertion clocks for clocked assertions,
or the number of passes and fails for unclocked assertions.
This column is populated when you specify “-assertcover” or
“-assertdebug” for vsim, or if either the AssertionCover or
AssertionDebug .ini file variable is set to 1.
ATV
Indicates the status of assertion thread viewing: on or off.
Only enabled if the simulator is invoked with the
"-assertdebug" option or the .ini file variable AssertionDebug
is set to 1.
Cumulative Threads
The cumulative thread count for the assertion.
This count is designed to highlight those directives that are
starting too many attempts.
For example, given the assertion:
assert property ((@posedge clk) a |=> b);
If ‘a’ is true throughout the simulation, then the above
assertion will start a brand new attempt at every clock. An
attempt, once started, will only be alive until the next clock.
So this assertion will not appear abnormally high in the
Memory and Peak Memory columns, but it will have a high
count in the Cumulative Threads column.
Design Unit
Identifies the design unit to which the assertion is bound.
Design Unit Type
Identifies the HDL type of the design unit.
Disable Count
The number of assertion attempts that have been disabled due
to either an abort expression becoming true (PSL) or a
disable if expression becoming true (SVA).
This column is populated when you specify “-assertcover” or
“-assertdebug” for vsim, or if either the AssertionCover or
AssertionDebug .ini file variable is set to 1.
Enable
Identifies whether failure checking is active for the assertion.
EOS Note
Identifies when assertion directives are active at the end of
simulation (EOS): on or off.
Refer to the assertion active command.
If the assert directive is strong, the EOS Note column will
report both the "active at end of simulation" note along with a
strong error message.
ModelSim SE GUI Reference Manual, v10.2c
87
Window Reference
Assertions Window
Table 4-2. Assertions Window Columns (cont.)
88
Column Title
Description
Failure Count
Total number of times the assertion has failed in the current
simulation.
Failure Limit
The number of times the simulator will respond to a failure
event on an assertion.
Failure Log
enabled — failure messages will be logged to the transcript.
disabled — failure messages will not be logged to the
transcript.
Formal
Indicates formal analysis has been performed.
Data appears in this column only during post-process
analysis (Coverage View mode). Displayed values include:
• blank — no formal analysis has been performed
• assumption — indicates that property was used as an
assumption in the formal analysis
• conflict — indicates conflict when inconsistent data
merged in formal analysis
• failure — indicates formal analysis has determined that
property can fail
• inconclusive — indicates formal analysis has not proved
or falsified the property. See Proof Radius column for
amount of formal analysis performed.
• proof — indicates formal analysis has proven that
property cannot fail for all legal stimulus
• vacuous — indicates formal analysis has proven that the
antecedent of the property cannot be reached; property
needs to be examined closer
FPSA Actions
Displays a matrix of information relating the current action
for each possible state: Failure, Pass, Start, and Antecedent.
The field will always show four letters that indicate the
current action:
• C - Continue
• B - Break
• E - Exit
• S - Subroutine Call
where the order of the letters relates to the state:
• F - Failure
• P - Pass
• S - Start
• A - Antecedent
For example, if you see CCSB, you can derive the following:
• Failure state - Continue action
• Pass state - Continue action
• Start state - Subroutine Call action
• Antecedent state - Break action
ModelSim SE GUI Reference Manual, v10.2c
Window Reference
Assertions Window
Table 4-2. Assertions Window Columns (cont.)
Column Title
Description
Included
Indicates whether the Assertion is included in (check mark)
or excluded from (X mark) aggregate statistics and reports.
Language
Identifies the HDL used to write the assertion.
Memory
Tracks the current memory used by the assertion.
Name
Identifies the assert directive you specified in the assertion
code.
Pass Count
The total number of times the assertions has passed in the
current simulation. This column is populated when you
specify “-assertcover” or “-assertdebug” for vsim, or if either
the AssertionCover or AssertionDebug .ini file variable is set
to 1.
Pass Log
enabled — pass messages will be logged to the transcript.
disabled — pass messages will not be logged to the
transcript. Only enabled if the simulator is invoked with the
"-assertdebug" option or the .ini file variable AssertionDebug
is set to 1.
Peak Active Count
The peak simultaneously active thread count that has
occurred up to the current time.
Peak Active Count will also be shown in reports created with
the vcover report command.
Only enabled if the simulator is invoked with the
"-assertdebug" option or the .ini file variable AssertionDebug
is set to 1.
Peak Memory
The peak memory used by the assertion.
Peak Memory Time
Indicates the simulation run time at which the peak memory
usage occurred.
Proof Radius
Indicates that the property has been verified to a depth of x
number of cycles in the formal analysis.
Shown as positive integer.
Data appears in this column only during post-process
analysis (Coverage View mode).
Vacuous Count
The number of assertion attempts that have succeeded
vacuously, that is, if the left hand side of an implication is
false on a clock edge.
This column is populated when you specify “-assertcover” or
“-assertdebug” for vsim, or if either the AssertionCover or
AssertionDebug .ini file variable is set to 1.
ModelSim SE GUI Reference Manual, v10.2c
89
Window Reference
Assertions Window
Popup Menu
Right-click in the window to display the popup menu and select one of the following options:
Table 4-3. Assertions Window Popup Menu
90
Popup Menu Item
Description
Add
Add information about the selected assertions to the
specified window.
View Source
Opens a source file for the selected assertion.
Enable ATV
Enables an assertion for use with the ATV Window.
View ATV
Opens an ATV window for the selected assertion.
Report
Generates a report about the selected assertion.
Configure
Allows you to configure the simulators behavior for
the selected assertion.
Enable
Enables checking of the assertion for failures during
the simulation
Failure Log
Logs failure messages (PSL only) to the transcript.
Pass Log
Logs pass messages (PSL only) to the transcript.
Only enabled if the simulator is invoked with the
"-assertdebug" option or the .ini file variable
AssertionDebug is set to 1.
... Action
Allows you to take specified actions when the
selected assertions meet certain conditions.
Test Analysis
When a UCDB file is selected, allows you to Find
Tests with: Least Coverage, Most Coverage, Zero
Coverage, or Non-Zero Coverage; Rank Most
Effective Tests; produce a Summary report.
XML Import Hint
Displays the XML Import Hint dialog box with
information about the Link Type and Name.
Filter
Setup — Opens Filter Setup dialog
Apply — Applies filter to selected item(s)
Expand
Expand or collapse the hierarchy.
Display Options
Allows you to control the appearance of information
in the window.
Exclude Selected
Excludes selected item(s) from coverage statistics
collection and reports
Clear Exclusion
Clears coverage exclusion for selected item(s)
ModelSim SE GUI Reference Manual, v10.2c
ATV Window
Use this window to view the progress of assertion threads (PSL and SystemVerilog assertions)
over time.
Window Reference
Accessing
Access the window using either of the following:
•
Menu item: Assertions > Add ATV, when selecting an assertion in the Assertions
Window.
•
Command: add atv
Refer to the section “Viewing Assertion Threads in the ATV Window” for detailed instructions.
ModelSim SE GUI Reference Manual, v10.2c
91
Window Reference
ATV Window
Figure 4-2. ATV Window
ATV Window Tasks
Refer to the section “Actions in the ATV Window” for more information.
GUI Elements of the ATV Window
This section describes GUI elements specific to this window.
Pane Descriptions
The ATV window contains four panes:
92
ModelSim SE GUI Reference Manual, v10.2c
Window Reference
ATV Window
•
•
Expression Pane — shows a hierarchical representation of the assertion.
•
•
Local Variables Pane — shows any values related to local variables in the assertion.
Thread Viewer Pane — shows the progress of the assertion threads over time for a given
thread instance and starting time.
Design Objects Pane — shows values of the design objects in the expression at that
time.
ATV Window Graphic Symbols
The symbols in Table 4-4 indicate the current state of the assert or cover directive.
Table 4-4. Graphic Symbols for Current Directive State
Graphic Symbol
Status Information
State: Start
State: Active
State: Antecedent
State: Passed
State: Failed
Table 4-5 shows the status information that is displayed when you hover the mouse over
graphic symbols used to indicate clock, thread, and directive status.
Table 4-5. Graphic Symbols for Clock, Thread, and Directive Status
Graphic Symbol
Status Information
Directive Passed
Directive Failed
Root thread started/completed
New evaluation thread forked
Boolean passed
Boolean failed
clock time & clock name
Local variable and value
Thread failed but is redundant since other
threads are still running
ModelSim SE GUI Reference Manual, v10.2c
93
Window Reference
ATV Window
Table 4-5. Graphic Symbols for Clock, Thread, and Directive Status (cont.)
Graphic Symbol
Status Information
Thread killed because directive was
aborted or disabled
Thread killed because other thread
caused unilateral pass/fail
Thread passed but directive waiting on
other running threads
Popup Menu
Right-click in the window to display the popup menu and select one of the following options:
Table 4-6. ATV WIndow Popup Menu
Popup Menu Item
Description
View Source
Open the source file and highlight the assertion.
View Grid
Toggles the appearance of grid lines
Ascending Expressions
Toggles the display of the assertion into ascending or
descending mode.
Annotate Local Vars
Displays local variable information in the Thread
Viewer pane.
Show Local Vars
Toggles the display of the Local Variables pane
Show Design Objects
Toggles the display of the Design Objects pane
View Full Object Names
Toggles the display of the object names in the
Design Objects pane
Add ...
Adds the assertion to the selected window
Zoom ...1
Controls the zoom level of the Thread Viewer pane
1. These menu items are only available when right-clicking on the right-hand side of the
window
94
ModelSim SE GUI Reference Manual, v10.2c
Call Stack Window
The Call Stack window displays the current call stack when:
•
•
•
Window Reference
you single step the simulation.
the simulation has encountered a breakpoint.
you select any process in either the Structure or Processes windows.
When debugging your design you can use the call stack data to analyze the depth of function
calls that led up to the current point of the simulation, which include:
•
•
•
•
Verilog functions and tasks
VHDL functions and procedures
SystemC methods and threads
C/C++ functions
The Call Stack window also supports C Debug mode.
Accessing
Access the window using the following menu item:
•
View > Call Stack
Figure 4-3. Call Stack Window
Call Stack Window Tasks
This window allows you to perform the following actions:
•
Double-click on the line of any function call:
o
Displays the local variables at that level in the Locals Window.
o
Displays the corresponding source code in the Source Window.
ModelSim SE GUI Reference Manual, v10.2c
95
Window Reference
Call Stack Window
Related Commands of the Call Stack Window
Table 4-7. Commands Related to the Call Stack Window
Command Name
Description
stack down
this command moves down the call stack.
stack frame
this command selects the specified call frame.
stack level
this command reports the current call frame number.
stack tb
this command is an alias for the tb command.
stack up
this command moves up the call stack.
GUI Elements of the Call Stack Window
This section describes GUI elements specific to this Window.
Column Descriptions
Table 4-8. Call Stack Window Columns
96
Column Title
Description
#
indicates the depth of the function call, with the most recent
at the top.
In
indicates the function. If you see “unknown” in this column,
you have most likely optimized the design such that the
information is not available during the simulation.
Line
indicates the line number containing the function call.
File
indicates the location of the file containing the function call.
Address
indicates the address of the execution in a foreign
subprogram, such as C.
ModelSim SE GUI Reference Manual, v10.2c
Capacity Window
Use this window to display memory capacity data about your simulation. Refer to the section
“Capacity Analysis” for more information.
Window Reference
Accessing
Access the window using either of the following:
•
•
Menu item: View > Capacity
Command: view capacity
Figure 4-4. Capacity Window
GUI Elements of the Capacity Window
This section describes GUI elements specific to this Window.
Column Descriptions
Table 4-9. Capacity Window Columns
Column Title
Description
Type/Object
Refer to the section “Type/Object Listing”
ModelSim SE GUI Reference Manual, v10.2c
97
Window Reference
Capacity Window
Table 4-9. Capacity Window Columns (cont.)
Column Title
Description
Count
Quantity of design objects analyzed
Current Memory
Current amount of memory allocated, in bytes
Peak Memory
Peak amount of memory allocated, in bytes
Peak Time
The time, in ns, at which the peak memory was reached
Type/Object Listing
When your design contains Verilog design units you will see the following entries in the
Type/Object column
98
•
•
•
Always
•
•
Blocks
•
•
•
•
•
•
•
•
•
Continuous assignment
•
•
•
•
Registers
Always blocks
Assertions — When using fine-grained analysis (vsim -capacity) this entry expands and
provides information for each assertion.
Classes — When using fine-grained analysis (vsim -capacity) this entry expands and
provides information for each class.
Covergroups
Function instances
Initial
Initial blocks
Module instances
Nets
Parameters
QDAs — When using fine-grained analysis (vsim -capacity) this entry expands and
provides information for Queues, Dynamic Arrays, and Associative Arrays.
Solver
System task instances
Task instances
ModelSim SE GUI Reference Manual, v10.2c
Window Reference
Capacity Window
•
•
Verilog Memories
Verilog Ports
When your design contains VHDL design units you will see the following entries in the
Type/Object column
•
•
•
•
Instances
Ports
Signals
Processes
ModelSim SE GUI Reference Manual, v10.2c
99
Class Graph Window
The Class Graph window provides a graphical view of your SystemVerilog classes, including
any extensions of other classes and related methods and properties.
Window Reference
Accessing
•
•
Menu item: View > Class Browser > Class Graph
Command: view classgraph
Figure 4-5. Class Graph Window
Class Graph Window Tasks
This section describes tasks for using the Cover Directives window.
ModelSim SE GUI Reference Manual, v10.2c
100
Window Reference
Class Graph Window
Navigating in the Class Graph Window
You can change the view of the Class Graph window with your mouse or the arrow keys on
your keyboard.
•
•
•
•
Left click-drag — allows you to move the contents around in the window.
Middle Mouse scroll — zooms in and out.
Middle mouse button strokes:
o
Upper left — zoom full
o
Upper right — zoom out. The length of the stroke changes the zoom factor.
o
Lower right — zoom area.
Arrow Keys — scrolls the window in the specified direction.
o
Unmodified — scrolls by a small amount.
o
Ctrl+<arrow key> — scrolls by a larger amount
o
Shift+<arrow key> — shifts the view to the edge of the display
GUI Elements of the Class Graph Window
This section describes the GUI elements specific to the Class Graph window.
Popup Menu Items
Table 4-10. Class Graph Window Popup Menu
Popup Menu Item
Description
Filter
Controls the display of methods and properties from
the class boxes.
Zoom Full
View Entire Design
Reloads the view to show the class hierarchy of the
complete design.
Print to Postscript
Organize by Base/Extended Class
ModelSim SE GUI Reference Manual, v10.2c
reorganizes the window so that the base or extended
(default) classes are at the top of the hierarchy.
101
Class Instances Window
The Class Instances window shows the list of class instances and their values for a particular
selected class type. You may add the class items directly to the wave or list windows, log them,
or get other information about them.
Window Reference
Accessing
•
•
Menu item: View > Class Browser > Class Instances
Command: view classinstances
Figure 4-6. Class Instances Window
ModelSim SE GUI Reference Manual, v10.2c
102
Window Reference
Class Instances Window
Viewing Class Instances
The Class Instances window is dynamically populated by selecting SVClasses in the Structure
(sim) window. All currently active instances of the selected class are displayed in the Class
Instances window. Class instances that have not yet come into existence or have been destroyed
are not displayed.
Once you have chosen the class type you want to observe, you can fix that instance in the
window while you debug by selecting File > Environment > Fix to Current Context.
Class Naming Format
Class instance names are formatted as follows: @<class_type>@<nnn> where
@<class_type>@ is the name of the class type and <n> is the reference identifier for a
particular instance of the class type. For example, @uvm_queue_3@14 is the 14th instance of
the class uvm_queue_3.
GUI Elements of the Class Instances Window
This section describes the GUI elements specific to the Class Instances window.
Popup Menu Items
Table 4-11. Class Instances Window Popup Menu
Popup Menu Item
Description
View Declaration
Highlights the line of code where the type of the
instance is declared, opening the source file if
necessary.
Add Wave
Adds the selected class instance to the Wave window.
Add to
Allows you to log the selected class instance, or add it
to the Wave or List windows.
ModelSim SE GUI Reference Manual, v10.2c
103
Class Tree Window
The Class Tree window provides a hierarchical view of your SystemVerilog classes, including
any extensions of other classes, related methods and properties, as well as any covergroups.
Window Reference
Figure 4-7. Class Tree Window
Accessing
•
•
Select View > Class Browser > Class Tree
Use the command: view classtree
GUI Elements of the Class Tree Window
This section describes the GUI elements specific to the Class Tree window.
Icons
Table 4-12. Class Tree Window Icons
Icon
Description
Class
Parameterized Class
Function
Task
ModelSim SE GUI Reference Manual, v10.2c
104
Window Reference
Class Tree Window
Table 4-12. Class Tree Window Icons (cont.)
Icon
Description
Variable
Virtual Interface
Covergroup
Structure
Column Descriptions
Table 4-13. Class Tree Window Columns
Column
Description
Class
The name of the item
Type
The type of item
File
The source location of the item
Unique Id
The internal name of the parameterized class
(only available with parameterized classes)
Scope
The scope of the covergroup
(only available with covergroups
Popup Menu Items
Table 4-14. Class Tree Window Popup Menu
Popup Menu Item
Description
View Declaration
Highlights the line of code where the item is declared,
opening the source file if necessary.
View as Graph
Displays the class and any dependent classes in the
Class Graph window.
(only available for classes)
Filter
allows you to filter out methods and or properties
Organize by Base/Extended Class
reorganizes the window so that the base or extended
(default) classes are at the top of the hierarchy.
ModelSim SE GUI Reference Manual, v10.2c
105
Code Coverage Analysis Window
Use this window to view covered (executed), uncovered (missed), and/or excluded statements,
branches, conditions, expressions, FSM states and transitions, as well as signals that have and
have not toggled.
Window Reference
The Code Coverage Analysis window replaces all functionality previously found in the Missing
<coverage type> and Current Exclusions windows.
Prerequisites
This window is specific to the collection of coverage metrics, therefore you must have run your
simulation with coverage collection enabled. Refer to the “Code Coverage” chapter for more
information.
Accessing
Access the window using either of the following:
•
Menu item: View > Coverage > Code Coverage Analysis
Then, select the desired analysis type from the Code Coverage Analysis window’s title
bar, detailed in Table 4-15.
•
Command: view canalysis
Figure 4-8. Code Coverage Analysis
GUI Elements of the Code Coverage Analysis Window
This section describes the GUI elements specific to the Code Coverage Analysis window.
Primary of these are found in the title bar.
ModelSim SE GUI Reference Manual, v10.2c
106
Window Reference
Code Coverage Analysis Window
Table 4-15. Contents of Code Coverage Analysis Title Bar
Selection/Button
Action
Analysis Type button: Specifies the type of coverage
analysis currently selected in the sub-window inside the
Code Coverage Analysis window. Six selections are
available when you click on the type, as shown in the
image to the left.
Covered items button: When selected (default, as shown in
image), all covered (hit) items are displayed in the window.
When not selected, all items are filtered from view.
Missed items button: When selected (default), all missed
items (not executed) are displayed in the window. When
not selected, all missed items are filtered from view.
Excluded items button: When selected (default), all
excluded items are displayed in window. When not
selected, excluded items are filtered from view.
By default, the buttons listed in Table 4-15 are selected (active).
ModelSim SE GUI Reference Manual, v10.2c
107
Window Reference
Code Coverage Analysis Window
Popup Menu Items
Table 4-16. Code Coverage Analysis Window Popup Menu
Popup Menu Item
Description
Exclude Selection
excludes the selected lines of code
Exclude with Comment...
excludes selected lines of code with a comment.
Edit Comment...
allows you to edit the comment
Test Analysis
Executes coverage analyze on the selected item(s) and
prints information to a Test Analysis window.
• Find Least Coverage
• Find Most Coverage
• Find Zero Coverage
• Find Non Zero Coverage
• Summary
Copy
copies selected item(s) to clipboard
Expand All
expands all items displayed in window
Collapse All
collapses all items displayed in window
Viewing Code Coverage Data and Current Exclusions
To view executed or missed statements, branches, conditions, expressions, or FSMs, as well as
items excluded from coverage, do the following:
1. Select a file in the Files window, or an instance or design unit in the Structure window
whose coverage you wish to analyze.
2. With the Code Coverage Analysis window active. select the type of coverage to view
(Branch Analysis, Condition analysis, etc.) from the pulldown menu in the Analysis
toolbar (Figure 4-8).
108
ModelSim SE GUI Reference Manual, v10.2c
Window Reference
Code Coverage Analysis Window
Figure 4-9. Missed Coverage in Code Coverage Analysis Windows
Each coverage type window includes a column for the line number and a column for statement,
branch, condition, expression, or toggle on that line. An icon indicates whether the object was
executed (green check mark), not executed (red X), or excluded (green E). See Table 4-53 for a
complete list of icons.
In the banner for all Coverage Analysis window types, the following information appears:
•
•
name of the window
•
•
scope of the coverage item (in parentheses) being displayed
whether the coverage is by file or by instance (depending on whether a file was selected
in the Files tab or an instance or du from the sim tab)
Analysis Type button, Covered Items button, Missed Coverage buttons, Excluded Items
button (see Table 4-15)
You can change the scope displayed (for all Code Coverage Analysis windows) by selecting a
new scope in the Structure or Files windows.
When you select (left-click) any item in the Statement, Branch, Condition, Expression, FSM or
Toggle Analysis windows, the Coverage Details Window populates with related details
ModelSim SE GUI Reference Manual, v10.2c
109
Window Reference
Code Coverage Analysis Window
(coverage statistic details, truth tables, exclusions and so on) about that object. In the case of a
multi-line statement, branch, condition or expression, select the object on the last line of the
item.
The Branch Analysis window includes a column for branch code (conditional "if/then/else" and
"case" statements). "XT" indicates that the true condition of the branch was not executed. "XF"
indicates that the false condition of the branch was not executed. Fractional numbers indicate
how many case statement labels were executed.
When you right-click any item in the window, a pop-up menu appears with options to control
the addition or removal of coverage exclusions. The options and their function is identical to
that of the Source Window. See “Methods for Excluding Objects” for a description of adding
comments with exclusions.
Note
Multi-line objects are rooted in the last line, and exclusions must be applied on that line #
in order to take effect.
See “Coverage Details Window” for a description of the type of detailed information viewed in
the Details window for each coverage type.
110
ModelSim SE GUI Reference Manual, v10.2c
Cover Directives Window
The Cover Directives window displays a list of SystemVerilog and PSL, embedded and
external, cover directives that were successfully compiled and simulated during the current
simulation.
Window Reference
Accessing
Access the window using either of the following:
•
•
Menu item: View > Coverage > Cover Directives
Command: view coverdirectives
Figure 4-10. Cover Directives Window
GUI Elements of the Cover Directives Window
Column Descriptions
Table 4-17. Cover Directives Window Columns
Column
Description
AtLeast
number of times a directive has to fire to be considered
100% covered.
Cmplt %
coverage percentage for a directive.
The percentage is the lesser of 100% or Count divided by
AtLeast.
ModelSim SE GUI Reference Manual, v10.2c
111
Window Reference
Cover Directives Window
Table 4-17. Cover Directives Window Columns (cont.)
Column
Description
Cmplt graph
graphical bar chart of the completion percentage.
Directives with 100% coverage are displayed in green.
Count
number of times a directive has "fired" during the current
simulation.
Design Unit
design unit to which the directive is bound.
Design Unit Type
HDL type of the design unit. Not displayed by default.
Enabled
displays a green checkmark when a directive is enabled or a
red X when a directive is disabled.
Included
indicates whether the directive is included in aggregate
statistics and reports.
Language
identifies the HDL used to write the assertion.
Limit
number of times the directive will execute before being
disabled by the simulator. Default is Unlimited.
Log
indicates whether data for the directive is currently being
added to the functional coverage database.
Memory
tracks the current memory used by the cover directive.
Name
lists directive names and design units. Also, any signals
referenced in a directive are included in the hierarchy. Refer
to the section “Using Assert Directive Names” for more
information.
Peak Memory
tracks the peak memory used by the cover directive.
Peak Memory Time
indicates the simulation run time at which the peak memory
usage occurred.
Type
shows the cover directive type (Immediate or Concurrent).
Not displayed by default.
Weight
shows the weighting factor that has been applied to the
directive.
Cover Directives Window Tasks
This section describes tasks for using the Cover Directives window.
Changing the Cover Directives Window Display Options
You can set the window to display cover directives in a Recursive Mode or in a Show All
Contexts mode.
112
ModelSim SE GUI Reference Manual, v10.2c
Window Reference
Cover Directives Window
•
The Recursive Mode — displays all cover directives at and below the selected
hierarchy instance, the selection being taken from a Structure window. (that is, the sim
tab). Otherwise only items actually in that particular scope are shown.
•
The Show All Contexts — selection displays all instances in the design. It does not
following the current context selection in a structure pane. The Show All Context
display mode implies the recursive display mode as well, so the Recursive Mode
selection is automatically grayed out.
You can choose between these two display modes by right-clicking in the Cover Directives
window and selecting the option from the Display Options sub-menu.
ModelSim SE GUI Reference Manual, v10.2c
113
Coverage Details Window
Use this window to view detailed results about coverage metrics from your simulation.
Window Reference
Prerequisites
This window is specific to the collection of coverage metrics, therefore you must have run your
simulation with coverage collection enabled. Refer to the chapter “Code Coverage” for more
information.
Accessing
Access the window using either of the following:
•
•
Menu item: View > Coverage > Details
Command: view details
You can populate this window by selecting an item in one of the panes of the Code Coverage
Analysis Window: either Statement, Branch, Expression, Condition, FSM or Toggle.
Coverage Details of Statement Coverage
The Coverage Details window displays the following information about Statement Coverage
metrics:
•
Instance — the dataset name followed by the hierarchical location of the statement.
Only appears when you are analyzing coverage metrics by instance.
•
•
File — the name of the file containing the statement.
•
•
Statement Coverage for — name of the statement itself.
Line — the line number of the statement. In the case of a multi-line statement, this is the
last line of the statement.
Hits — the number of times the statement was hit during the simulation.
If a line number contains multiple statements, the coverage details window contains the metrics
for each statement.
Coverage Details of Branch Coverage
The Coverage Details window displays the following information about Branch Coverage
metrics:
•
Instance — the dataset name followed by the hierarchical location of the branch. Only
appears when you are analyzing coverage metrics by instance.
•
File — the name of the file containing the statement.
ModelSim SE GUI Reference Manual, v10.2c
114
Window Reference
Coverage Details Window
•
Line — the line number of the statement. In the case of a multi-line branch statement,
this is the last line of the statement.
•
Branch Coverage for — the statement itself.
o
Active — the number of times the branch has been executed.
o
True Hits — the number of times the branch resolved to True.
Coverage Details of Condition and Expression Coverage
The Coverage Details window displays the following information about Condition and
Expression Coverage metrics:
•
Instance — the dataset name followed by the hierarchical location of the condition. Only
appears when you are analyzing coverage metrics by instance.
•
•
File — the filename containing the condition.
•
•
Condition/Expression Coverage for — the syntax of the condition.
•
UDP Coverage — not included in the Details window, unless -coverudp was specified
with vcom/vlog/vopt.
Line — the line number of the filename containing the condition or expression. In the
case of a multi-line condition statement, this is the last line of the statement.
FEC Coverage — a tabular representation of the focused expression coverage metrics to
satisfy the condition. Refer to the section “FEC Coverage Detailed Examples” for more
information about FEC condition/expression coverage. You can exclude rows or rows
by instance through a popup menu accessible by right-clicking on a row in the table (see
Figure 4-11).
Refer to the section “UDP Coverage Details and Examples” for more information about
UDP condition/expression coverage.
ModelSim SE GUI Reference Manual, v10.2c
115
Window Reference
Coverage Details Window
Figure 4-11. Coverage Details Window Showing Expression Truth Table
Coverage Details of Toggle Coverage
The Coverage Details window displays the following information about Toggle Coverage
metrics:
•
Instance — the dataset name followed by the hierarchical location of the signal. Only
appears when you are analyzing coverage metrics by instance.
•
•
•
Signal — the name of the signal (data[6]) or (data).
•
•
•
•
116
Node Count — The size of the signal.
Toggle List — the list of toggles analyzed during simulation. This list will differ
depending on whether you specified extended toggle coverage. Refer to the section
“Standard and Extended Toggle Coverage” for more information.
o
Toggle coverage shows toggle metrics between 0 and 1
o
Extended toggle coverage shows toggle metrics between 0, 1 and Z.
Toggle Coverage — The percentage of nodes that were covered.
0/1 Coverage — The percentage of standard toggles that were covered.
Full Coverage — The percentage of extended toggles that were covered.
Z Coverage — The percentage of toggles involving Z that were covered.
ModelSim SE GUI Reference Manual, v10.2c
Window Reference
Coverage Details Window
Toggle details are displayed as follows:
Figure 4-12. Coverage Details Window Showing Toggle Details
Coverage Details of FSM Coverage
The Coverage Details window displays the following information about Finite State Machine
Coverage metrics:
•
•
Finite State Machine — the name of the finite state machine
•
•
•
•
State Coverage — a list of all the states, followed by the number of hits.
Instance — the dataset name followed by the hierarchical location of the FSM. Only
appears when you are analyzing coverage metrics by instance.
Transition Coverage — a list of all the transitions, followed by the number hits.
State Coverage — the coverage percentage for the states.
Transition Coverage — the coverage percentage for the transitions.
FSM details are displayed as shown in Figure 4-13:
ModelSim SE GUI Reference Manual, v10.2c
117
Window Reference
Coverage Details Window
Figure 4-13. Coverage Details Window Showing FSM Details
118
ModelSim SE GUI Reference Manual, v10.2c
Covergroups Window
The Covergroups window displays SystemVerilog covergroups, coverpoints, crosses and bins
in the current region (which is selected via the Structure window). Refer to the section
“Viewing Functional Coverage Statistics in the GUI” for more information.
Window Reference
Accessing
Access the window using either of the following:
•
•
Menu item: View > Coverage > Covergroups
Command: view covergroups
Figure 4-14. Covergroups Window
ModelSim SE GUI Reference Manual, v10.2c
119
Window Reference
Covergroups Window
GUI Elements of the Covergroups Window
Column Descriptions
Table 4-18. Covergroups Window Columns
120
Column
Description
Auto_bin_max
the maximum number of automatically created bins when
no bins are explicitly defined for coverpoints.
Class Type
lists the parameterized class type name of the
corresponding classes in the window.
Comment
displays comments that appear with the instance of a
covergroup, or a coverpoint or cross of the covergroup
instance.
Coverage
weighted average of the coverage of the constituent
coverpoints and crosses.
Covered Bins
lists the # of covered bins (hits) for covergroup,
coverpoint, cross, and covergroup instance objects.
Cover Testname
In post processing mode (Coverage View) it displays the
name of the test which covered the bin. During live
simulation, the ‘<current_test>’ is displayed.
Cover Time
displays the time when the bin was covered.
Cross_num_print_missing
the number of missing (not covered) cross product bins
that must be saved to the coverage database and printed in
the coverage report.
Detect_overlap
shows when a warning has been issued for an overlap
between the range list (or transition list) of two bins of a
coverpoint.
Get_inst_coverage
the value of the get_inst_coverage covergroup option.
• When true, it enables the tracking of per instance
coverage with the get_inst_coverage built-in method.
• When false, the value returned by get_inst_coverage
shall equal the value returned by get_coverage.
Goal
the desired coverage total as an integer percent.
% Hit
the percentage of the total covergroup bins which have
been hit (Total Hits divided by Covered Bins)
Included
indicates whether the Covergroup is included in (check
mark) or excluded from (X mark) aggregate statistics and
reports.
% of Goal
the percentage of the coverage goal that has been reached.
ModelSim SE GUI Reference Manual, v10.2c
Window Reference
Covergroups Window
Table 4-18. Covergroups Window Columns (cont.)
Column
Description
% over Goal
the percentage over the coverage goal that has been
reached
Merge_instances
the value of the merge_instances covergroup type option.
• When true, cumulative (or type) coverage is computed
by merging instances together as the union of
coverage of all instances.
• When false, type coverage is computed as the
weighted average of instances.
• When "auto(1)" or "auto(0)" is displayed, this
indicates a default value chosen by tool with the
effective value inside the parenthesis.
Missing Bins
the number of covergroup bins missing coverage
Name
the name of the covergroup and its components.
Peak Transient Memory
the peak transient memory used by the covergroup.
Peak Transient Memory Time the simulation run time at which the peak transient
memory usage occurred.
Persistent Memory
the persistent memory used by the covergroup.
Samples
the sample count of covergroups TYPEs and covergroup
instances.
Status
graphical representation of the Coverage column.
Strobe
the value of the strobe coverage group type option. If set
to 1, all samples happen at the end of the time slot, like the
$strobe system task.
Total Bins
displays the total # of bins for covergroup, coverpoint,
cross, and covergroup instance objects, not including
illegal, ignore, or default bins.
Transient Memory
the transient memory used by the covergroup.
Weight
the weighting of a covergroup instance for computing the
overall instance coverage simulation. For coverpoints or
crosses, it shows the weighting of a coverpoint or cross
for computing the instance coverage of the enclosing
covergroup.
Weighted Missing Bins
the number of weighted bins missing coverage.
ModelSim SE GUI Reference Manual, v10.2c
121
Window Reference
Covergroups Window
Popup Menu Items
Table 4-19. Covergroup Window Popup Menu
Popup Menu Item
Description
View Source
Opens the selected file in a Source window
Report
Creates a functional coverage report (in text or XML)
of selected items
Hide Covergroup Instances
Hides from the display:
• All covergroup instances
• only covergroups with per_instance set to 0
Use CrossPrintMissing
Uses the value of option.cross_num_print_missing
while displaying bins of covergroup cross scope
Show Zero Weight Objects
Displays all objects with zero weighting
Test Analysis
Executes coverage analyze on the selected instance
and prints information to the Test Analysis window.
• Find Least Coverage
• Find Most Coverage
• Find Zero Coverage
• Find Non Zero Coverage
• Summary
XML Import Hint
Displays the XML Import Hint dialog box containing
information about the Link Type and Link Name
Filter
Setup — Opens the Filter Setup dialog
Apply — Applies filter to selected item(s)
Display Options
Displays covergroups recursively, or in all contexts
Exclude Selected
Excludes selected item(s) from coverage statistics
collection and reports
Clear Exclusion
Clears coverage exclusion for selected item(s)
Covergroups Window Tasks
This section describes tasks for using the Covergroups window.
Changing the Covergroups Window Display Options
Note
Covergroups are created dynamically during simulation. This means they will not display
in the GUI until you run the simulation.
122
ModelSim SE GUI Reference Manual, v10.2c
Window Reference
Covergroups Window
You can set the window to display covergroups in a Recursive Mode or in a Show All
Contexts mode.
•
The Recursive Mode — displays all covergroups at and below the selected hierarchy
instance, the selection being taken from a Structure window. (that is, the sim tab).
Otherwise only items actually in that particular scope are shown.
•
The Show All Contexts — selection displays all instances in the design. It does not
follow the current context selection in the Structure window. The Show All Context
display mode implies the recursive display mode as well, so the Recursive Mode
selection is automatically grayed out.
You can choose between these two display modes by right-clicking in the Covergroups window
and selecting the option from the Display Options sub-menu.
ModelSim SE GUI Reference Manual, v10.2c
123
Dataflow Window
Use this window to explore the "physical" connectivity of your design. You can also use it to
trace events that propagate through the design; and to identify the cause of unexpected outputs.
Window Reference
The Dataflow window displays:
•
•
•
processes
signals, nets, and registers
interconnects
The window has built-in mappings for all Verilog primitive gates (that is, AND, OR, PMOS,
NMOS, and so forth.). For components other than Verilog primitives, you can define a mapping
between processes and built-in symbols. See Symbol Mapping for details.
Note
You cannot view SystemC objects in the Dataflow window.
Accessing
Access the window using either of the following:
•
•
Menu item: View > Dataflow
Command: view dataflow
ModelSim SE GUI Reference Manual, v10.2c
124
Window Reference
Dataflow Window
Figure 4-15. Dataflow Window
Dataflow Window Tasks
This section describes tasks for using the Dataflow window.
You can interact with the Dataflow in one of three different Mouse modes, which you can
change through the DataFlow menu or the Zoom Toolbar:
•
Select Mode — your left mouse button is used for selecting objects and your middle
mouse button is used for zooming the window. This is the default mode.
•
Zoom Mode — your left mouse button is used for zooming the window and your
middle mouse button is used for panning the window.
•
Pan Mode — your left mouse button is used for panning the window and your middle
mouse button is used for zooming the window.
Selecting Objects in the Dataflow Window
When you select an object, or objects, it will be highlighted an orange color.
•
•
Select a single object — Single click.
Select multiple objects — Shift-click on all objects you want to select or click and drag
around all objects in a defined area. Only available in Select Mode.
ModelSim SE GUI Reference Manual, v10.2c
125
Window Reference
Dataflow Window
Zooming the View of the Dataflow Window
Several zoom controls are available for changing the view of the Dataflow window, including
mouse strokes, toolbar icons and a mouse scroll wheel.
•
•
•
•
Zoom Full — Fills the Dataflow window with all visible data.
o
Mouse stroke — Up/Left. Middle mouse button in Select and Pan mode, Left mouse
button in Zoom mode.
o
Menu — DataFlow > Zoom Full
o
Zoom Toolbar — Zoom Full
Zoom Out
o
Mouse stroke — Up/Right. Middle mouse button in Select and Pan mode, Left
mouse button in Zoom mode.
o
Menu — DataFlow > Zoom Out
o
Zoom Toolbar — Zoom Out
o
Mouse Scroll — Push forward on the scroll wheel.
Zoom In
o
Menu — DataFlow > Zoom In
o
Zoom Toolbar — Zoom In
o
Mouse Scroll — Pull back on the scroll wheel.
Zoom Area — Fills the Dataflow window with the data within the bounding box.
o
•
Mouse stroke — Down/Right
Zoom Selected — Fills the Dataflow window so that all selected objects are visible.
o
Mouse stroke — Down/Left
Panning the View of the Dataflow Window
You can pan the view of the Dataflow window with the mouse or keyboard.
126
•
Pan with the Mouse — In Zoom mode, pan with the middle mouse button. In Pan mode,
pan with the left mouse button. In Select mode, pan with the Ctrl key and the middle
mouse button.
•
Pan with the Keyboard — Use the arrow keys to pan the view. Shift+<arrow key> pans
to the far edge of the view. Ctrl+<arrow key> pans by a moderate amount.
ModelSim SE GUI Reference Manual, v10.2c
Window Reference
Dataflow Window
Displaying the Wave Viewer Pane
You can embed a miniature wave viewer in the Dataflow window (Figure 4-16.
1. Select the DataFlow > Show Wave menu item.
2. Select a process in the Dataflow pane to populate the Wave pane with signal
information.
Refer to the section “Exploring Designs with the Embedded Wave Viewer” for more
information.
Figure 4-16. Dataflow Window and Panes
ModelSim SE GUI Reference Manual, v10.2c
127
Window Reference
Dataflow Window
128
ModelSim SE GUI Reference Manual, v10.2c
Files Window
Use this window to display the source files and their locations for the loaded simulation.
Window Reference
Prerequisites
You must have executed the vsim command before this window will contain any information
about your simulation environment.
Accessing
Access the window using either of the following:
•
•
Menu item: View > Files
Command: view files
Figure 4-17. Files Window
GUI Elements of the Files Window
This section describes GUI elements specific to this Window.
ModelSim SE GUI Reference Manual, v10.2c
129
Window Reference
Files Window
Column Descriptions
Table 4-20. Files Window Columns
Column Title
Description
Name
The name of the file
Specified Path
The location of the file as specified in the
design files.
Full Path
The full-path location of the design files.
Type
The file type.
Branch info
A series of columns reporting branch
coverage
Condition info
A series of columns reporting condition
coverage
Expression info
A series of columns reporting expression
coverage
FEC condition info
A series of columns reporting condition
coverage based on Focused Expression
Coverage
FEC expression info
A series of columns reporting expression
coverage based on Focused Expression
Coverage
States info
A series of columns reporting finite state
machine coverage
Statement info
A series of columns reporting statement
coverage
Toggles info
A series of columns reporting toggle
coverage
Transition info
A series of columns reporting transition
coverage
Refer to Table 4-55 “Columns in the Structure Window” for detailed information about the
coverage metric columns.
130
ModelSim SE GUI Reference Manual, v10.2c
Window Reference
Files Window
Popup Menu
Right-click anywhere in the window to display the popup menu and select one of the following
options:
Table 4-21. Files Window Popup Menu
Menu Item
Description
View Source
Opens the selected file in a Source window
Open in external editor
Opens the selected file in an external editor.
Only available if you have set the Editor preference:
• set PrefMain(Editor) {<path_to_executable>}
• Tools > Edit Preferences; by Name tab, Main group.
Code Coverage >
These menu items are only available if you ran the
simulation with the -coverage switch.
• Code Coverage Reports — Opens the Coverage Text
Report dialog box, allowing you to create a coverage
report for the selected file.
• Exclude Selected File — Executes the coverage
exclude command for the selected file(s).
• Clear Code Coverage Data — Clears all code coverage
information collected during simulation
Properties
Displays the File Properties dialog box, containing
information about the selected file.
Files Menu
This menu becomes available in the Main menu when the Files window is active.
Table 4-22. Files Menu
Files Menu Item
Description
View Source
Opens the selected file in a Source window
Open in external editor
Opens the selected file in an external editor.
Only available if you have set the Editor preference:
• set PrefMain(Editor) {<path_to_executable>}
• Tools > Edit Preferences; by Name tab, Main
group.
Save Files
Saves a text file containing a sorted list of unique
files, one per line. The default name is summary.txt.
ModelSim SE GUI Reference Manual, v10.2c
131
FSM List Window
Use this window to view a list of finite state machines in your design.
Window Reference
Prerequisites
This window is populated when you specify any of the following switches during compilation
(vcom/vlog) or optimization (vopt).
•
•
+cover or +cover=f
+acc or +acc=f
Accessing
Access the window using either of the following:
•
•
Menu item: View > FSM List
Command: view fsmlist
Figure 4-18. FSM List Window
GUI Elements of the FSM List Window
This section describes GUI elements specific to this Window.
ModelSim SE GUI Reference Manual, v10.2c
132
Window Reference
FSM List Window
Column Descriptions
Table 4-23. FSM List Window Columns
Column Title
Description
Instance
Lists the FSM instances.
You can reduce the number of path elements in this
column by selecting the FSM List > Options menu
item and altering the Number of Path Elements
selection box.
States
The number of states in the FSM.
Transitions
The number of transitions in the FSM.
Popup Menu
Right-click on one of the FSMs in the window to display the popup menu and select one of the
following options:
Table 4-24. FSM List Window Popup Menu
Popup Menu Item
Description
View FSM
Opens the FSM in the FSM Viewer window.
View Declaration
Opens the source file for the FSM instance.
Set Context
Changes the context to the FSM instance.
Add to <window>
Adds FSM information to the specified window.
Properties
Displays the FSM Properties dialog box containing
detailed information about the FSM.
FSM List Menu
This menu becomes available in the Main menu when the FSM List window is active.
Table 4-25. FSM List Menu
Popup Menu Item
Description
View FSM
Opens the FSM in the FSM Viewer window.
View Declaration
Opens the source file for the FSM instance.
Add to <window>
Adds FSM information to the specified window.
ModelSim SE GUI Reference Manual, v10.2c
133
Window Reference
FSM List Window
Table 4-25. FSM List Menu (cont.)
134
Popup Menu Item
Description
Options
Displays the FSM Display Options dialog box,
which allows you to control:
• how FSM information is added to the Wave
Window.
• how much information is shown in the Instance
Column.
ModelSim SE GUI Reference Manual, v10.2c
FSM Viewer Window
Use this window to graphically analyze finite state machines in your design.
Window Reference
Prerequisites
•
Analyze FSMs and their coverage data — you must specify +cover, or explicitly
+cover=f, during compilation and -coverage on the vsim command line to fully analyze
FSMs with coverage data.
•
Analyze FSMs without coverage data — you must specify +acc, or explicitly +acc=f,
during compilation (vcom/vlog) or optimization (vopt) to analyze FSMs with the FSM
Viewer window.
Accessing
Access the window:
•
•
From the FSM List window, double-click on the FSM you want to analyze.
From the Objects, Locals, Wave, or Code Coverage Analyze’s FSM Analysis windows,
click on the FSM button
for the FSM you want to analyze.
Figure 4-19. FSM Viewer Window
ModelSim SE GUI Reference Manual, v10.2c
135
Window Reference
FSM Viewer Window
FSM Viewer Window Tasks
This section describes tasks for using the FSM Viewer window.
Using the Mouse in the FSM Viewer
These mouse operations are defined for the FSM Viewer:
•
The mouse wheel performs zoom & center operations on the diagram.
o
Mouse wheel up — zoom out.
o
Mouse wheel down — zoom in.
Whether zooming in or out, the view will re-center towards the mouse location.
•
•
Left mouse button — click and drag to move the view of the FSM.
Middle mouse button — click and drag to perform the following stroke actions:
o
Up and left — Zoom Full.
o
Up and right — Zoom Out. The amount is determined by the distance dragged.
o
Down and right — Zoom In on the area of the bounding box.
Using the Keyboard in the FSM Viewer
These keyboard operations are defined for the FSM Viewer:
•
Arrow Keys — scrolls the window in the specified direction.
o
Unmodified — scrolls by a small amount.
o
Ctrl+<arrow key> — scrolls by a larger amount.
o
Shift+<arrow key> — shifts the view to the edge of the display.
Exporting the FSM Viewer Window as an Image
Save the FSM view as an image for use in other applications.
1. Select the FSM Viewer window.
2. Export to one of the following formats:
136
o
Postscript — File > Print Postscript
o
Bitmap (.bmp) — File > Export > Image
JPEG (.jpg)
PNG (.png)
GIF (.gif)
ModelSim SE GUI Reference Manual, v10.2c
Window Reference
FSM Viewer Window
Combining Common Transitions to Reset
By default, the FSM Viewer window combines transitions to reset that are based upon common
conditions. This reduces the amount of information drawn in the window and eases your FSM
debugging tasks.
Figure 4-20 shows two versions of the same FSM. The top image shows all of the transitions
and the bottom image combines the common conditions (rst) into a single transition, as
referenced by the gray diamond placeholder.
You control the level of detail for transitions with the FSM View > Transitions to “reset”
menu items.
ModelSim SE GUI Reference Manual, v10.2c
137
Window Reference
FSM Viewer Window
Figure 4-20. Combining Common Transition Conditions
138
ModelSim SE GUI Reference Manual, v10.2c
Window Reference
FSM Viewer Window
GUI Elements of the FSM Viewer Window
This section describes GUI elements specific to this Window.
Table 4-26. FSM Viewer Window — Graphical Elements
Graphical Element Description
Definition
Blue state bubble
Default appearance for non-reset states.
Green state bubble
Indicates the FSMs current state, or the state of
the wave cursor location (when tracking the
wave cursor).
Yellow state bubble
Indicates the FSMs previous state, or the state
of the wave cursor location (when tracking the
wave cursor).
Tan state bubble with Indicates a reset state.
double outline.
Gray diamond
Indicates there are several transitions to reset
with the same expression. This is a placeholder
to reduce the number of objects drawn in the
window. You can view all common
expressions by selecting:
FSM View > Transitions to “reset” > Show
All
Transition box
Contains information about the transition,
• Cond: specifies the transition condition1
• Count: specifies the coverage count
Black transition line. Indicates a transition.
ModelSim SE GUI Reference Manual, v10.2c
139
Window Reference
FSM Viewer Window
Table 4-26. FSM Viewer Window — Graphical Elements (cont.)
Graphical Element Description
Definition
Red transition line.
Indicates a transition that has zero (0) coverage.
1. The condition format is based on the GUI_expression_format Operators.
Popup Menu
Right-click in the window to display the popup menu and select one of the following options:
Table 4-27. FSM View Window Popup Menu
Popup Menu Item
Description
Transition
Only available when right-clicking on a transition.
• Goto Source — Opens the source file containing
the state machine and highlights the transition
code.
• View Full Text — Opens the View Transition
dialog box, which contains the full text of the
condition.
View Declaration
Opens the source file and bookmarks the file line
containing the declaration of the state machine
Zoom Full
Displays the FSM completely within the window.
Set Context
Executes the env command to change the context to
that of the state machine.
Add to ...
Adds information about the state machine to the
specific window.
Properties
Displays the FSM Properties dialog box containing
detailed information about the FSM.
FSM View Menu
This menu becomes available in the Main menu when the FSM View window is active.
Table 4-28. FSM View Menu
140
FSM View Menu Item
Description
Show State Counts
Displays the coverage counts for each state in the
state bubble.
Show Transition Counts
Displays the coverage counts for each transition.
ModelSim SE GUI Reference Manual, v10.2c
Window Reference
FSM Viewer Window
Table 4-28. FSM View Menu (cont.)
FSM View Menu Item
Description
Show Transition Conditions Displays the condition for each transition.
The condition format is based on the
GUI_expression_format Operators.
Enable Info Mode Popups
Displays popup information when you hover over a
state or transition.
Track Wave Cursor
Displays current and previous state information
based on the cursor location in the Wave window.
Transitions to “Reset”
Controls the display of transitions to a reset state:
• Show All
• Show None — will also add a “hide all” note to
the lower-right hand corner.
• Hide Asynchronous Only
• Combine Common Transitions — (default)
creates a single transition for any transitions to
reset that use the same condition. The transition
is shown from a gray diamond that acts as a
placeholder.
Options
Displays the FSM Display Options dialog box,
which allows you to control:
• how FSM information is added to the Wave
Window.
• how much information is shown in the Instance
Column
ModelSim SE GUI Reference Manual, v10.2c
141
Instance Coverage Window
Use this window to analyze coverage statistics for each instance in a flat, non-hierarchical view.
You can sort data columns to be more meaningful, and not be confused by hierarchy. This
window contains the same code coverage statistics columns as in the Files and Structure
windows.
Window Reference
Prerequisites
This window is specific to the collection of coverage metrics, therefore you must have run your
simulation with coverage collection enabled. Refer to the chapter “Code Coverage” for more
information.
Accessing
Access the window using either of the following:
•
•
Menu item: View > Coverage > Instance Coverage
Command: view instance
Figure 4-21. Instance Coverage Window
Instance Coverage Window Tasks
This section describes tasks for using the Instance Coverage window.
Setting a Coverage Threshold
You can specify a percentage above or below which you don’t want to see coverage statistics.
For example, you might set a threshold of 85% such that only objects with coverage below that
percentage are displayed. Anything above that percentage is filtered.
Procedure
1. Right-click any object in the Instance Coverage window.
ModelSim SE GUI Reference Manual, v10.2c
142
Window Reference
Instance Coverage Window
2. Select Set filter. The “Filter instance list” dialog appears as in Figure 4-22.
Figure 4-22. Filter Instance List Dialog Box
GUI Elements of the Instance Coverage Window
This section describes GUI elements specific to this Window.
Column Descriptions
The table below lists columns in the Instance Coverage window with a description of their
contents (Table 4-29).
Table 4-29. Columns in the Instance Coverage Window
Column name
Description
Assertion %
the number of hits from the total number of assertions, as a percentage
Assertion graph
a bar chart displaying the Assertion %; if the percentage is below 90%,
the bar is red; 90% or more, the bar is green; you can change this
threshold percentage by editing the PrefCoverage(cutoff) preference
variable
Assertion hits
Assertion hits shows different counts based on whether the -assertdebug
is used:
• with -assertdebug argument to vsim command: number of assertions
whose pass count is greater than 0, and fail count is equal to 0
• without -assertdebug: number of assertions whose fail count is equal
to 0
Assertion misses
the number of assertions whose fail counts are greater than 0
ModelSim SE GUI Reference Manual, v10.2c
143
Window Reference
Instance Coverage Window
Table 4-29. Columns in the Instance Coverage Window (cont.)
Column name
Description
Branch %
the current ratio of Branch hits to Branch count
Branch count
Files window — the number of executable branches in each file
Structure window — the number of executable branches in each level and
all levels under that level
Branch graph
a bar chart displaying the Branch %; if the percentage is below 90%, the
bar is red; 90% or more, the bar is green; you can change this threshold
percentage by editing the PrefCoverage(cutoff) preference variable
Branches hit
the number of executable branches that have been executed in the current
simulation
Branches missed
the number of executable branches that were not executed in the current
simulation
Cover %
the number of hits from the total number of cover directives, as a
percentage
Cover graph
a bar chart displaying the Cover directive %; if the percentage is below
90%, the bar is red; 90% or more, the bar is green; you can change this
threshold percentage by editing the PrefCoverage(cutoff) preference
variable
Cover hits
the number of cover directives whose count values are greater than or
equal to the at_least value.
Cover misses
the number of cover directives whose count values are less than the
at_least value
Covergroup %
the number of hits from the total number of covergroups, as a percentage
Covergroup bins
the number of covergroup bins
Covergroup graph
a bar chart displaying the Covergroup %; if the percentage is below 90%,
the bar is red; 90% or more, the bar is green
Covergroup hit
bins
the number of hit covergroup bins
Covergroup missed the number of missed covergroup bins
bins
Covergroup
weighted missed
bins
the number of weighted covergroup bins that were missed
Design Unit
the name of the design unit
Design Unit Type
the type of design unit
FEC Condition %
the current ratio of FEC Condition hits to FEC Condition rows
144
ModelSim SE GUI Reference Manual, v10.2c
Window Reference
Instance Coverage Window
Table 4-29. Columns in the Instance Coverage Window (cont.)
Column name
Description
FEC Condition
graph
a bar chart displaying the FEC Condition %; if the percentage is below
90%, the bar is red; 90% or more, the bar is green; you can change this
threshold percentage by editing the PrefCoverage(cutoff) preference
variable
FEC Condition
rows
the number of FEC conditions in each instance
FEC Conditions hit the number of times the FEC conditions in an instance that have been
executed
FEC Conditions
missed
the number of FEC conditions in an instance that were not executed
FEC Expression % the current ratio of FEC Expression hits to FEC Expression rows
FEC Expression
graph
a bar chart displaying the FEC Expression %; if the percentage is below
90%, the bar is red; 90% or more, the bar is green; you can change this
threshold percentage by editing the PrefCoverage(cutoff) preference
variable
FEC Expression
rows
the number of executable expressions in each instance
FEC Expressions
hit
the number of times expressions in an instance have been executed
FEC Expressions
missed
the number of executable expressions in an instance that were not
executed
State %
the current ratio of State hits to State rows
State graph
a bar chart displaying the State %; if the percentage is below 90%, the bar
is red; 90% or more, the bar is green; you can change this threshold
percentage by editing the PrefCoverage(cutoff) preference variable
States
the number of states encountered in each instance
States hit
the number of times the states were hit
States missed
the number of states in an instance that were not hit
Stmt %
the current ratio of Stmt hits to Stmt count
Stmt graph
a bar chart displaying the Stmt %; if the percentage is below 90%, the bar
is red; 90% or more, the bar is green; you can change this threshold
percentage by editing the PrefCoverage(cutoff) preference variable
Stmt count
the number of executable statements in each level and all levels under that
level
Stmts hit
the number of executable statements that were executed in each level and
all levels under that level
ModelSim SE GUI Reference Manual, v10.2c
145
Window Reference
Instance Coverage Window
Table 4-29. Columns in the Instance Coverage Window (cont.)
Column name
Description
Stmts missed
the number of executable statements that were not executed in each level
and all levels under that level
Toggle %
the current ratio of Toggle hits to Toggle nodes
Toggle graph
a bar chart displaying the Toggle %; if the percentage is below 90%, the
bar is red; 90% or more, the bar is green; you can change this threshold
percentage by editing the PrefCoverage(cutoff) preference variable
Toggle nodes
the number of points in each instance where the logic will transition from
one state to another
Toggles hit
the number of nodes in each instance that have transitioned at least once
Toggles missed
the number of nodes in each instance that have not transitioned at least
once
Total Coverage
The weighted average of all the coverage types (functional coverage and
code coverage) is recursive. Deselect Code Coverage > Enable
Recursive Coverage Sums to view results for the local instance. See
“Calculation of Total Coverage” for coverage statistics details.
Transition %
the current ratio of Transition hits to Transition rows
Transition graph
a bar chart displaying the State %; if the percentage is below 90%, the bar
is red; 90% or more, the bar is green; you can change this threshold
percentage by editing the PrefCoverage(cutoff) preference variable
Transitions
the number of transitions encountered in each instance
Transitions hit
the number of times the transitions were hit
Transitions missed
the number of transitions in an instance that were not hit
UDP Condition %
the current ratio of UDP Condition hits to UDP Condition rows
UDP Condition
graph
a bar chart displaying the Condition %; if the percentage is below 90%,
the bar is red; 90% or more, the bar is green; you can change this
threshold percentage by editing the PrefCoverage(cutoff) preference
variable
UDP Condition
rows
the number of UDP conditions in each instance
UDP Conditions hit the number of times the UDP conditions in an instance that have been
executed
UDP Conditions
missed
the number of conditions in an instance that were not executed
UDP Expression % the current ratio of UDP Expression hits to UDP Expression rows
146
ModelSim SE GUI Reference Manual, v10.2c
Window Reference
Instance Coverage Window
Table 4-29. Columns in the Instance Coverage Window (cont.)
Column name
Description
UDP Expression
graph
a bar chart displaying the UDP Expression %; if the percentage is below
90%, the bar is red; 90% or more, the bar is green; you can change this
threshold percentage by editing the PrefCoverage(cutoff) preference
variable
UDP Expression
rows
the number of executable UDP expressions in each level and all levels
subsumed under that level
UDP Expressions
hit
the number of times UDP expressions in a level, and each level under that
level, have been executed
UDP Expressions
missed
the number of executable UDP expressions in a level, and all levels under
that level, that were not executed
Popup Menu
Right-click anywhere in the window to display the popup menu and select one of the following
options:
Table 4-30. Instance Coverage Popup Menu
Popup Menu Item
Description
Code coverage reports
Displays the Coverage Text Report dialog box,
which allows you to create reports based on your
code coverage metrics.
Set Filter
Displays the Filter Instance List Dialog Box
Clear code coverage data
Clears all of the code coverage data from the GUI.
Test Analysis
Executes coverage analyze on the selected instance
and prints information to the Test Analysis window.
• Find Least Coverage
• Find Most Coverage
• Find Zero Coverage
• Find Non Zero Coverage
• Summary
XML Import Hint
Displays the XML Import Hint dialog box with
information about the Link Type and Name.
ModelSim SE GUI Reference Manual, v10.2c
147
Library Window
Use this window to view design libraries and compiled design units.
Window Reference
Accessing
Access the window using either of the following:
•
•
Menu item: View > Library
Command: view library
Figure 4-23. Library Window
GUI Elements of the Library Window
This section describes GUI elements specific to this Window.
Column Descriptions
Table 4-31. Library Window Columns
Column Title
Description
Name
Name of the library or design unit
Path
Full pathname to the file
Type
Type of file
ModelSim SE GUI Reference Manual, v10.2c
148
Window Reference
Library Window
Popup Menu
Right-click anywhere in the window to display the popup menu and select one of the following
options:
Table 4-32. Library Window Popup Menu
Popup Menu Item
Description
Simulate
Loads a simulation of the selected design unit,
implicitly calling vopt with full visibility
(-voptargs=+acc)
Simulate without Optimization
Loads a simulation of the selected design unit, where
it does not use optimization (-novopt)
Simulate with full Optimization
Loads a simulation of the selected design unit,
implicitly calling vopt with no visibility
Simulate with Coverage
Loads a simulation of the selected design unity,
enabling coverage (-coverage)
Edit
Opens the selected file in your editor window.
Refresh
Reloads the contents of the window
Recompile
Compiles the selected file.
Optimize
Runs vopt on the selected file.
Update
Create Wave
Runs the wave create command for any ports in the
selected design unit.
Delete
Removes a design unit from the library or runs the
vdel command on a selected library.
Copy
Copies the directory location of libraries or the
library location of design units within the library.
New
Allows you to create a new library with the Create a
New Library dialog box.
Properties
Displays information about the selected library or
design unit.
ModelSim SE GUI Reference Manual, v10.2c
149
List Window
The List window displays simulation results in tabular format. Common List window tasks
include:
Window Reference
•
Using gating expressions and trigger settings to focus in on particular signals or events.
See Configuring New Line Triggering.
•
Debugging delta delay issues. See Delta Delays for more information.
The window is divided into two adjustable panes, which allows you to scroll horizontally
through the listing on the right, while keeping time and delta visible on the left.
Figure 4-24. Tabular Format of the List Window
Use this window to display a textual representation of waveforms, which you can configure to
show events and delta events for the signals or objects you have added to the window.
You can view the following object types in the List window:
•
•
•
•
•
•
VHDL — signals, aliases, process variables, and shared variables
Verilog — nets, registers, and variables
SystemC — primitive channels, ports, and transactions
Comparisons — comparison objects; see Waveform Compare for more information
Virtuals — virtual signals and functions
SystemVerilog and PSL assertions — assert directives
ModelSim SE GUI Reference Manual, v10.2c
150
Window Reference
List Window
•
•
•
SystemVerilog and PSL cover directives — cover directives
Questa Verification IP objects (see Questa Verification IP Objects in the GUI)
SystemVerilog — transactions
Accessing
Access the window using either of the following:
•
•
Menu item: View > List
Command: view list
Figure 4-25. List Window
List Window Tasks
This section describes tasks for using the List window.
Adding Data to the List Window
You can add objects to the List window in any of the following ways:
•
right-clicking on signals and objects in the Objects window or the Structure window and
selecting Add > to List.
•
•
using the add list command.
using the “Add Selected to Window Button”.
ModelSim SE GUI Reference Manual, v10.2c
151
Window Reference
List Window
Selecting Multiple Signals
To create a larger group of signals and assign a new name to this group, do the following:
1. Select a group of signals
o
Shift-click on signal columns to select a range of signals.
o
Control-click on signal columns to select a group of specific signals.
2. Select List > Combine Signals
3. Complete the Combine Selected Signals dialog box
o
Name — Specify the name you want to appear as the name of the new signal.
o
Order of Indexes — Specify the order of the new signal as ascending or descending.
o
Remove selected signals after combining — Specify whether the grouped signals
should remain in the List window.
This process creates virtual signals. For more information, refer to the section Virtual Signals.
Setting Time Markers in the List Window
Time markers in the List window are similar to cursors in the Wave window. Time markers tag
lines in the data table so you can quickly jump back to that time. Markers are indicated by a thin
box surrounding the marked line.
Figure 4-26. Time Markers in the List Window
152
ModelSim SE GUI Reference Manual, v10.2c
Window Reference
List Window
Working with Markers
The table below summarizes actions you can take with markers.
Table 4-33. Actions for Time Markers
Action
Method
Add marker
Select a line and then select List > Add Marker
Delete marker
Select a tagged line and then select List > Delete Marker
Goto marker
Select View > Goto > <time> (only available when
undocked)
Expanded Time Viewing in the List Window
Event time may be shown in the List window in the same manner as delta time by using the
-delta events option with the configure list command.
When the List window displays event times, the event time is relative to events on other signals
also displayed in the List window. This may be misleading, as it may not correspond to event
times displayed in the Wave window for the same events if different signals are added to the
Wave and List windows.
The write list command (when used after the configure list -delta events command) writes a list
file in tabular format with a line for every event. Please note that this is different from the write
list -events command, which writes a non-tabular file using a print-on-change format.
The following examples illustrate the appearance of the List window and the corresponding text
file written with the write list command after various options for the configure list -delta
command are used.
Figure 4-27 shows the appearance of the List window after the configure list -delta none
command is used. It corresponds to the file resulting from the write list command. No column is
shown for deltas or events.
Figure 4-27. List Window After configure list -delta none Option is Used
ModelSim SE GUI Reference Manual, v10.2c
153
Window Reference
List Window
Figure 4-28 shows the appearance of the List window after the configure list -delta collapse
command is used. It corresponds to the file resulting from the write list command. There is a
column for delta time and only the final delta value and the final value for each signal for each
simulation time step (at which any events have occurred) is shown.
Figure 4-28. List Window After configure list -delta collapse Option is Used
Figure 4-29 shows the appearance of the List window after the configure list -delta all option is
used. It corresponds to the file resulting from the write list command. There is a column for
delta time, and each delta time step value is shown on a separate line along with the final value
for each signal for that delta time step.
Figure 4-29. List Window After write list -delta all Option is Used
Figure 4-30 shows the appearance of the List window after the configure list -delta events
command is used. It corresponds to the file resulting from the write list command. There is a
column for event time, and each event time step value is shown on a separate line along with the
final value for each signal for that event time step. Since each event corresponds to a new event
time step, only one signal will change values between two consecutive lines.
154
ModelSim SE GUI Reference Manual, v10.2c
Window Reference
List Window
Figure 4-30. List Window After write list -event Option is Used
Searching in the List Window
The List window provides two methods for locating objects:
1. Finding signal names:
o
Select Edit > Find
o
click the Find toolbar button (binoculars icon)
o
use the find command
The first two of these options will open a Find mode toolbar at the bottom of the List
window. By default, the “Search For” option is set to “Name.” For more information,
see Find and Filter Functions.
2. Search for values or transitions:
o
Select Edit > Signal Search
o
click the Find toolbar button (binoculars icon) and select Search For > Value from
the Find toolbar that appears at the bottom of the List window.
o
use the search command
Searching for Values or Transitions
The search command lets you search for values of selected signals. When you select Edit >
Signal Search, the List Signal Search dialog (Figure 4-31) appears.
ModelSim SE GUI Reference Manual, v10.2c
155
Window Reference
List Window
Figure 4-31. Wave Signal Search Dialog Box
One option of note is Search for Expression. The expression can involve more than one signal
but is limited to signals currently in the window. Expressions can include constants, variables,
and DO files. Refer to Expression Syntax for more information.
Any search terms or settings you enter are saved from one search to the next in the current
simulation. To clear the search settings during debugging click the Reset To Initial Settings
button. The search terms and settings are cleared when you close ModelSim.
Note
If your signal values are displayed in binary radix, refer to Searching for Binary Signal
Values in the GUI for details on how signal values are mapped between a binary radix
and std_logic.
Using the Expression Builder for Expression Searches
The Expression Builder is a feature of the List Signal Search dialog box and the List trigger
properties dialog box. You can use it to create a search expression that follows the
GUI_expression_format.
156
ModelSim SE GUI Reference Manual, v10.2c
Window Reference
List Window
To display the Expression Builder dialog box, do the following:
1. Choose Edit > Signal Search... from the main menu. This displays the Wave Signal
Search dialog box.
2. Select Search for Expression.
3. Click the Builder button. This displays the Expression Builder dialog box shown in
Figure 4-32
Figure 4-32. Expression Builder Dialog Box
You click the buttons in the Expression Builder dialog box to create a GUI expression. Each
button generates a corresponding element of Expression Syntax and is displayed in the
Expression field. In addition, you can use the Selected Signal button to create an expression
from signals you select from the List window.
For example, instead of typing in a signal name, you can select signals in a List window and
then click Selected Signal in the Expression Builder. This displays the Select Signal for
Expression dialog box shown in Figure 4-33.
ModelSim SE GUI Reference Manual, v10.2c
157
Window Reference
List Window
Figure 4-33. Selecting Signals for Expression Builder
Note that the buttons in this dialog box allow you to determine the display of signals you want
to put into an expression:
List only Select Signals — list only those signals that are currently selected in the
parent window.
List All Signals — list all signals currently available in the parent window.
Once you have selected the signals you want displayed in the Expression Builder, click OK.
Saving an Expression to a Tcl Variable
Clicking the Save button will save the expression to a Tcl variable. Once saved this variable can
be used in place of the expression. For example, say you save an expression to the variable
"foo." Here are some operations you could do with the saved variable:
•
Read the value of foo with the set command:
set foo
•
•
Put $foo in the Expression: entry box for the Search for Expression selection.
Issue a searchlog command using foo:
searchlog -expr $foo 0
158
ModelSim SE GUI Reference Manual, v10.2c
Window Reference
List Window
Formatting the List Window
Setting List Window Display Properties
Before you add objects to the List window, you can set the window’s display properties. To
change when and how a signal is displayed in the List window, select Tools > List Preferences
from the List window menu bar (when the window is undocked).
Figure 4-34. Modifying List Window Display Properties
Formatting Objects in the List Window
You can adjust various properties of objects to create the view you find most useful. Select one
or more objects and then select View > Signal Properties from the List window menu bar
(when the window is undocked).
Changing Radix (base) for the List Window
One common adjustment you can make to the List window display is to change the radix (base)
of an object. To do this, choose View > Properties from the main menu, which displays the List
Signal Properties dialog box. Figure 4-35 shows the list of radix types you can select in this
dialog box.
ModelSim SE GUI Reference Manual, v10.2c
159
Window Reference
List Window
Figure 4-35. List Signal Properties Dialog
The default radix type is symbolic, which means that for an enumerated type, the window lists
the actual values of the enumerated type of that object. For the other radix types (binary, octal,
decimal, unsigned, hexadecimal, ASCII, time), the object value is converted to an appropriate
representation in that radix.
Changing the radix can make it easier to view information in the List window. Compare the
image below (with decimal values) with the image in the section List Window (with symbolic
values).
160
ModelSim SE GUI Reference Manual, v10.2c
Window Reference
List Window
Figure 4-36. Changing the Radix in the List Window
In addition to the List Signal Properties dialog box, you can also change the radix:
•
Change the default radix for the current simulation using Simulate > Runtime Options
(Main window)
•
•
Change the default radix for the current simulation using the radix command.
Change the default radix permanently by editing the DefaultRadix variable in the
modelsim.ini file.
Saving the Window Format
By default, all List window information is lost once you close the window. If you want to
restore the windows to a previously configured layout, you must save a window format file as
follows:
1. Add the objects you want to the List window.
2. Edit and format the objects to create the view you want.
3. Save the format to a file by selecting File > Save Format. This opens the Save Format
dialog box where you can save List window formats in a .do file.
To use the format file, start with a blank List window and run the DO file in one of two ways:
•
Invoke the do command from the command line:
VSIM> do <my_format_file>
ModelSim SE GUI Reference Manual, v10.2c
161
Window Reference
List Window
•
Select File > Load.
Note
Window format files are design-specific. Use them only with the design you were
simulating when they were created.
In addition, you can use the write format restart command to create a single .do file that will
recreate all debug windows and breakpoints (see Saving and Restoring Breakpoints) when
invoked with the do command in subsequent simulation runs. The syntax is:
write format restart <filename>
If the ShutdownFile modelsim.ini variable is set to this .do filename, it will call the write format
restart command upon exit.
Combining Signals into Buses
You can combine signals in the List window into buses. A bus is a collection of signals
concatenated in a specific order to create a new virtual signal with a specific value. A virtual
compare signal (the result of a comparison simulation) is not supported for combination with
any other signal.
To combine signals into a bus, use one of the following methods:
•
Select two or more signals in the Wave or List window and then choose List > Combine
Signals from the menu bar. A virtual signal that is the result of a comparison simulation
is not supported for combining with any other signal.
•
Use the virtual signal command at the Main window command prompt.
Configuring New Line Triggering
New line triggering refers to what events cause a new line of data to be added to the List
window. By default ModelSim adds a new line for any signal change including deltas within a
single unit of time resolution.
You can set new line triggering on a signal-by-signal basis or for the whole simulation. To set
for a single signal, select View > Signal Properties from the List window menu bar (when the
window is undocked) and select the Triggers line setting. Individual signal settings override
global settings.
162
ModelSim SE GUI Reference Manual, v10.2c
Window Reference
List Window
Figure 4-37. Line Triggering in the List Window
To modify new line triggering for the whole simulation, select Tools > List Preferences from
the List window menu bar (when the window is undocked), or use the configure command.
When you select Tools > List Preferences, the Modify Display Properties dialog appears:
ModelSim SE GUI Reference Manual, v10.2c
163
Window Reference
List Window
Figure 4-38. Setting Trigger Properties
The following table summaries the triggering options:
Table 4-34. Triggering Options
164
Option
Description
Deltas
Choose between displaying all deltas (Expand
Deltas), displaying the value at the final delta
(Collapse Delta). You can also hide the delta
column all together (No Delta), however this will
display the value at the final delta.
Strobe trigger
Specify an interval at which you want to trigger
data display
Trigger gating
Use a gating expression to control triggering; see
Using Gating Expressions to Control Triggering for
more details
ModelSim SE GUI Reference Manual, v10.2c
Window Reference
List Window
Using Gating Expressions to Control Triggering
Trigger gating controls the display of data based on an expression. Triggering is enabled once
the gating expression evaluates to true. This setup behaves much like a hardware signal analyzer
that starts recording data on a specified setup of address bits and clock edges.
Here are some points about gating expressions:
•
•
Gating expressions affect the display of data but not acquisition of the data.
•
The duration determines for how long triggering stays enabled after the gating
expression returns to false (0). The default of 0 duration will enable triggering only
while the expression is true (1). The duration is expressed in x number of default
timescale units.
•
Gating is level-sensitive rather than edge-triggered.
The expression is evaluated when the List window would normally have displayed a row
of data (given the other trigger settings).
Trigger Gating Example Using the Expression Builder
This example shows how to create a gating expression with the ModelSim Expression Builder.
Here is the procedure:
1. Select Tools > Window Preferences from the List window menu bar (when the window
is undocked) and select the Triggers tab.
2. Click the Use Expression Builder button.
Figure 4-39. Trigger Gating Using Expression Builder
ModelSim SE GUI Reference Manual, v10.2c
165
Window Reference
List Window
3. Select the signal in the List window that you want to be the enable signal by clicking on
its name in the header area of the List window.
4. Click Insert Selected Signal and then 'rising in the Expression Builder.
5. Click OK to close the Expression Builder.
You should see the name of the signal plus "rising" added to the Expression entry box of
the Modify Display Properties dialog box.
6. Click OK to close the dialog.
If you already have simulation data in the List window, the display should immediately switch
to showing only those cycles for which the gating signal is rising. If that isn't quite what you
want, you can go back to the expression builder and play with it until you get it the way you
want it.
If you want the enable signal to work like a "One-Shot" that would display all values for the
next, say 10 ns, after the rising edge of enable, then set the On Duration value to 10 ns.
Trigger Gating Example Using Commands
The following commands show the gating portion of a trigger configuration statement:
configure list -usegating 1
configure list -gateduration 100
configure list -gateexpr {/test_delta/iom_dd'rising}
See the configure command for more details.
Sampling Signals at a Clock Change
You easily can sample signals at a clock change using the add list command with the
-notrigger argument. The -notrigger argument disables triggering the display on the specified
signals. For example:
add list clk -notrigger a b c
When you run the simulation, List window entries for clk, a, b, and c appear only when clk
changes.
If you want to display on rising edges only, you have two options:
1. Turn off the List window triggering on the clock signal, and then define a repeating
strobe for the List window.
2. Define a "gating expression" for the List window that requires the clock to be in a
specified state. See above.
166
ModelSim SE GUI Reference Manual, v10.2c
Window Reference
List Window
Viewing Differences in the List Window
The Waveform Compare feature allows you to compare simulation runs and display differences
in the List window. For a complete discussion of the Waveform Compare feature and how
differences are displayed in both the Wave and List windows see Waveform Compare.
Other List Window Tasks
List > List Preferences — Allows you to specify the preferences of the List window.
File > Export > Tabular List — Exports the information in the List window to a file in
tabular format. Equivalent to the command:
write list <filename>
File > Export > Event List — Exports the information in the List window to a file in
print-on-change format. Equivalent to the command:
write list -event <filename>
File > Export > TSSI List — Exports the information in the List window to a file in
TSSI. Equivalent to the command:
write tssi -event <filename>
Edit > Signal Search — Allows you to search the List window for activity on the
selected signal.
GUI Elements of the List Window
This section describes the GUI elements specific to the List window.
Window Panes
The List window is divided into two adjustable panes, which allow you to scroll horizontally
through the listing on the right, while keeping time and delta visible on the left.
•
•
The left pane shows the time and any deltas that exist for a given time.
The right pane contains the data for the signals and objects you have added for each time
shown in the left pane. The top portion of the window contains the names of the signals.
The bottom portion shows the signal values for the related time.
Note
The display of time values in the left column is limited to 10 characters. Any time value
of more than 10 characters is replaced with the following:
too narrow
ModelSim SE GUI Reference Manual, v10.2c
167
Window Reference
List Window
Markers
The markers in the List window are analogous to cursors in the Wave window. You can add,
delete and move markers in the List window similarly to the Wave window. You will notice two
different types of markers:
Active Marker — The most recently selected marker shows as a black highlight.
Non-active Marker — Any markers you have added that are not active are shown with
a green border.
You can manipulate the markers in the following ways:
Setting a marker — When you click in the right-hand portion of the List window, you
will highlight a given time (black horizontal highlight) and a given signal or object
(green vertical highlight).
Moving the active marker — List window markers behave the same as Wave window
cursors. There is one active marker which is where you click along with inactive
markers generated by the Add Marker command. Markers move based on where you
click. The closest marker (either active or inactive) will become the active marker, and
the others remain inactive.
Adding a marker — You can add an additional marker to the List window by rightclicking at a location in the right-hand side and selecting Add Marker.
Deleting a marker — You can delete a marker by right-clicking in the List window and
selecting Delete Marker. The marker closest to where you clicked is the marker that will
be deleted.
Popup Menu
Right-click in the right-hand pane to display the popup menu and select one of the following
options:
Table 4-35. List Window Popup Menu
168
Popup Menu Item
Description
Examine
Displays the value of the signal over which you used
the right mouse button, at the time selected with the
Active Marker
Annotate Diff
Allows you to annotate a waveform comparison
difference with additional information. For more
information refer to the compare annotate command.
Available only during a Waveform Comparison
ModelSim SE GUI Reference Manual, v10.2c
Window Reference
List Window
Table 4-35. List Window Popup Menu
Popup Menu Item
Description
Ignore Diff
Flags the waveform compare difference as
“ignored”. For more information refer to the
compare annotate command. Available only during a
Waveform Comparison
Add Marker
Adds a marker at the location of the Active Marker
Delete Marker
Deletes the closest marker to your mouse location
The following menu items are available when the List window is active:
ModelSim SE GUI Reference Manual, v10.2c
169
Locals Window
Use this window to display data objects declared in the current, or local, scope of the active
process. These data objects are immediately visible from the statement that will be executed
next, which is denoted by a blue arrow in a Source window. The contents of the window change
from one statement to the next.
Window Reference
When encountering a C breakpoint, the Locals window displays automatic local variables and
their value in current C/C++ function scope.
Accessing
Access the window using either of the following:
•
•
Menu item: View > locals
Command: view locals
Figure 4-40. Locals Window
Locals Window Tasks
This section describes tasks for using the Locals window.
Viewing Data in the Locals Window
You cannot actively place information in the Locals window, it is updated as you go through
your simulation. However, there are several ways you can trigger the Locals window to be
updated.
•
•
Run your simulation while debugging.
Select a Process from the Processes Window.
ModelSim SE GUI Reference Manual, v10.2c
170
Window Reference
Locals Window
•
Select a Verilog function or task or VHDL function or procedure from the Call Stack
Window.
GUI Elements of the Locals Window
This section describes the GUI elements specific to the Locals Window.
Column Descriptions
Table 4-36. Locals Window Columns
Column
Description
Name
lists the names of the immediately visible data objects.
This column also includes design object icons for the
objects, refer to the section “Design Object Icons and
Their Meanings” for more information
Value
lists the current value(s) associated with each name
State Count
Not shown by default. This column, State Hits, and
State % are all specific to coverage analysis
State Hits
Not shown by default
State %
Not shown by default
Popup Menu
Right-click anywhere in the Locals window to open a popup menu.
Table 4-37. Locals Window Popup Menu
Popup Menu Item
Description
View Declaration
Displays, in the Source window, the declaration
of the object
Add
Adds the selected object(s) to the specified
window (Wave, List, Log, Dataflow, Schematic)
Copy
Copies selected item to clipboard
Find
Opens the Find toolbar at the bottom of the
window
Expand/Collapse
Expands or collapses data in the window
Global Signal Radix
Sets radix for selected signal(s) in all windows
Change
Displays the Change Selected Variable Dialog
Box, which allows you to alter the value of the
object
ModelSim SE GUI Reference Manual, v10.2c
171
Window Reference
Locals Window
Change Selected Variable Dialog Box
This dialog box allows you to change the value of the object you selected. When you click
Change, the tool executes the change command on the object.
Figure 4-41. Change Selected Variable Dialog Box
The Change Selected Variable dialog is prepopulated with the following information about the
object you had selected in the Locals window:
Variable Name — contains the complete name of the object.
Value — contains the current value of the object.
When you change the value of the object, you can enter any value that is valid for the variable.
An array value must be specified as a string (without surrounding quotation marks). To modify
the values in a record, you need to change each field separately.
172
ModelSim SE GUI Reference Manual, v10.2c
Memory Data Window
Use this window to view the contents of a memory.
Window Reference
Accessing
Access the window by:
•
Double-clicking on a memory in the Memory List window.
Figure 4-42. Memory Data Window
Memory Data Window Tasks
This section describes tasks for using the Memory Data window.
Direct Address Navigation
You can navigate to any address location directly by editing the address in the address column.
Double-click on any address, type in the desired address, and hit Enter. The address display
scrolls to the specified location.
Splitting the Memory Contents Window
To split a memory contents window into two screens displaying the contents of a single memory
instance select Memory Data > Split Screen.
ModelSim SE GUI Reference Manual, v10.2c
173
Window Reference
Memory Data Window
This allows you to view different address locations within the same memory instance
simultaneously.
Figure 4-43. Split Screen View of Memory Contents
GUI Elements of the Memory Data Window
This section describes GUI elements specific to this Window.
Popup Menu
Right-click in the window to display the popup menu and select one of the following options:
Table 4-38. Memory Data Popup Menu — Address Pane
174
Popup Menu Item
Description
Goto
Allows you to go to a specific address
Split Screen
Splits the Memory Data window to allow you to
view different parts of the memory simultaneously.
Properties
Allows you to set various properties for the Memory
Data window.
Close Instance
Closes the active Memory Data window.
Close All
Closes all Memory Data windows.
ModelSim SE GUI Reference Manual, v10.2c
Window Reference
Memory Data Window
Table 4-39. Memory Data Popup Menu — Data Pane
Popup Menu Item
Description
Edit
Allows you to edit the value of the selected data.
Change
Allows you to change data within the memory
through the use of the Change Memory dialog box.
Import Data Patterns
Allows you to import data patterns into the selected
memory through the Import Memory dialog box.
Export Data Patterns
Allows you to export data patterns from the selected
memory through the Export Memory dialog box.
Split Screen
Refer to items in the Memory Data Popup Menu —
Address Pane
Properties
Close Instance
Close All
Memory Data Menu
This menu becomes available in the Main menu when the Memory Data window is active.
Table 4-40. Memory Data Menu
Popup Menu Item
Description
Memory Declaration
Opens a Source window to the file and line number
where the memory is declared.
Compare Contents
Allows you to compare the selected memory against
another memory in the design or an external file.
Import Data Patterns
Refer to items in the Memory Data Popup Menu —
Data Pane
Export Data Patterns
Expand Packed Memories
Toggle the expansion of packed memories.
Identify Memories Within
Cells
Toggle the identification of memories within Verilog
cells.
Show VHDL String as
Memory
Toggle the identification of VHDL strings as
memories.
Split Screen
Refer to items in the Memory Data Popup Menu —
Address Pane
ModelSim SE GUI Reference Manual, v10.2c
175
Memory List Window
Use this window to view a list of all memories in your design.
Window Reference
Single dimensional arrays of integers are interpreted as 2D memory arrays. In these cases, the
word width listed in the Memory window is equal to the integer size, and the depth is the size of
the array itself.
Memories with three or more dimensions display with a plus sign ’+’ next to their names in the
Memory window. Click the ’+’ to show the array indices under that level. When you finally
expand down to the 2D level, you can double-click on the index, and the data for the selected
2D slice of the memory will appear in a memory contents window.
Prerequisites
The simulator identifies certain kinds of arrays in various scopes as memories. Memory
identification depends on the array element kind as well as the overall array kind (that is,
associative array, unpacked array, and so forth.).
Table 4-41. Memory Identification
VHDL
Element Kind1
•
•
•
•
•
•
Verilog/SystemVerilog
any integral type (that is,
enum2
integer_type):
bit_vector
floating point type • shortint
std_logic_vector
• int
std_ulogic_vector
• longint
integer type
• byte
• bit (2 state)
• logic
• reg
• integer
• time (4 state)
• packed_struct/
packed_union (2 state)
• packed_struct/
packed_union (4 state)
• packed_array
(single-Dim, multi-D, 2
state and 4 state)
• enum
• string
ModelSim SE GUI Reference Manual, v10.2c
SystemC
•
•
•
•
•
•
•
•
•
•
•
•
•
•
•
•
•
unsigned char
unsigned short
unsigned int
unsigned long
unsigned long long
char
short
int
float
double
enum
sc_bigint
sc_biguint
sc_int
sc_uint
sc_signed
sc_unsigned
176
Window Reference
Memory List Window
Table 4-41. Memory Identification (cont.)
VHDL
Verilog/SystemVerilog
SystemC
Scope:
Recognizable
in
•
•
•
architecture
process
record
•
•
•
•
•
•
module
interface
package
compilation unit
struct
static variables within a
• task
• function
• named block
• class
•
sc_module
Array Kind
•
•
single-dimensional
multi-dimensional
•
any combination of
unpacked, dynamic and
associative arrays3
real/shortreal
float
•
•
single-dimensional
multi-dimensional
•
•
1. The element can be "bit" or "std_ulogic" if the array has dimensionality >= 2.
2. These enumerated types must have at least one enumeration literal that is not a character literal. The listed
width is the number of entries in the enumerated type definition and the depth is the size of the array itself.
3. Any combination of unpacked, dynamic, and associative arrays is considered a memory, provided the leaf
level of the data structure is a string or an integral type.
Accessing
Access the window using either of the following:
•
•
Menu item: View > Memory List
Command: view memory list
ModelSim SE GUI Reference Manual, v10.2c
177
Window Reference
Memory List Window
Figure 4-44. Memory LIst Window
Memory List Window Tasks
This section describes tasks for using the Memory List window.
Viewing Packed Arrays
By default, packed dimensions are treated as single vectors in the Memory List window. To
expand packed dimensions of packed arrays, select Memories > Expand Packed Memories.
To change the permanent default, edit the PrefMemory(ExpandPackedMem) variable. This
variable affects only packed arrays. If the variable is set to 1, the packed arrays are treated as
unpacked arrays and are expanded along the packed dimensions such that they appear as a
linearized bit vector. Refer to the section “Simulator GUI Preferences” for details on setting
preference variables.
Viewing Memory Contents
When you double-click an instance on the Memory List window, ModelSim automatically
displays a Memory Data window, where the name used on the tab is taken from the name of the
instance, as seen in the Memory window. You can also enter the command add mem
<instance> at the vsim command prompt.
Viewing Multiple Memory Instances
You can view multiple memory instances simultaneously. A Memory Data window appears for
each instance you double-click in the Memory List window. When you open more than one
178
ModelSim SE GUI Reference Manual, v10.2c
Window Reference
Memory List Window
window for the same memory, the name of the tab receives an numerical identifier after the
name, such as “(2)”.
Saving Memory Formats in a DO File
You can save all open memory instances and their formats (for example, address radix, data
radix, and so forth) by creating a DO file.
1. Select the Memory List window
2. Select File > Save Format
displays the Save Memory Format dialog box
3. Enter the file name in the “Save memory format” dialog box
By default it is named mem.do. The file will contain all open memory instances and their
formats.
To load it at a later time, select File > Load.
Saving Memories to the WLF File
By default, memories are not saved in the WLF file when you issue a "log -r /*" command. To
get memories into the WLF file you will need to explicitly log them. For example:
log /top/dut/i0/mem
It you want to use wildcards, then you will need to remove memories from the WildcardFilter
list. To see what is currently in the WildcardFilter list, use the following command:
set WildcardFilter
If "Memories" is in the list, reissue the set WildcardFilter command with all items in the list
except "Memories." For details, see Using the WildcardFilter Preference Variable.
Note
For post-process debug, you can add the memories into the Wave or List windows but the
Memory List window is not available.
GUI Elements of the Memory List Window
This section describes GUI elements specific to this Window.
ModelSim SE GUI Reference Manual, v10.2c
179
Window Reference
Memory List Window
Column Descriptions
Table 4-42. Memory List Window Columns
Column Title
Description
Instance
Hierarchical name of the memory
Range
Memory range
Depth
Memory depth
Width
Word width
Popup Menu
Right-click anywhere in the window to display the popup menu and select one of the following
options:
Table 4-43. Memory List Popup Menu
180
Popup Menu Item
Description
View Contents
Opens a Memory Data window for the selected
memory.
Memory Declaration
Opens a Source window to the file and line number
where the memory is declared.
Compare Contents
Allows you to compare the selected memory against
another memory in the design or an external file.
Import Data Patterns
Allows you to import data patterns into the selected
memory through the Import Memory dialog box.
Export Data Patterns
Allows you to export data patterns from the selected
memory through the Export Memory dialog box.
ModelSim SE GUI Reference Manual, v10.2c
Window Reference
Memory List Window
Memory List Menu
This menu becomes available in the Main menu when the Memory List window is active.
Table 4-44. Memories Menu
Popup Menu Item
Description
View Contents
Refer to items in the Memory List Popup Menu
Memory Declaration
Compare Contents
Import Data Patterns
Export Data Patterns
Expand Packed Memories
Toggle the expansion of packed memories.
Identify Memories Within
Cells
Toggle the identification of memories within Verilog
cells.
Show VHDL String as
Memory
Toggle the identification of VHDL strings as
memories.
ModelSim SE GUI Reference Manual, v10.2c
181
Message Viewer Window
Use this window to easily access, organize, and analyze any Note, Warning, Error or other
elaboration and runtime messages written to the transcript during the simulation run.
Window Reference
Prerequisites
By default, the tool writes transcripted messages during elaboration and runtime only to the
transcript. To write messages to the WLF file (thus the Message Viewer window), use the
-displaymsgmode and -msgmode options with the vsim commmand to change the default
behavior. By writing messages to the WLF file, the Message Viewer window is able to organize
the messages for your analysis during the current simulation as well as during post simulation.
You can control what messages are available in the transcript, WLF file, or both with the
following switches:
•
displaymsgmode messages — User generated messages resulting from calls to Verilog
Display System Tasks and PLI/FLI print function calls. By default, these messages are
written only to the transcript, which means you cannot access them through the Message
Viewer window. In many cases, these user generated messages are intended to be output
as a group of transcripted messages, thus the default of transcript only. The Message
Viewer treats each message individually, therefore you could lose the context of these
grouped messages by modifying the view or sort order of the Message Viewer.
To change this default behavior you can use the -displaymsgmode argument with the
vsim command. The syntax is:
vsim -displaymsgmode {both | tran | wlf}
You can also use the displaymsgmode variable in the modelsim.ini file.
The message transcribing methods that are controlled by -displaymsgmode include:
Verilog Display System Tasks — $write, $display, $monitor, and $strobe. The
following also apply if they are sent to STDOUT: $fwrite, $fdisplay, $fmonitor, and
$fstrobe.
FLI Print Function Calls — mti_PrintFormatted and mti_PrintMessage.
PLI Print Function Calls — io_printf and vpi_printf.
SystemC Macros — SC_REPORT_INFO, SC_REPORT_WARNING,
SC_REPORT_ERROR, and SC_REPORT_FATAL.
•
msgmode messages — All elaboration and runtime messages not part of the
displaymsgmode messages. By default, these messages are written only to the transcript.
To change this default behavior you can use the -msgmode argument with the vsim
command. The syntax is:
vsim -msgmode {both | tran | wlf}
ModelSim SE GUI Reference Manual, v10.2c
182
Window Reference
Message Viewer Window
To write messages to the WLF file and transcript, which provides access to the messages
through the Message Viewer window, you can also use the msgmode variable in the
modelsim.ini file.
Accessing
Access the window using either of the following:
•
•
Menu item: View > Message Viewer and select a loaded WLF dataset for viewing
Command: view msgviewer <dataset>.wlf
Figure 4-45. Message Viewer Window
Message Viewer Window Tasks
Figure 4-46 and Table 4-45 provide an overview of the Message Viewer and several tasks you
can perform.
ModelSim SE GUI Reference Manual, v10.2c
183
Window Reference
Message Viewer Window
Figure 4-46. Message Viewer Window — Tasks
Table 4-45. Message Viewer Tasks
Icon Task
Action
1
Display a detailed description of the
message.
Right-click the message text
then select View Verbose
Message.
Open message in Source window
Double-click the message in the
Message Column.
Expand a hierarchical node
Double-click on a non-leaf node
in the Messages column.
2
Open the source file and add a bookmark to Double-click the object name(s).
the location of the object(s).
3
Change the focus of the Structure and
Objects windows.
4
Open the source file and set a marker at the Double-click the file name.
line number.
Double-click the hierarchical
reference.
GUI Elements of the Message Viewer Window
This section describes the GUI elements specific to this window.
184
ModelSim SE GUI Reference Manual, v10.2c
Window Reference
Message Viewer Window
Column Descriptions
Table 4-46. Message Viewer Window Columns
Column
Description
Assertion Expression
Assertion expression associated with the message
Assertion Filename
Name of the file where the assertion failure message originated
Assertion Line Number
Line number within the filename where the message originated
Assertion Name
Name of the assertion associated with the message
Assertion Start Time
Start time of the assertion associated with the message
Category
Keyword for the various categories of messages:
• DISPLAY
• FLI
• PA
• PLI
• SDF
• TCHK
• VCD
• VITAL
• WLF
• MISC
• <user-defined>
Comment
User comment
Compulsory
Whether an item was in a compulsory (required) test for ranking
Count
Date the test was run (in UCDB format)
CPU Time
Total CPU time consumed
Date
Date the test was run
File Info
Filename related to the cause of the message, and in some cases
the line number in parentheses
Host OS
Operating system in use by the host on which the test was run
Hostname
Name of host (server) on which the test was run
instance
Instance or region associated with the message
Iteration/Delta
Iteration (delta) in which the message occurs
LOG name
Name (path) to the generated log/transcript file
MEMUSAGE
Total memory used by the simulator for the test
Message
Organized tree-structure of the sorted messages, as well as, when
expanded, the text of the messages.
Message ID
Message ID
ModelSim SE GUI Reference Manual, v10.2c
185
Window Reference
Message Viewer Window
Table 4-46. Message Viewer Window Columns (cont.)
Column
Description
Message ID Name
Message ID name
Objects
Object(s) related to the message, if any.
Process
Process or leaf associated with the message
Region
Hierarchical region related to the message, if any
run CWD
Directory in which the test was run
Seed
Random seed
Severity
Message severity, such as Warning, Note or Error.
Sim Time
Total simulation time
sim Timeunits
Timeunit used by the simulation
Source File Name
Name of the file where the message originated
Source File Number
Declaration number of the file associated with the message
Source Line Number
Line number within "filename" where the message originated
Test Args
Application command used to generate the coverage data if the
data was not generated by vsim, similar to how Vsim Args
operates for vsim commands
Test Name
Name of the test
Test Status
Completion status (OK, Error, etc.)
Time
Time of simulation when the message was issued.
Timing Check Kind
Information about timing checks
UCDB Filename
Name of the UCDB file from which the test was imported
User ID
Username under which the test was run
Verbosity
Verbosity information from $messagelog system tasks.
VRM Context
Username under which the test was run
Vsim Args
Arguments passed to vsim command
WLF Filename
Name of WLF file from which message was imported
WLF Name
Name (path) to the generated WLF file
WLF Raw Time
Simulation time (in ticks) associated with the message
WLF Time Unit
Simulation time unit
186
ModelSim SE GUI Reference Manual, v10.2c
Window Reference
Message Viewer Window
Popup Menu
Right-click anywhere in the window to open a popup menu that contains the following
selections:
Table 4-47. Message Viewer Window Popup Menu
Popup Menu Item
Description
Reload Viewer Data
Opens a Source window for the file, and in some cases takes you
to the associated line number.
Opens selected item:
View
Verbose Message dialog box with details about message
• Verbose Message
Source code at line number where message is
• Message Source
Log file, in a Source window
• Log File
Object window, to view declarations
• Object Declarations
Assertion window, to view assertions
• Assertion Info
ATV, to view assertion threads
• ATV
Change environment
• Change Environment
Waveform window, opens:
• Waveform:
at time of selected message
• Go to Time in Wave
adds objects associated with selected message
• Add Objs to Wave
•
Analysis Questions
Opens Analysis Questions dialog box; used for saving and
managing specific queries of the data.
Filter Expressions
Opens Filter Expressions dialog; used for saving and managing
filters.
Hierarchy Configurations
Opens Hierarchy Configurations dialog box; used for saving and
managing particular hierarchy configurations of the data.
Column Layouts
Opens Configure Column Layout dialog; used for creating,
editing and managing the configuration of columns.
Show Titles in Hier
Column
Toggles on and off showing the titles within the hierarchy column
Global Options
Configures how/when Message Viewer opens.
Edit Transforms...
Opens a dialog which will open a transform rules file for editing
with the Transform Rule File Editor.
Load/Save Setup File
Loads/Saves a particular setup to a name you specify.
Expand/Collapse
Selected/All
Manipulates the expansion of the Messages column.
Related GUI Features
•
The Messages Bar in the Wave window provides indicators as to when a message
occurred.
ModelSim SE GUI Reference Manual, v10.2c
187
Window Reference
Message Viewer Window
Message Viewer Display Options Dialog Box
This dialog box allows you to control display options for the message viewer tab of the
transcript window.
•
Hierarchy Selection — This field allows you to control the appearance of message
hierarchy, if any.
Display with Hierarchy — enables or disables a hierarchical view of messages.
First by, Then by — specifies the organization order of the hierarchy, if enabled.
•
Time Range — Allows you to filter which messages appear according to simulation
time. The default is to display messages for the complete simulation time.
•
Displayed Objects — Allows you to filter which messages appear according to the
values in the Objects column. The default is to display all messages, regardless of the
values in the Objects column. The Objects in the list text entry box allows you to specify
filter strings, where each string must be on a new line.
Message Viewer Filter Expression Create Filter Dialog Box
The Message Viewer > Filter Expression > Create Filter dialog box allows you to create filter
rules that specify which messages should be shown in the message viewer. It contains a series of
dropdown and text entry boxes for creating the filter rules and supports the addition of
additional rule (rows) to create logical groupings.
From left to right, each filter rule is made up of the following:
•
Add and Remove buttons — either add a rule filter row below the current row or remove
that rule filter row.
•
Logic field — specifies a logical argument for combining adjacent rules. Your choices
are: AND, OR, NAND, and NOR. This field is greyed out for the first rule filter row.
•
Open Parenthesis field — controls rule groupings by specifying, if necessary, any open
parentheses. The up and down arrows increase or decrease the number of parentheses in
the field.
•
Column field — specifies that your filter value applies to a specific column of the
Message Viewer.
•
Inclusion field — specifies whether the Column field should or should not contain a
given value.
•
188
o
For text-based filter values your choices are: Contains, Doesn’t Contain, or Exact.
o
For numeric- and time-based filter values your choices are: ==, !=, <, <=, >, and >=.
Case Sensitivity field — specifies whether your filter rule should treat your filter value
as Case Sensitive or Case Insensitive. This field only applies to text-based filter values.
ModelSim SE GUI Reference Manual, v10.2c
Window Reference
Message Viewer Window
•
•
Filter Value field — specifies the filter value associated with your filter rule.
•
Closed Parenthesis field — controls rule groupings by specifying, if necessary, any
closed parentheses. The up and down arrows increase or decrease the number of
parentheses in the field.
Time Unit field — specifies the time unit. Your choices are: fs, ps, ns, us, ms. This field
only applies to the Time selection from the Column field.
Figure 4-47 shows an example where you want to show all messages, either errors or warnings,
that reference the 15th line of the file cells.v.
Figure 4-47. Message Viewer Filter Dialog Box
When you select OK or Apply, the Message Viewer is updated to contain only those messages
that meet the criteria defined in the Message Viewer Filter dialog box.
Also, when selecting OK or Apply, the Transcript window will contain an echo of the messages
setfilter command, where the argument is a Tcl definition of the filter. You can then cut/paste
this command for reuse at another time.
ModelSim SE GUI Reference Manual, v10.2c
189
Objects Window
Use this window to view the names and current values of declared data objects in the current
region, as selected in the Structure window. Data objects include:
Window Reference
•
•
•
•
•
•
•
•
•
signals
nets
registers
constants and variables not declared in a process
generics
parameters
transactions
SystemC member data variables
Questa Verification IP objects. Refer to the section “Questa Verification IP Objects in
the GUI” for more information.
Accessing
Access the window using either of the following:
•
•
•
Menu item: View > Objects
Command: view objects
Wave window: View Objects Window Button
Figure 4-48. Objects Window
ModelSim SE GUI Reference Manual, v10.2c
190
Window Reference
Objects Window
Objects Window Tasks
This section describes tasks for using the Objects window.
Interacting with Other Windows
1. Click an entry in the window to highlight that object in the Dataflow, Schematic, and
Wave windows.
2. Double-click an entry to highlights that object in a Source window
Setting Signal Radix
You can set the signal radix for a selected signal or signals in the Objects window as follows:
1. Click (LMB) a signal to select it or use Ctrl-Click Shift-Click to select a group of
signals.
2. Select Objects > Radix from the menu bar; or right-click the selected signal(s) and
select Radix from the popup menu.
This opens the Signal Radix dialog box (Figure 4-49), where you may select a radix.
This sets the radix for the selected signal(s) in the Objects window and every other
window where the signal appears.
Figure 4-49. Setting the Global Signal Radix from the Objects Window
Finding Contents of the Objects Window
You can filter the contents of the Objects window by either the Name or Value columns.
ModelSim SE GUI Reference Manual, v10.2c
191
Window Reference
Objects Window
1. Ctrl-F to display the Find box at the bottom of the window.
2. Click the “Search For” button and select the column to filter on.
3. Enter a string in the Find text box
4. Enter
Refer to the section “Find and Filter Functions” for more information.
Filtering Contents of the Objects Window
You can filter the contents of the Objects window by the Name column.
1. Ctrl-F to display the Find box at the bottom of the window.
2. Ctrl-M to change to “Contains” mode.
3. Enter a string in the Contains text box
The filtering will occur as you begin typing. You can disable this feature with Ctrl-T.
Filters are stored relative to the region selected in the Structure window. If you re-select a
region that had a filter applied, that filter is restored. This allows you to apply different filters to
different regions.
Refer to the section “Find and Filter Functions” for more information.
Filtering by Signal Type
The View > Filter menu selection allows you to specify which signal types to display in the
Objects window. Multiple options can be selected. Select Change Filter to open the Filter
Objects dialog, where you can select port modes and object types to be displayed.
Popup Menu
Right-click anywhere in the window to display the popup menu and select one of the following
options:
Table 4-48. Objects Window Popup Menu
Popup Menu Item
Description
View Declaration
Opens a Source window to the declaration of the
object
View Memory Contents
192
Add Wave
Adds the selected object(s) to the Wave window
Add Wave New
Creates a new instance of the Wave window and
adds the selected object(s) to that window.
ModelSim SE GUI Reference Manual, v10.2c
Window Reference
Objects Window
Table 4-48. Objects Window Popup Menu (cont.)
Popup Menu Item
Description
Add Dataflow
Adds the selected object(s) to a Dataflow window
Add to
Add the selected object(s) to any one of the
following: Wave window, List window, Log file,
Schematic window, Dataflow window. You may
choose to add only the Selected Signals, all Signals
in Region, all Signals in Design.
Event Traceback
Enables Causality Traceback
• Show Cause
• Show Driver
• Show Root Cause
• Show 'X' Cause (ChaseX)
Copy
Copies information about the object to the clipboard
Find
Opens the Find box
Insert Breakpoint
Adds a breakpoint for the selected object
Toggle Coverage
Control toggle coverage of the selected object(s).
Submenus allow the following options:
• Add - add to toggle coverage
• Extended - include as extended toggle coverage
• Enable - enable toggle coverage
• Disable - disable toggle coverage
• Reset - reset toggle coverage
Modify
Modify the selected object(s) by selecting one of the
following from the submenu:
• Force - opens Force Selected Signal dialog
• Remove Force - remove effect of force command
• Change Value - change value of selected
• Apply Clock - opens Define Clock dialog
• Apply Wave - opens Create Pattern Wizard
Radix
Opens Signal Radix dialog, allowing you to set the
radix of selected signal(s) in all windows
Show
Shows list of port types and object kinds that are
displayed. Includes a Change Filter selection that
opens the Filter Objects dialog, which allows you to
filter the display.
Viewing Toggle Coverage in the Objects Window
Toggle coverage data can be displayed in the Objects window in multiple columns, as shown in
Figure 4-50. Right-click the column title bar and select Show All Columns to make sure all
Toggle coverage columns are displayed. There is a column for each transition type.
ModelSim SE GUI Reference Manual, v10.2c
193
Window Reference
Objects Window
Figure 4-50. Objects Window - Toggle Coverage
GUI Elements of the Objects Window
This section describes GUI elements specific to this Window.
Current Time Label — Displays the Current Time or the Now (end of simulation)
time. This is the time used to control state values annotated in the window. (For details,
see Current Time Label.)
Column Descriptions
Table 4-49. Toggle Coverage Columns in the Objects Window
194
Column name
Description
Name
the name of each object in the current region
Value
the current value of each object
Kind
the object type
Mode
the object mode (internal, in, out, and so forth.)
1H -> 0L
the number of times each object has transitioned from a 1 or a
High state to a 0 or a Low state
0L -> 1H
the number of times each object has transitioned from a 0 or a
Low state to 1 or a High state
0L -> Z
the number of times each object has transitioned from a 0 or a
Low state to a high impedance (Z) state
Z -> 0L
the number of times each object has transitioned from a high
impedance state to a 0 or a Low state
1H -> Z
the number of times each object has transitioned from a 1 or a
High state to a high impedance state
ModelSim SE GUI Reference Manual, v10.2c
Window Reference
Objects Window
Table 4-49. Toggle Coverage Columns in the Objects Window (cont.)
Column name
Description
Z -> 1H
the number of times each object has transitioned from a high
impedance state to 1 or a High state
State Count
the number of values a state machine variable can have
State Hits
the number of state machine variable values that have been hit
State %
the current ration of State Hits to State Count
# Nodes
the number of scalar bits in each object
# Toggled
the number of nodes that have transitioned at least once. A
signal is considered toggled if and only if:
• it has 0- >1 and 1->0 transitions and NO Z transitions, or
• if there are ANY Z transitions, it must have ALL four of the
Z transitions.
Otherwise, the counts are place in % 01 or % Z columns.
For more specifics on what is considered “toggled”, see
“Understanding Toggle Counts”
% Toggled
the current ratio of the # Toggled to the # Nodes for each object
% 01
the percentage of 1H -> 0L and 0L -> 1H transitions that have
occurred (transitions in the first two columns)
% Full
the percentage of all transitions that have occurred (all six
columns)
%Z
the percentage of 0L -> Z, Z -> 0L, 1H -> Z, and Z -> 1H
transitions that have occurred (last four columns)
ModelSim SE GUI Reference Manual, v10.2c
195
Processes Window
Use this window to view a list of HDL and SystemC processes in one of four viewing modes:
Window Reference
Active — (default) active processes in your simulation.
In Region — process in the selected region.
Design — intended for primary navigation of ESL (Electronic System Level) designs
where processes are a foremost consideration.
Hierarchy — a tree view of any SystemVerilog nested fork-joins.
In addition, the data in this window will change as you run your simulation and processes
change states or become inactive.
Accessing
Access the window using either of the following:
•
•
Menu item: View > Process
Command: view process
Figure 4-51. Processes Window
Processes Window Tasks
This section describes tasks for using the Processes window.
Changing Your Viewing Mode
You can change the display to show all the processes in a region or in the entire design by doing
any one of the following:
•
•
•
Select Process > In Region, Design, Active, or Hierarchy.
Use the Process Toolbar
Right-click in the Process window and select In Region, Design, Active, or Hierarchy.
ModelSim SE GUI Reference Manual, v10.2c
196
Window Reference
Processes Window
The view mode you select is persistent and is “remembered” when you exit the simulation. The
next time you bring up the tool, this window will initialize in the last view mode used.
Filtering Processes
You can control which processes are visible in the Processes window as follows:
1. Right-click in the Processes window and select Display Options.
2. In the Process Display Options dialog box select the Type or States you want to include
or exclude from the window.
3. OK
When you filter the window according to specific process states, the heading of the State
column changes to “State (filtered)” as shown in Figure 4-52.
Figure 4-52. Column Heading Changes When States are Filtered
The default “No Implicit & Primitive” selection causes the Process window to display all
process types except implicit and primitive types. When you filter the display according to
specific process types, the heading of the Type column becomes “Type (filtered)”.
Once you select the options, data will update as the simulation runs and processes change their
states. When the In Region view mode is selected, data will update according to the region
selected in the Structure window.
Viewing the Full Path of the Process
By default, all processes are displayed without the full hierarchical context (path). You can
display processes with the full path by selecting Process > Show Full Path
Viewing Processes in Post-Processing Mode
This window also shows data in the post-processing (WLF view or Coverage view) mode. You
will need to log processes in the simulation mode to be able to view them in post-processing
mode.
In the post-processing mode, the default selection values will be same as the default values in
the live simulation mode.
Things to remember about the post-processing mode:
ModelSim SE GUI Reference Manual, v10.2c
197
Window Reference
Processes Window
•
There are no active processes, so the Active view mode selection will not show
anything.
•
•
All processes will have same ‘Done’ state in the post-processing mode.
There is no order information, so the Order column will show ‘-‘ for all processes.
Setting a Ready Process as the Next Active Process
You can select any “Ready” process and set it to be the next Active process executed by the
simulator, ahead of any other queued processes. To do this, simply right-click any “Ready”
process and select Set Next Active from the popup context menu.
When you set a process as the next active process, you will see “(Next Active)” in the Order
column of that process (Figure 4-53).
Figure 4-53. Next Active Process Displayed in Order Column
Creating Textual Process Report
You can create a textual report of all processes by using the process report command.
Figure 4-54. Sample Process Report in the Transcript Window
198
ModelSim SE GUI Reference Manual, v10.2c
Window Reference
Processes Window
GUI Elements of the Processes Window
This section describes GUI elements specific to this Window.
Column Descriptions
Table 4-50. Processes Window Column Descriptions
Column Title
Description
Name
Name of the process.
Class Info
SystemVerilog class object id or UVM
component name.
Order
Execution order of all processes in the
Active and Ready states. Refer to the
section “Process Order Description” for
more information.
Parent Path
Hierarchical parent pathname of the process
State
Process state. Refer to the section “Process
State Definitions” for more information.
Type
Process type, according to the language.
Refer to the section “Process Type
Definitions” for more information.
Process State Definitions
The process states reported under the State column heading are:
Idle — Indicates an inactive SystemC Method, or a process that has never been active.
The Idle state will occur only for SC processes or methods. It will never occur for HDL
processes.
Wait — Indicates the process is waiting for a wake up trigger (change in VHDL signal,
Verilog net, SystemC signal, or a time period).
Ready — Indicates the process is scheduled to be executed in current simulation phase
(or in active simulation queue) of current delta cycle.
Active – Indicates the process is currently active and being executed.
Queued — Indicates the process is scheduled to be executed in current delta cycle, but
not in current simulation phase (or in active simulation queue).
Done — Indicates the process has been terminated, and will never restart during current
simulation run.
ModelSim SE GUI Reference Manual, v10.2c
199
Window Reference
Processes Window
Processes in the Idle and Wait states are distinguished as follows. Idle processes (except for
ScMethods) have never been executed before in the simulation, and therefore have never been
suspended. Idle processes will become Active, Ready, or Queued when a trigger occurs. A
process in the Wait state has been executed before but has been suspended, and is now waiting
for a trigger.
SystemC methods can have one of the four states: Active, Ready, Idle or Queued. When
ScMethods are not being executed (Active), or scheduled (Ready or Queued), they are inactive
(Idle). ScMethods execute in 0 time, whenever they get triggered. They are never suspended or
terminated.
Process Type Definitions
The Type column displays the process type according to the language used. It includes the
following types:
•
•
•
•
•
•
•
•
•
•
Always
Assign
Final
Fork-Join (dynamic process like fork-join, sc_spawn, and so forth.)
Initial
Implicit (internal processes created by simulator like Implicit wires, and so forth.)
Primitive (UDP, Gates, and so forth.)
ScMethod
ScThread (SC Thread and SC CThread processes)
VHDL Process
Process Order Description
The Order column displays the execution order of all processes in the Active and Ready states
in the active kernel queue. Processes that are not in the Active or Ready states do not yet have
any order, in which case the column displays a dash (-). The Process window updates the
execution order automatically as simulation proceeds.
200
ModelSim SE GUI Reference Manual, v10.2c
Profiling Windows
Use these five windows to view performance or memory profiling information about your
simulation.
Window Reference
Calltree — Displays information in a hierarchical form that indicates the call order
dependencies of functions or routines.
Design Units — Displays information aggregated for the different design units.
Ranked — Displays information for each function or instance.
Structural — Displays information aggregated for different instances.
Profile Details — Displays detailed profiling information based on selections in the
other Profile Windows
Prerequisites
You must have enabled performance or memory profiling. Refer to the chapter “Profiling
Performance and Memory Use” for more information.
Accessing
Access the Profile Calltree window using either of the following:
•
•
Menu item: View > Profiling > Call Tree Profile
Command: view calltree
Figure 4-55. Profile Calltree Window
Access the Profile Design Unit window using either of the following:
•
Menu item: View > Profiling > Design Unit Profile
ModelSim SE GUI Reference Manual, v10.2c
201
Window Reference
Profiling Windows
•
Command: view du
Figure 4-56. Profile Design Unit Window
Access the Profile Ranked window using either of the following:
•
•
Menu item: View > Profiling > Ranked Profile
Command: view ranked
Figure 4-57. Profile Ranked Window
Access the Profile Structural window using either of the following:
•
•
202
Menu item: View > Profiling > Structural Profile
Command: view structural
ModelSim SE GUI Reference Manual, v10.2c
Window Reference
Profiling Windows
Figure 4-58. Profile Structural Window
Access the Profile Structural window using either of the following:
•
•
Menu item: View > Profiling > Profile Details
Command: view profiledetails
Figure 4-59. Profile Details Window
GUI Elements of the Profile Windows
This section describes GUI elements specific to this Window.
ModelSim SE GUI Reference Manual, v10.2c
203
Window Reference
Profiling Windows
Column Descriptions
Table 4-51. Profile Calltree Window Column Descriptions
204
Column Title
Description
%Parent
lists the ratio, as a percentage, of the samples collected during
the execution of a function or instance to the samples collected
in the parent function or instance.
(Not available in the Profile Ranked window.)
Count
(Only available in the Profile Design Unit window.)
In%
lists the ratio (as a percentage) of the total samples collected
during a function or instance.
In(raw)
lists the raw number of Profiler samples collected during a
function or instance.
MemIn
lists the amount of memory allocated to a function or instance.
MemIn(%)
lists the ratio (as a percentage) of the amount of memory
allocated to a function or instance to the total memory available.
MemUnder
lists the amount of memory allocated to a function, including all
support routines under that function; or, the amount of memory
allocated to an instance, including all instances beneath it in the
structural hierarchy.
MemUnder(%)
lists the ratio (as a percentage) of the amount of memory
allocated to a function and all of its support routines to the total
memory available; or, the ratio of the amount of memory
allocated to an instance, including all instances beneath it in the
structural hierarchy, to the total memory available.
Name
lists the parts of the design for which profiling information was
captured.
sum(MemIn(%))
lists the ratio of the cumulative memory allocated.
(Only available in the Profile Ranked and Profile Design Unit
windows.)
sum(MemIn)
lists the cumulative memory allocated.
(Only available in the Profile Ranked and Profile Design Unit
windows.)
Under (raw)
lists the raw number of Profiler samples collected during the
execution of a function, including all support routines under that
function; or, the number of samples collected for an instance,
including all instances beneath it in the structural hierarchy.
ModelSim SE GUI Reference Manual, v10.2c
Window Reference
Profiling Windows
Table 4-51. Profile Calltree Window Column Descriptions (cont.)
Column Title
Description
Under(%)
lists the ratio (as a percentage) of the samples collected during
the execution of a function and all support routines under that
function to the total number of samples collected; or, the ratio of
the samples collected during an instance, including all instances
beneath it in the structural hierarchy, to the total number of
samples collected.
ModelSim SE GUI Reference Manual, v10.2c
205
Schematic Window
The Schematic window provides two views of the design — a Full View, which is a structural
overview of the design; and an Incremental View, which uses Click-and-Sprout actions to
incrementally add to the selected net's fanout. The Incremental view displays the logical gate
equivalent of the RTL portion of the design, making it easier to understand the intent of the
design. (For additional information, please refer to the Schematic Window chapter.)
Window Reference
A “View:” indicator is displayed in the top left corner of the window (Figure 4-60). You can
toggle back and forth between views by simply clicking this “View:” indicator.
Figure 4-60. Schematic View Indicator
The Incremental View is ideal for design debugging. It allows you to explore design
connectivity by tracing signal readers/drivers to determine where and why signals change
values at various times.
The Full View is a more static view that can be dynamically linked to your selections in other
windows with the “Follow” selection.
For information about using this window with a Power Aware simulation, refer to the section
"Power Aware Schematic Display" in the Power Aware Simulation User’s Manual.
Prerequisites
To create the necessary data to display the schematic you must:
•
use the +acc switch with the vopt command to provide accessibility into the design for
debugging; and use the -debugdb switch with the vopt command to collect
combinatorial and sequential logic data into the work library
Note
The +acc option supports selective visibility into your design in order to reduce the size
of the debugging database. For example, if your testbench has an instance called
“instDut” of the design under test, you can use vopt -debugdb +acc+'/instDut' to generate
a debug database for only that instance.
•
•
use the -debugdb switch with the vsim command to create the debug database
log the results
ModelSim SE GUI Reference Manual, v10.2c
206
Window Reference
Schematic Window
For example, if you have a Verilog design with a top level module named top.v you would do
the following:
vlib work
vlog *.v
vopt +acc top -o top_opt -debugdb
vsim -debugdb top_opt
log -r /*
Accessing
Access the window using either of the following:
•
Menu item: View > Schematic or Add > To Schematic
The Add > To Schematic menu options change dynamically based on which debug
window is currently active.
•
Command: view schematic or add schematic [-incr | -full] <design_unit_name>
If -incr or -full is not provided with the add schematic command, the design unit will be
added to the currently active Schematic view mode.
Figure 4-61. Schematic Window
Schematic Window Tasks
This section describes tasks for using the Schematic window.
ModelSim SE GUI Reference Manual, v10.2c
207
Window Reference
Schematic Window
Adding Objects to the Incremental View
You can use any of the following methods to add objects to the Incremental View of the
Schematic window:
•
Drag and drop objects from other windows. Both nets and instances may be dragged and
dropped. Dragging an instance will result in the addition of all nets connected to that
instance. When an object is dragged and dropped into the Incremental view, the add
schematic command will be reflected in the Transcript window.
•
Use the Add > To Schematic menu options:
Selected Signals — Display selected signals
Signals in Region — Display all signals from the current region.
Signals in Design — Clear the window and display all signals from the entire
design.
•
Select the object(s) you want placed in the Schematic Window, then click-andhold the Add Selected to Window Button in the Standard Toolbar and select Add
to Schematic.
•
Use the add schematic command.
Navigating in the Schematic Window
You can use the mouse to navigate and select items within the Schematic window. The
following descriptions are based on the Select mouse mode (as set by the Schematic > Mouse
Mode menu).
•
Strokes with the middle mouse button:
Up — Move up in the hierarchy (does nothing when you are already at the top level)
Down — Move down in the hierarchy to the selected instance or the instance from
which you began the stroke.
Up/Left — Zoom full.
Down/Left — Zoom in on any selected items.
Up/Right — Zoom out. The factor of the zoom changes depending on the length of the
stroke.
Down/Right — Zoom area. The box indicates your desired zoom view.
•
Zoom in and out with the mouse scroll wheel.
The view will zoom and center on your mouse location.
•
208
Selecting objects with the left mouse button:
ModelSim SE GUI Reference Manual, v10.2c
Window Reference
Schematic Window
Your selection is also reflected in the Structure, Objects, and Wave windows.
Single click — highlights selected objects.
Double click — opens a Code Preview window with the source code of the selected
item highlighted.
Figure 4-62. Code Preview Window
Click and drag — selects all objects within the bounding box.
Shift-click — highlights multiple selected objects.
The alternate mouse modes affect the above mouse controls as follows:
•
Schematic > Mouse Mode > Zoom Mode
Left mouse button — Single click selects items, click and drag performs zoom
actions.
Middle mouse button — click and drag pans the schematic view.
•
Schematic > Mouse Mode > Pan Mode
Left mouse button — Single click selects items, click and drag pans the schematic
view.
Middle mouse button — click and drag performs zoom actions.
Controlling the Data Displayed in the Schematic Window
The schematic window provides additional control over the amount and type of information
displayed, depending on whether you are using the Incremental View or the Full View. Display
options are available by selecting Schematic > Preferences from the Main menu when the
Schematic window is active.
ModelSim SE GUI Reference Manual, v10.2c
209
Window Reference
Schematic Window
Display Options
When the Incremental view is active the Schematic > Preferences menu selection opens the
Incremental Schematic Options dialog (Figure 4-63). The dialog is the same when the Full view
is active and Schematic > Preferences is selected, only the title is changed.
Figure 4-63. Incremental Schematic Options Dialog
The Show section of the dialog provides the following options when the boxes are
checked:
Instance names — Show instance names for architectures, modules, processes, etc.
Bus ripper indices — Show ripper indices for busses.
Pin names — Show pin names in the architectures, modules, processes, etc.
210
ModelSim SE GUI Reference Manual, v10.2c
Window Reference
Schematic Window
Design Unit names — Show design unit names for architectures, modules,
processes, etc.
Signal values — Show signal values annotated onto the nets. Signal values are
based on the “current time”– which is set by the active cursor in the Wave window
or the Current Time Label in the Source or Schematic windows.
Cell contents — Show the internals of a library cell (`celldefine or VITAL).
Note
Changing this Hierarchy option causes the Schematic window to be erased.
Current Time Label — Displays the Current Time or the Now (end of simulation)
time. This is the time used to control state values annotated in the window. (For
details, see Current Time Label.)
Figure 4-64. Current Time Label in the Schematic Window
Redundant buffers — Display redundant buffers.
Redundant inverters — Displays redundant inverters.
Net Names — Show all net names:
Wire corner — Displays net names at or near wire corners.
Window Edge— Displays net names only if net extends past the edge of the
window.
The Net Expansion section of the dialog controls whether control logic is followed
when doing an Expand To Fanin/Fanout:
Max gate limit — Specifies the maximum number of gates the fanin/fanout should
go through before stopping. The default value is 1024.
ModelSim SE GUI Reference Manual, v10.2c
211
Window Reference
Schematic Window
Max hierarchy limit — specifies the maximum number of hierarchy levels the
fanin/fanout should go through before stopping. The default value is 32.
Click the Information button at the bottom left corner to get option descriptions when
you mouse over the option.
p
GUI Elements of the Schematic Window
This section describes GUI elements specific to this Window.
Popup Menu for Both Incremental and Full Views
Right-click anywhere in the Incremental View to display the popup menu and select one of the
following options:
Table 4-52. Schematic Window Popup Menu
Popup Menu Item
Selection
Description
View Selection
Declaration
Opens a Source window to the line of code where
the object is declared.
Applies only to modules. Opens a Source window
to the line of code where the module is
instantiated.
Displays the selected item in the FSM Viewer.
Displays selected signals in embedded Wave
viewer
Erase contents of current Incremental view and
redraw only selected object
Redraw selected object(s) in Incremental View of
new Schematic window
Instantiation
FSM Viewer
Wave Pane
This Window
New Window
Zoom
Fold/Unfold
212
Zoom In
Zoom Out
Zoom Full
Zoom Selected
Zoom Highlight
Zoom in 2x
Zoom out 2x
Zoom so all objects fits into display,
Zoom into the selected object
Zoom into the highlighted object.
Hides or shows the contents of selected instance
or abstract block. Displays folded instance or
abstract block as a solid blue box with dashed
border.
ModelSim SE GUI Reference Manual, v10.2c
Window Reference
Schematic Window
Table 4-52. Schematic Window Popup Menu (cont.)
Popup Menu Item
Selection
Description
Expand Net To
Drivers
Readers
Drivers & Readers
Fanins
Fanouts
Fanins & Fanouts
Design Inputs
Hierarchy Inputs
Displays all drivers , readers, fanins, fanouts,
design inputs and hierarchy inputs of the selected
net.
Event Traceback
Show Driver
Traces to the immediate driving process of the
selected signal at the current time
Traces to the first sequential process that drives
the selected signal at the current time
Traces to the root cause of the selected signal at
the current time
Traces to the root of an unknown value (X)
Show Cause
Show Root Cause
Show ‘X’ Cause
(ChaseX)
Show All Possible
Drivers
View Path Times
Trace to Driving
Event
Start Trace from
End Time
Start Trace from
Begin Time
Highlight
Add
Remove
Remove All
Add
Add All Signals to
Wave
Add to Wave
Add to Schematic
Add to Dataflow
Add to List
Add to Watch
ModelSim SE GUI Reference Manual, v10.2c
Highlights drivers in the Source window and lists
possible drivers
Highlights any selected objects with color you
select
Removes highlight color from selected objects
Removes all highlight colors from display
Adds all signals in schematic to the Wave window
Adds selected signal to Wave window
Adds selected signal to Current window or New
window
Adds selected signal to Dataflow window
Adds selected signal to List window
Adds selected signal to Watch window
213
Window Reference
Schematic Window
Table 4-52. Schematic Window Popup Menu (cont.)
Popup Menu Item
Selection
Description
Edit
Global Signal
Radix
Undo
Redo
Cut
Copy
Paste
Delete
Select Highlighted
Select All
Unselect All
Regenerate Layout
Delete All
Chages radix for all displayed signals in
Schematic window
Undo previous action
Redo undone action
Cut selected
Copy selected
Paste selected
Delete selected
Make highlighted objects the selected objects
Select all objects in display
Unselect all objects in display
Regenerates display to improve layout
Deletes everything from Schematic window
Find
Opens the Search Bar (at bottom of window) in
the Find mode to make searching for objects
easier, especially with large designs.
Save
Saves everything in Schematic, including sticky
notes to a .sch file
Restore
Current Window
New Window
Restores saved .sch file to the current window or
to a new window. If Current Window is selected,
the saved .sch file overwrites existing
information.
Sticky Note
Add
Adds sticky note (annotation) to selected net or
component
Removes sticky note from selected item
Hides or unhides sticky note for selecte item
Hides or unhides all sticky notes
Remove
Hide/Unhide
Hide/Unhide All
Show
214
Shows or hides unconnected pins in folded
instances
Display instance names when checked
Instance Names
Display net names when checked
Net Names
Display bus ripper indices when checked
Net Rip Index
Display pin names when checked
Pin Names
Design Unit Names Display design unit names when checked
Display signal values when checked
Signal Values
Display all of the above
Show All
Hide all of the above
Hide All
Unconnected Pins
ModelSim SE GUI Reference Manual, v10.2c
Source Window
The Source window allows you to view and edit source files as well as set breakpoints, step
through design files, and view code coverage statistics.
Window Reference
By default, the Source window displays your source code with line numbers. You may also see
the following graphic elements:
Red line numbers — denote executable lines, where you can set a breakpoint
Blue arrow — denotes the currently active line or a process that you have selected in
the Processes Window
Red ball in line number column — denotes file-line breakpoints; gray ball denotes
breakpoints that are currently disabled
Blue flag in line number column — denotes line bookmarks
Language Templates pane — displays templates for writing code in VHDL, Verilog,
SystemC, Verilog 95, and SystemVerilog (Figure 4-65). See Language Templates.
Figure 4-65. Source Window Showing Language Templates
Underlined text — denotes a hypertext link that jumps to a linked location, either in the
same file or to another Source window file. Display is toggled on and off by the Source
Navigation button.
ModelSim SE GUI Reference Manual, v10.2c
215
Window Reference
Source Window
Current Time Label — Displays the Current Time or the Now (end of simulation)
time. This is the time used to control state values annotated in the window. (For details,
see Current Time Label.)
Also, you will see various code coverage indicator icons (see “Coverage Data in the Source
Window” for details):
Green check mark — denotes statements, branches (true), or expressions in a particular
line that have been covered.
Red X with no subscripts — denotes that multiple kinds of coverage on the line are not
covered.
Red X with subscripts — denotes a statement, branch (false or true), condition or
expression was not covered.
Green E with no subscripts — denotes a line of code to which active coverage
exclusions have been applied. Every item on line is excluded; none are hit.
Green E with subscripts — denotes a line of codes with various degrees of exclusion.
Opening Source Files
You can open source files using the File > Open command or by clicking the Open icon.
Alternatively, you can open source files by double-clicking objects in other windows. For
example, if you double-click an item in the Objects window or in the structure tab (sim tab), the
underlying source file for the object will open in the Source window and scroll to the line where
the object is defined.
From the command line you can use the edit command.
By default, files you open from within the design (such as when you double-click an object in
the Objects window) open in Read Only mode. To make the file editable, right-click in the
Source window and select (uncheck) Read Only. To change this default behavior, set the
PrefSource(ReadOnly) variable to 0. See Simulator GUI Preferences for details on setting
preference variables.
Displaying Multiple Source Files
By default each file you open or create is marked by a window tab, as shown in the graphic
below.
216
ModelSim SE GUI Reference Manual, v10.2c
Window Reference
Source Window
Figure 4-66. Displaying Multiple Source Files
Dragging and Dropping Objects into the Wave and List
Windows
ModelSim allows you to drag and drop objects from the Source window to the Wave and List
windows. Double-click an object to highlight it, then drag the object to the Wave or List
window. To place a group of objects into the Wave and List windows, drag and drop any section
of highlighted code. When an object is dragged and dropped into the Wave window, the add
wave command will be reflected in the Transcript window.
Setting your Context by Navigating Source Files
When debugging your design from within the GUI, you can change your context while
analyzing your source files. Figure 4-67 shows the pop-up menu the tool displays after you
select then right-click an instance name in a source file.
ModelSim SE GUI Reference Manual, v10.2c
217
Window Reference
Source Window
Figure 4-67. Setting Context from Source Files
The title bar of the Source window displays your current context, parenthetically, after the file
name and location. This changes as you alter your context, either through the pop-up menu or
by changing your selection in the Structure window.
This functionality allows you to easily navigate your design for debugging purposes by
remembering where you have been, similar to the functionality in most web browsers. The
navigation options in the pop-up menu function as follows:
•
Open Instance — changes your context to the instance you have selected within the
source file. This is not available if you have not placed your cursor in, or highlighted the
name of, an instance within your source file.
If any ambiguities exists, most likely due to generate statements, this option opens a
dialog box allowing you to choose from all available instances.
•
Ascend Env — changes your context to the file and line number in the parent region
where the current region is instantiated. This is not available if you are at the top-level of
your design.
•
Forward/Back — allows you to change to previously selected contexts. This is not
available if you have not changed your context.
The Open Instance option is essentially executing an environment command to change your
context, therefore any time you use this command manually at the command prompt, that
information is also saved for use with the Forward/Back options.
218
ModelSim SE GUI Reference Manual, v10.2c
Window Reference
Source Window
Highlighted Text in a Source Window
The Source window can display text that is highlighted as a result of various conditions or
operations, such as the following:
•
•
•
Double-clicking an error message in the transcript shown during compilation
Using Event Traceback > Show Driver
Coverage-related operations.
In these cases, the relevant text in the source code is shown with a persistent highlighting. To
remove this highlighted display, choose More > Clear Highlights from the right-click popup
menu of the Source window. If the Source window is docked, you can also perform this action
by selecting Source > More > Clear Highlights from the Main menu. If the window is
undocked, select Edit > Advanced > Clear Highlights.
Note
Clear Highlights does not affect text that you have selected with the mouse cursor.
Example
To produce a compile error that displays highlighted text in the Source window, do the
following:
1. Choose Compile > Compile Options
2. In the Compiler Options dialog box, click either the VHDL tab or the Verilog &
SystemVerilog tab.
3. Enable Show source lines with errors and click OK.
4. Open a design file and create a known compile error (such as changing the word “entity”
to “entry” or “module” to “nodule”).
5. Choose Compile > Compile and then complete the Compile Source Files dialog box to
finish compiling the file.
6. When the compile error appears in the Transcript window, double-click on it.
7. The source window is opened (if needed), and the text containing the error is
highlighted.
8. To remove the highlighting, choose Source > More > Clear Highlights.
Hyperlinked (Underlined) Text in a Source Window
The Source window supports hyperlinked navigation, providing links displayed as underlined
text. To turn hyperlinked text on or off in the Source window, do the following:
ModelSim SE GUI Reference Manual, v10.2c
219
Window Reference
Source Window
1. Click anywhere in the Source window. This enables the display of the Simulate Toolbar.
2. Click the Source Navigation button.
When you double-click on hyperlinked text, the selection jumps from the usage of an object to
its declaration. This provides the following operations:
•
•
•
Jump from the usage of a signal, parameter, macro, or a variable to its declaration.
Jump from a module declaration to its instantiation, and vice versa.
Navigate back and forth between visited source files.
Coverage Data in the Source Window
The Source Window includes two columns for code coverage statistics – the Hits column and
the BC (Branch Coverage) column. These columns provide an immediate visual indication
about how your source code is executing. The code coverage indicator icons include check
marks, ‘X’s and ‘E’s. A description of each code coverage indicator icon is provided in
Table 4-53.
Figure 4-68. Coverage in Source Window
To see more information about any coverage item, click on the indicator icon, or in the Hits or
BC column for the line of interest. In the case of a multiple-line item, this would be last line of
220
ModelSim SE GUI Reference Manual, v10.2c
Window Reference
Source Window
the item. If the Coverage Details window is open, this brings up detailed coverage information
for that line. If the window is not open, a right click menu option is available to open it.
For example, when you select an expression in the Code Coverage Analysis’ Expression
Analysis window, and you click in the column of a line containing an expression, the associated
truth tables appear in the Coverage Details window. Each line in the truth table is one of the
possible combinations for the expression. The expression is considered to be covered (gets a
green check mark) if the entire truth table is covered.
When you hover over statements, conditions or branches in the Source window, the Hits and BC
columns display the coverage numbers for that line of code. For example, in Figure 4-68, the
blue highlighted line shows that the expression (b=b’b1) was hit 1 time. The value in the Hits
column shows the total coverage for all items in the truth table (as shown in the Coverage
Details window when you click the specific line in the hits column).
In the BC count column, only the "true" counts are given, with the exception of the AllFalse
branch (if any). The AllFalse count is given next to the first "if" condition in an if-else tree that
does not contain a terminating catch-all "else" branch. You can determine the branch false count
by subtracting counts in the BC column from the Hits column.
ModelSim SE GUI Reference Manual, v10.2c
221
Window Reference
Source Window
Source Window Code Coverage Indicator Icons
Table 4-53. Source Window Code Coverage Indicators
Icon
Description/Indication
All statements, branches (true), conditions, or expressions
on a particular line have been executed
Multiple kinds of coverage on the line were not executed
True branch not executed (BC column)
False branch not executed (BC column)
Condition not executed (Hits column)
Expression not executed (Hits column)
Branch not executed (Hits column)
Statement not executed (Hits column)
Indicates a line of code to which active coverage exclusions
have been applied. Every item on the line is excluded; none
are hit
Some excluded items are hit
Some items are excluded, and all items not excluded are hit
Some items are excluded, and some items not excluded
have missing coverage
Auto exclusions have been applied to this line. Hover the
cursor over the EA and a tool tip balloon appears with the
reason for exclusion
Coverage data presented in the Source window is either calculated “by file” or “by instance”, as
indicated just after the source file name. If coverage numbers are mismatched between Code
Coverage Analysis windows and the Source window, check to make sure that both are being
calculated the same — either “by file” or “by instance”.
To display only numbers in Hits and BC columns, select Tools > Code Coverage > Show
Coverage Numbers.
When the source window is active, you can skip to "missed lines" three ways:
222
ModelSim SE GUI Reference Manual, v10.2c
Window Reference
Source Window
•
select Edit > Previous Coverage Miss and Edit > Next Coverage Miss from the menu
bar
•
•
click the Previous zero hits and Next zero hits icons on the toolbar
press Shift-Tab (previous miss) or Tab (next miss)
Controlling Data Displayed in a Source Window
The Tools > Code Coverage menu contains several commands for controlling coverage data
display in a Source window.
Hide/Show coverage data — toggles the Hits column off and on.
Hide/Show branch coverage — toggles the BC column off and on.
Hide/Show coverage numbers — displays the number of executions in the Hits and BC
columns rather than check marks and Xs. When multiple statements occur on a single
line an ellipsis ("...") replaces the Hits number. In such cases, hover the cursor over each
statement to highlight it and display the number of executions for that statement.
Show coverage By Instance — displays only the number of executions for the currently
selected instance in the Main window workspace.
Debugging with Source Annotation
With source annotation you can interactively debug your design by analyzing your source files
in addition to using the Wave and Signal windows. Source annotation displays simulation
values, including transitions, for each signal in your source file. Figure 4-69 shows an example
of source annotation, where the red values are added below the signals.
ModelSim SE GUI Reference Manual, v10.2c
223
Window Reference
Source Window
Figure 4-69. Source Annotation Example
Turn on source annotation by selecting Source > Show Source Annotation or by right-clicking
a source file and selecting Show Source Annotation. Note that transitions are displayed only
for those signals that you have logged.
To analyze the values at a given time of the simulation you can either:
•
Show the signal values at the current simulation time. This is the default behavior. The
window automatically updates the values as you perform a run or a single-step action.
•
Show the signal values at current cursor position in the Wave window.
You can switch between these two settings by performing the following actions:
•
•
When Docked:
o
Source > Examine Now
o
Source > Examine Current Cursor
When Undocked:
o
Tools > Options > Examine Now
o
Tools > Options > Examine Current Cursor
You can highlight a specific signal in the Wave window by double-clicking on an annotation
value in the source file.
224
ModelSim SE GUI Reference Manual, v10.2c
Window Reference
Source Window
Accessing Textual Connectivity Information
The Source window contains textual connectivity information that allows you to explore the
connectivity of your design though the source code. This feature is especially useful when used
with source annotation turned on.
When you double-click an instance name in the Structure (sim) window, a Source window will
open at the appropriate instance. You can then access textual connectivity information in the
Source window by right-clicking any signal. This opens a popup menu that gives you the
choices shown in Figure Figure 4-70.
Figure 4-70. Popup Menu Choices for Textual Dataflow Information
•
The Event Traceback > Show Driver selection causes the Source window to jump to
the source code defining the driver of the selected signal. If the Driver is in a different
Source file, that file will open in a new Source window tab and the driver code will be
highlighted. You can also jump to the driver of a signal by simply double-clicking the
signal.
ModelSim SE GUI Reference Manual, v10.2c
225
Window Reference
Source Window
If there is more than one driver for the signal, a Multiple Drivers dialog will open
showing all driving processes (Figure 4-71).
Figure 4-71. Window Shows all Driving Processes
Select any driver to open the code for that driver.
•
The Show Readers selection opens the Source Readers window. If there is more than
one reader for the signal, all will be displayed (Figure 4-72).
Figure 4-72. Source Readers Dialog Displays All Signal Readers
Limitations
The Source window’s textual dataflow functions only work for pure HDL. It will not work for
SystemC or for complex data types like SystemVerilog classes.
Language Templates
ModelSim language templates help you write code. They are a collection of wizards, menus,
and dialogs that produce code for new designs, test benches, language constructs, logic blocks,
and so forth.
226
ModelSim SE GUI Reference Manual, v10.2c
Window Reference
Source Window
Note
The language templates are not intended to replace thorough knowledge of coding. They
are intended as an interactive reference for creating small sections of code. If you are
unfamiliar with a particular language, you should attend a training class or consult one of
the many available books.
To use the templates, either open an existing file, or select File > New > Source to create a new
file. Once the file is open, select Source > Show Language Templates if the Source window is
docked in the Main window; select View > Show Language Templates of the Source window
is undocked.
Figure 4-73. Language Templates
The template that appears depends on the type of file you create. For example Module and
Primitive templates are available for Verilog files, and Entity and Architecture templates are
available for VHDL files.
VHDL, Verilog, and SystemVerilog language templates display the following options:
a. New Design Wizard — Opens the Create New Design Wizard dialog. (Figure 4-74)
The New Design Wizard will step you through the tasks necessary to add a VHDL
Design Unit, or Verilog Module to your code.
b. Create Testbench — Opens the Create Testbench Wizard dialog.
The Create Testbench Wizard allows you to create a testbench for a previously
compiled design unit in your library. It generates code that instantiates your design
unit and wires it up inside a top-level design unit. You can add stimulus to your
testbench at a later time.
c. Language Constructs — Menu driven code templates you can use in your design.
Includes Modules, Primitives, Declarations, Statements and so on.
d. Stimulus Generators — Provides three interactive wizards:
ModelSim SE GUI Reference Manual, v10.2c
227
Window Reference
Source Window
•
Create Clock Wizard — Steps you through the tasks necessary to add a clock
generator to your code. It allows you to control a number of clock generation
variables.
•
Create Count Wizard — Helps you make a counter. You can specify various
parameters for the counter. For example, rising/falling edge triggered, reset
active high or low, and so on.
•
Create Simulation Stop Wizard — The simulation time at which you wish to end
your simulation run. This adds code that will stop the simulator at a specified
time.
The SystemC language template displays the following options:
a. New Design Wizard — Opens the Create New Design Wizard dialog for SystemC
source files. (Figure 4-74)
b. Language Constructs — A list of code templates you can use in your design.
Language Template Wizards
Double-click an object in the list to open the Create New Design Wizard. (Figure 4-74) Simply
follow the directions in the wizard to create a new block in your design.
Figure 4-74. Create New Design Wizard
Highlighted Code in Language Templates
Code inserted into your source contains a variety of highlighted fields. The example below
shows a module statement inserted from the Verilog template.
228
ModelSim SE GUI Reference Manual, v10.2c
Window Reference
Source Window
Figure 4-75. Language Template Context Menus
The highlighting indicates the following type of information must be entered:
Yellow — Requires user supplied data or string. For example, module_name in
Figure 4-75 must be replaced with the name of the module.
Green — Opens a drop-down context menu. Selections open more green and yellow
highlighted options.
Red — Opens a drop-down context menu. Selections here can affect multiple code
lines. Figure 4-75 shows the menu that appears when you double-click module_item
then select gate_instantiation.
Setting File-Line Breakpoints with the GUI
You can easily set file-line breakpoints in your source code by clicking your mouse cursor in the
line number column of a Source window. Click the left mouse button in the line number column
next to a red line number and a red ball denoting a breakpoint will appear (Figure 4-76).
ModelSim SE GUI Reference Manual, v10.2c
229
Window Reference
Source Window
Figure 4-76. Breakpoint in the Source Window
The breakpoint markers are toggles. Click once to create the breakpoint; click again to disable
or enable the breakpoint.
Note
When running in full optimization mode, breakpoints may not be set. Run the design in
non-optimized mode (or set +acc arguments) to enable you to set breakpoints in the
design. See Preserving Object Visibility for Debugging Purposes and Design Object
Visibility for Designs with PLI.
To delete the breakpoint completely, right click the red breakpoint marker, and select Remove
Breakpoint. Other options on the context menu include:
Disable Breakpoint — Deactivate the selected breakpoint.
Edit Breakpoint — Open the File Breakpoint dialog to change breakpoint arguments.
Edit All Breakpoints — Open the Modify Breakpoints dialog.
Run Until Here — Run the simulation from the current simulation time up to the
specified line of code. Refer to Run Until Here for more information.
Add/Remove Bookmark — Add or remove a file-line bookmark.
Adding File-Line Breakpoints with the bp Command
Use the bp command to add a file-line breakpoint from the VSIM> prompt.
For example:
230
ModelSim SE GUI Reference Manual, v10.2c
Window Reference
Source Window
bp top.vhd 147
sets a breakpoint in the source file top.vhd at line 147.
Editing File-Line Breakpoints
To modify (or add) a breakpoint according to the line number in a source file, do any one of the
following:
•
•
•
Select Tools > Breakpoints from the Main menu.
Right-click a breakpoint and select Edit All Breakpoints from the popup menu.
Click the Edit Breakpoints toolbar button. See Simulate Toolbar.
This displays the Modify Breakpoints dialog box shown in Figure 4-77.
ModelSim SE GUI Reference Manual, v10.2c
231
Window Reference
Source Window
Figure 4-77. Modifying Existing Breakpoints
The Modify Breakpoints dialog box provides a list of all breakpoints in the design. To modify a
breakpoint, do the following:
1. Select a file-line breakpoint from the list.
2. Click Modify, which opens the File Breakpoint dialog box shown in Figure 4-77.
3. Fill out any of the following fields to modify the selected breakpoint:
Breakpoint Label — Designates a label for the breakpoint.
232
ModelSim SE GUI Reference Manual, v10.2c
Window Reference
Source Window
Instance Name — The full pathname to an instance that sets an HDL or SystemC
breakpoint so it applies only to that specified instance.
Breakpoint Condition — One or more conditions that determine whether the
breakpoint is observed. If the condition is true, the simulation stops at the
breakpoint. If false, the simulation bypasses the breakpoint. A condition cannot refer
to a VHDL variable (only a signal). Refer to the tip below for more information on
proper syntax for breakpoints entered in the GUI.
Breakpoint Command — A string, enclosed in braces ({}) that specifies one or
more commands to be executed at the breakpoint. Use a semicolon (;) to separate
multiple commands.
Tip: All fields in the File Breakpoint dialog box, except the Breakpoint Condition field,
use the same syntax and format as the -inst switch and the command string of the bp
command. Do not enclose the expression entered in the Breakpoint Condition field in
quotation marks (“ ”). For more information on these command options, refer to the bp
command in the Questa SV/AFV Reference Manual.
4. Click OK to close the File Breakpoints dialog box.
5. Click OK to close the Modify Breakpoints dialog box.
Loading and Saving Breakpoints
The Modify Breakpoints dialog (Figure 4-77) includes Load and Save buttons that allow you to
load or save breakpoints.
Setting Conditional Breakpoints
In dynamic class-based code, an expression can be executed by more than one object or class
instance during the simulation of a design. You set a conditional breakpoint on the line in the
source file that defines the expression and specifies a condition of the expression or instance
you want to examine. You can write conditional breakpoints to evaluate an absolute expression
or a relative expression.
You can use the SystemVerilog keyword this when writing conditional breakpoints to refer to
properties, parameters or methods of an instance. The value of this changes every time the
expression is evaluated based on the properties of the current instance. Your context must be
within a local method of the same class when specifying the keyword this in the condition for a
breakpoint. Strings are not allowed.
The conditional breakpoint examples below refer to the following SystemVerilog source code
file source.sv:
Figure 4-78. Source Code for source.sv
ModelSim SE GUI Reference Manual, v10.2c
233
Window Reference
Source Window
1
2
3
4
5
6
7
8
9
10
11
12
13
14
15
16
17
18
19
20
21
22
23
24
25
26
27
28
29
30
31
32
33
34
35
36
37
class Simple;
integer cnt;
integer id;
Simple next;
function new(int x);
id=x;
cnt=0
next=null
endfunction
task up;
cnt=cnt+1;
if (next) begin
next.up;
end
endtask
endclass
module test;
reg clk;
Simple a;
Simple b;
initial
begin
a = new(7);
b = new(5);
end
always @(posedge clk)
begin
a.up;
b.up;
a.up
end;
endmodule
Prerequisites
Compile and load your simulation.
Note
You must use the +acc switch when optimizing with vopt to preserve visibility of
SystemVerilog class objects.
Setting a Breakpoint For a Specific Instance
Enter the following on the command line:
bp simple.sv 13 -cond {this.id==7}
234
ModelSim SE GUI Reference Manual, v10.2c
Window Reference
Source Window
Results
The simulation breaks at line 13 of the simple.sv source file (Figure 4-78) the first time module
a hits the expression because the breakpoint is evaluating for an id of 7 (refer to line 27).
Setting a Breakpoint For a Specified Value of Any Instance.
Enter the following on the command line:
bp simple.sv 13 -cond {this.cnt==8}
Results
The simulation evaluates the expression at line 13 in the simple.sv source file (Figure 4-78),
continuing the simulation run if the breakpoint evaluates to false. When an instance evaluates to
true the simulation stops, the source is opened and highlights line 13 with a blue arrow. The first
time cnt=8 evaluates to true, the simulation breaks for an instance of module Simple b. When
you resume the simulation, the expression evaluates to cnt=8 again, but this time for an instance
of module Simple a.
You can also set this breakpoint with the GUI:
1. Right-click on line 13 of the simple.sv source file.
2. Select Edit Breakpoint 13 from the drop menu.
3. Enter
this.cnt==8
in the Breakpoint Condition field of the Modify Breakpoint dialog box. (Refer to
Figure 4-77) Note that the file name and line number are automatically entered.
Checking Object Values and Descriptions
You can check the value or description of signals, indexes, macros, and other objects in the
Source window.There are two quick methods to determine the value and description of an
object:
•
Select an object, then right-click and select Examine or Describe from the context
menu.
•
Pause the cursor over an object to see an examine pop-up
ModelSim SE GUI Reference Manual, v10.2c
235
Window Reference
Source Window
Figure 4-79. Source Window Description
You can select Source > Examine Now or Source > Examine Current Cursor to choose at
what simulation time the object is examined or described.
You can also invoke the examine and/or describe commands on the command line or in a
macro.
Marking Lines with Bookmarks
Source window bookmarks are blue flags that mark lines in a source file. These graphical icons
may ease navigation through a large source file by highlighting certain lines.
As noted above in the discussion about finding text in the Source window, you can insert
bookmarks on any line containing the text for which you are searching. The other method for
inserting bookmarks is to right-click a line number and select Add/Remove Bookmark. To
remove a bookmark, right-click the line number and select Add/Remove Bookmark again.
To remove all bookmarks from the Source window, select Source > Clear Bookmarks from
the menu bar when the Source window is active.
Performing Incremental Search for Specific Code
The Source window includes a Find function that allows you to do an incremental
search for specific code. To activate the Find bar (Figure 4-80) in the Source window
select Edit > Find from the Main menus or click the Find icon in the Main toolbar. For
more information see Find and Filter Functions.
236
ModelSim SE GUI Reference Manual, v10.2c
Window Reference
Source Window
Figure 4-80. Source Window with Find Toolbar
Customizing the Source Window
You can customize a variety of settings for Source windows. For example, you can change
fonts, spacing, colors, syntax highlighting, and so forth. To customize Source window settings,
select Tools > Edit Preferences. This opens the Preferences dialog. Select Source Windows
from the Window List.
ModelSim SE GUI Reference Manual, v10.2c
237
Window Reference
Source Window
Figure 4-81. Preferences Dialog for Customizing Source Window
Select an item from the Category list and then edit the available properties on the right. Click
OK or Apply to accept the changes.
The changes will be active for the next Source window you open. The changes are saved
automatically when you quit ModelSim. See Setting Preference Variables from the GUI for
details.
238
ModelSim SE GUI Reference Manual, v10.2c
Structure Window
Use this window to view the hierarchical structure of the active simulation.
Window Reference
The name of the structure window, as shown in the title bar or in the tab if grouped with other
windows, can vary:
sim — This is the name shown for the Structure window for the active simulation.
dataset_name — The Structure window takes the name of any dataset you load through
the File > Datasets menu item or the dataset open command.
Viewing the Structure Window
By default, the Structure window opens in a tab group with the Library windows after starting a
simulation. You can also open the Structure window with the “View Objects Window Button”.
The hierarchical view includes an entry for each object within the design. When you select an
object in a Structure window, it becomes the current region.
By default, the coverage statistics displayed in the columns within the Structure window are
recursive. You can select to view coverage statistics for local instances by deselecting Code
Coverage > Enable Recursive Coverage Sums. Refer to “Coverage Aggregation in the
Structure Window” for details on coverage numbers.
The contents of several windows automatically update based on which object you select,
including the Source window, Objects window, Processes window, and Locals window. All
mouse button operations clear the current selection and select the item under the cursor.
Accessing
Access the window using any of the following:
•
•
•
Menu item: View > Structure
Command: view structure
Button: View Objects Window Button
ModelSim SE GUI Reference Manual, v10.2c
239
Window Reference
Structure Window
Figure 4-82. Structure Window
Structure Window Tasks
This section describes tasks for using the Structure window.
Using the Popup Menu
Right-click on an object in the Structure window to display the popup menu and select one of
the following options:
Table 4-54. Structure Window Popup Menu
240
Popup Menu Item
Description
View Declaration
Opens the source file and bookmarks the object.
View Instantiation
Opens the source file and bookmarks the object.
Add Wave
Adds the selected object(s) to the Wave window.
Add Wave New
Creates a new instance of the Wave window and
adds the selected object(s) to that window.
ModelSim SE GUI Reference Manual, v10.2c
Window Reference
Structure Window
Table 4-54. Structure Window Popup Menu (cont.)
Popup Menu Item
Description
Add Wave To
Opens a drop down list of Wave windows when
multiple windows exist. Adds the selected object(s)
to the selected Wave window.
Add Dataflow
Adds the selected object(s) to a Dataflow window.
Add to
Add the selected object(s) to any one of the
following: Wave window, List window, Log file,
Schematic window, Dataflow window. You may
choose to add only the Selected Signals, all Signals
in Region, all Signals in Design.
Copy
Copies the object instance path to the clipboard
Find
Opens the Search Bar (at bottom of window) in the
Find mode to make searching for objects easier,
especially with large designs.
Save Selected
Saves all hierarchy under the selected instance.
Expand Selected
Displays the hierarchy of the object recursively.
Collapse Selected
Closes the hierarchy of the object.
Collapse All
Collapses the hierarchy to the top instance.
Code Coverage >
These menu items are only available when you run
the simulation with the -coverage switch.
• Code Coverage Reports — Opens the Coverage
Text Report dialog
• Clear Code Coverage Data — Clears all code
coverage information collected during simulation
• Enable Recursive Coverage Sums — Displays
coverage data and graphs for each design object
or file, recursively: enabled by default
Test Analysis
When a UCDB file is selected, allows you to do the
following:
• Find Tests with Least Coverage
• Most Coverage
• Zero Coverage
• Non-Zero Coverage
• Rank Most Effective Tests...
• Summary...
XML Import Hint
Displays the XML Import Hint dialog box with
information about the Link Type and Name
ModelSim SE GUI Reference Manual, v10.2c
241
Window Reference
Structure Window
Table 4-54. Structure Window Popup Menu (cont.)
Popup Menu Item
Description
Show
Lists the design unit types that are currently
displayed.
• Processes
• Functions
• Packages
• Tasks
• Statement
• VPackages
• VITypedef
• SVClass
• Class Instances
• Capacity
• Change Filter
Display Source Code of a Structure Window Object
You can highlight the line of code that declares a given object in the following ways:
•
Double-click on an object — Opens the file in a new Source window, or activates the
file if it is already open.
•
Single-click on an object — Highlights the code if the file is already showing in an
active Source window.
Add Structure Window Objects to Other Windows
You can add objects from the Structure window to the Dataflow window, Schematic window,
List window, Watch window or Wave window in the following ways:
•
•
•
•
Mouse — Drag and drop
Menu Selection — Add > To window
Toolbar — Add Selected to Window Button > Add to window
Command — add list, add wave, or add dataflow
When you drag and drop objects from the Structure window to the Wave, Dataflow, or
Schematic windows, the add wave, add dataflow, and add schematic (respectively) commands
will be reflected in the Transcript window.
Finding Items in the Structure Window
To find items in the Structure window, press Ctrl-F on your keyboard with the Structure
window active. This opens the Find bar at the bottom of the window. Refer to Find and Filter
Functions section for details. As you type in the Find field, a popup window opens to display a
242
ModelSim SE GUI Reference Manual, v10.2c
Window Reference
Structure Window
list of matches (Figure 4-83). With 'Search While Typing' enabled (the default) each keypress
changes the pattern and restarts the search immediately.
Figure 4-83. Find Mode Popup Displays Matches
The Structure window Find bar supports hierarchical searching to limit the regions of a search.
The forward slash (/) character is used to separate the search words. A double slash (//) is used
to specify a recursive search from the double slash down the hierarchy. For example:
foo — search the entire design space for regions containing "foo" in the name.
foo?bar — search the entire design space for regions containing "foo" then any single
alphanumeric character, followed by "bar"
foo*bar — search the design for a name containing "foo", a string of zero or more
alphanumeric characters, followed by "bar. For example, to following names match a
search for "foo*bar": "foobar", "foo_fred_bar", and "fooIsAbar". "fooISbad" does not
match the search string.
/foo — search the top of the design hierarchy for regions containing "foo".
/foo/bar — search for regions containing "foo" at the top, and then regions containing
"bar".
/foo//bar — search for regions containing "bar" recursively below all top level regions
containing "foo".
To search for a name that contains the slash (/) character, escape the slash using a backslash (\).
For example: \/bar.
ModelSim SE GUI Reference Manual, v10.2c
243
Window Reference
Structure Window
When you double-click any item in the match list that item is highlighted in the Structure
window and the popup is removed. The search can be canceled by clicking on the ‘x’ button in
the popup window or by pressing the Esc key on your keyboard.
Filtering Structure Window Objects
You can control the types of information available in the Structure window through the View >
Filter menu items.
Processes — Implicit wire processes
Functions — Verilog and VHDL Functions
Packages — VHDL Packages
Tasks — Verilog Tasks
Statement — Verilog Statements
VlPackage — Verilog Packages
VlTypedef — Verilog Type Definitions
SVClass— SystemVerilog class instances
Cell Instances — Verilog cell instances or
VHDL architecture instance.
Capacity — Memory capacity design unit
Assertion — VHDL and Verilog assertions
Subprogram — VHDL procedures and
functions; Verilog functions and tasks
GUI Elements of the Structure Window
This section describes GUI elements specific to this Window. For a complete list of all columns
in the Structure window and a description of their contents, see Table 4-55.
244
ModelSim SE GUI Reference Manual, v10.2c
Window Reference
Structure Window
Column Descriptions
The table below lists columns in the Structure window with a description of their contents
(Table 4-55).
Table 4-55. Columns in the Structure Window
Column name
Description
Assertion hits
Assertion hits shows different counts based on whether the -assertdebug
is used:
• with -assertdebug argument to vsim command: number of assertions
whose pass count is greater than 0, and fail count is equal to 0.
• without -assertdebug: number of assertions whose fail count is equal
to 0.
Assertion misses
the number of assertions whose fail counts are greater than 0
Assertion %
the number of hits from the total number of assertions, as a percentage
Assertion graph
a bar chart displaying the Assertion %; if the percentage is below 90%,
the bar is red; 90% or more, the bar is green; you can change this
threshold percentage by editing the PrefCoverage(cutoff) preference
variable
Branch count
Files window — the number of executable branches in each file
Structure window — the number of executable branches in each level and
all levels under that level
Branches hit
the number of executable branches that have been executed in the current
simulation
Branches missed
the number of executable branches that were not executed in the current
simulation
Branch %
the current ratio of Branch hits to Branch count
Branch graph
a bar chart displaying the Branch %; if the percentage is below 90%, the
bar is red; 90% or more, the bar is green; you can change this threshold
percentage by editing the PrefCoverage(cutoff) preference variable
Condition rows
Files window — the number of conditions in each file
Structure window — the number of conditions in each level and all levels
under that level
Conditions hit
Files window — the number of times the conditions in a file have been
executed
Structure window — the number of times the conditions in a level, and all
levels under that level, have been executed
Conditions missed
Files window — the number of conditions in a file that were not executed
Structure window — the number of conditions in a level, and all levels
under that level, that were not executed
Condition %
the current ratio of Condition hits to Condition rows
ModelSim SE GUI Reference Manual, v10.2c
245
Window Reference
Structure Window
Table 4-55. Columns in the Structure Window (cont.)
Column name
Description
Condition graph
a bar chart displaying the Condition %; if the percentage is below 90%,
the bar is red; 90% or more, the bar is green; you can change this
threshold percentage by editing the PrefCoverage(cutoff) preference
variable
Covergroup %
the number of hits from the total number of covergroups, as a percentage
Cover hits
the number of cover directives whose count values are greater than or
equal to the at_least value.
Cover misses
the number of cover directives whose count values are less than the
at_least value
Cover %
the number of hits from the total number of cover directives, as a
percentage
Cover graph
a bar chart displaying the Cover directive %; if the percentage is below
90%, the bar is red; 90% or more, the bar is green; you can change this
threshold percentage by editing the PrefCoverage(cutoff) preference
variable
Cover Options
The +cover settings used for compilation/simulation of that design unit
Design Unit
The name of the design unit
Design Unit Type
The type of design unit
Expression rows
the number of executable expressions in each level and all levels
subsumed under that level
Expressions hit
the number of times expressions in a level, and each level under that level,
have been executed
Expressions missed the number of executable expressions in a level, and all levels under that
level, that were not executed
Expression %
the current ratio of Expression hits to Expression rows
Expression graph
a bar chart displaying the Expression %; if the percentage is below 90%,
the bar is red; 90% or more, the bar is green; you can change this
threshold percentage by editing the PrefCoverage(cutoff) preference
variable
FEC/UDP
Condition rows
Files window — the number of FEC (or UDP) conditions in each file
Structure window — the number of conditions in each level and all levels
under that level
FEC/UDP
Conditions hit
Files window — the number of times the FEC (or UDP) conditions in a
file have been executed
Structure window — the number of times the conditions in a level, and all
levels under that level, have been executed
246
ModelSim SE GUI Reference Manual, v10.2c
Window Reference
Structure Window
Table 4-55. Columns in the Structure Window (cont.)
Column name
Description
FEC/UDP
Conditions missed
Files window — the number of FEC (or UDP) conditions in a file that
were not executed
Structure window — the number of conditions in a level, and all levels
under that level, that were not executed
FEC/UDP
Condition %
the current ratio of FEC/UDP Condition hits to FEC/UDP Condition
rows
FEC/UDP
Condition graph
a bar chart displaying the FEC (or UDP) Condition %; if the percentage is
below 90%, the bar is red; 90% or more, the bar is green; you can change
this threshold percentage by editing the PrefCoverage(cutoff) preference
variable
FEC/UDP
Expression rows
Files window — the number of executable expressions in each file
Structure window — the number of executable expressions in each level
and all levels subsumed under that level
FEC/UDP
Expressions hit
Files window — the number of times expressions in a file have been
executed
Structure window — the number of times expressions in a level, and each
level under that level, have been executed
FEC/UDP
Files window — the number of executable expressions in a file that were
Expressions missed not executed
Structure window — the number of executable expressions in a level, and
all levels under that level, that were not executed
FEC/UDP
Expression %
the current ratio of FEC/UDP Expression hits to FEC/UDPExpression
rows
FEC/UDP
Expression graph
a bar chart displaying the FEC (or UDP) Expression %; if the percentage
is below 90%, the bar is red; 90% or more, the bar is green; you can
change this threshold percentage by editing the PrefCoverage(cutoff)
preference variable
States
Files window — the number of states encountered in each file
Structure window — level
States hit
Files window — the number of times the states were hit
Structure window — the number of times states in a level, and each level
under that level, have been hit
States missed
Files window — the number of states in a file that were not hit
Structure window — the number of states in a level, and all levels under
that level, that were not hit
State %
the current ratio of State hits to State rows
State graph
a bar chart displaying the State %; if the percentage is below 90%, the bar
is red; 90% or more, the bar is green; you can change this threshold
percentage by editing the PrefCoverage(cutoff) preference variable
ModelSim SE GUI Reference Manual, v10.2c
247
Window Reference
Structure Window
Table 4-55. Columns in the Structure Window (cont.)
Column name
Description
Stmt count
the number of executable statements in each level and all levels under that
level
Stmts hit
the number of executable statements that were executed in each level and
all levels under that level
Stmts missed
the number of executable statements that were not executed in each level
and all levels under that level
Stmt %
the current ratio of Stmt hits to Stmt count
Stmt graph
a bar chart displaying the Stmt %; if the percentage is below 90%, the bar
is red; 90% or more, the bar is green; you can change this threshold
percentage by editing the PrefCoverage(cutoff) preference variable
Toggle nodes
the number of points in each instance where the logic will transition from
one state to another
Toggles hit
the number of nodes in each instance that have transitioned at least once
Toggles missed
the number of nodes in each instance that have not transitioned at least
once
Toggle %
the current ratio of Toggle hits to Toggle nodes
Toggle graph
a bar chart displaying the Toggle %; if the percentage is below 90%, the
bar is red; 90% or more, the bar is green; you can change this threshold
percentage by editing the PrefCoverage(cutoff) preference variable
Top Category
displays the category that is expanded in the initial invocation of the
Structure window; categories are DU Instance, TB component, Package,
Vcdstim, and Statistics
Total Coverage
The weighted average of all the coverage types (functional coverage and
code coverage) is recursive. Deselect Code Coverage > Enable
Recursive Coverage Sums to view results for the local instance. See
“Calculation of Total Coverage” for coverage statistics details.
Transitions
Files window — the number of transitions encountered in each file
Structure window — the number of states encountered in each level and
all levels subsumed under that level
Transitions hit
Files window — the number of times the transitions were hit
Structure window — the number of times transitions in a level, and each
level under that level, have been hit
Transitions missed
Files window — the number of transitions in a file that were not hit
Structure window — the number of transitions in a level, and all levels
under that level, that were not hit
Transition %
the current ratio of Transition hits to Transition rows
248
ModelSim SE GUI Reference Manual, v10.2c
Window Reference
Structure Window
Table 4-55. Columns in the Structure Window (cont.)
Column name
Description
Transition graph
a bar chart displaying the State %; if the percentage is below 90%, the bar
is red; 90% or more, the bar is green; you can change this threshold
percentage by editing the PrefCoverage(cutoff) preference variable
Visibility
The +acc settings used for compilation/optimization of that design unit
Top Category Column
The Top Category column allows you to:
•
Determine which top level categories are is expanded with the initial invocation of the
Structure window (sim tab).
•
Determine the default ordering of the top level categories in the Structure window.
To determine which category is expanded upon initial invocation, do the following:
1. Select Tools > Edit Preferences from the menus. This opens the Preferences window.
2. Select the By Name tab in the Preferences window.
3. Click the ‘+’ sign next to “Structure” to view a list of the preference variables for the
Structure window.
4. Click the initExpandOff variable to select it and then click the Change Value button.
This will open the Change Structure Preference Value dialog (Figure 4-84).
ModelSim SE GUI Reference Manual, v10.2c
249
Window Reference
Structure Window
Figure 4-84. Change Top Level Category Expansion
The Change Structure Preference Value dialog allows you to put a top level category in
the Expand List or the No Expand List. Simply click to select a category, then click “No
Expand” or “Expand” to move the selection into the list you want. By default, on the
Package category is in the No Expand List.
To determine the default ordering of the top level categories in the Structure window simply
click the “Top Category” heading of the column to open a new Change Structure Preference
Value dialog (Figure 4-85).
250
ModelSim SE GUI Reference Manual, v10.2c
Window Reference
Structure Window
Figure 4-85. Change Default Ordering of Structure Window
To change the default ordering of the top level categories simply select a category then
use the up or down arrowheads to move the selection.
Code Coverage in the Structure Window
The Structure window displays code coverage information in the Structure (sim) window for
any datasets being simulated. When coverage is invoked, several columns for displaying
coverage data are added to these windows. You can toggle columns on/off by right-clicking on
a column name and selecting from the context menu that appears. Figure 4-86 shows a portion
of the Structure window with code coverage data displayed.
Figure 4-86. Code Coverage Data in the Structure Window
ModelSim SE GUI Reference Manual, v10.2c
251
Window Reference
Structure Window
You can sort code coverage information for any column by clicking the column heading.
Clicking the column heading again will reverse the order.
Coverage information in the Structure window is dynamically linked to the Code Coverage
Analysis windows. Click the left mouse button on any file in the Files window to display that
file’s un-executed statements, branches, conditions, expressions, and toggles in the Code
Coverage Analysis windows. Lines from the selected file that are excluded from coverage
statistics are also displayed in the Code Coverage Analysis windows.
For details on how the Total Coverage column statistics are calculated, see “Calculation of
Total Coverage”.
252
ModelSim SE GUI Reference Manual, v10.2c
Transaction View Window
The Transaction View window displays information about a selected Questa Verification IP
transaction instance. It is only available for viewing transactions for Questa Verification IPs.
For detailed information on this window, please see “Questa Verification IP Transaction Details
in Transaction View Window”.
Window Reference
ModelSim SE GUI Reference Manual, v10.2c
253
Transcript Window
The Transcript window maintains a running history of commands that are invoked and
messages that occur as you work with ModelSim. When a simulation is running, the Transcript
displays a VSIM prompt, allowing you to enter command-line commands from within the
graphic interface.
Window Reference
You can scroll backward and forward through the current work history by using the vertical
scrollbar. You can also use arrow keys to recall previous commands, or copy and paste using the
mouse within the window (see Main and Source Window Mouse and Keyboard Shortcuts for
details).
Displaying the Transcript Window
The Transcript window is always open in the Main window and cannot be closed.
Viewing Data in the Transcript Window
The Transcript tab contains the command line interface, identified by the ModelSim prompt,
and the simulation interface, identified by the VSIM prompt.
Saving the Transcript File
Variable settings determine the filename used for saving the transcript. If either PrefMain(file)
in the .modelsim file or TranscriptFile in the modelsim.ini file is set, then the transcript output
is logged to the specified file. By default the TranscriptFile variable in modelsim.ini is set to
transcript. If either variable is set, the transcript contents are always saved and no explicit
saving is necessary.
If you would like to save an additional copy of the transcript with a different filename, click in
the Transcript window and then select File > Save As, or File > Save. The initial save must be
made with the Save As selection, which stores the filename in the Tcl variable
PrefMain(saveFile). Subsequent saves can be made with the Save selection. Since no
automatic saves are performed for this file, it is written only when you invoke a Save command.
The file is written to the specified directory and records the contents of the transcript at the time
of the save.
Refer to Creating a Transcript File for more information about creating, locating, and saving a
transcript file.
Saving a Transcript File as a Macro (DO file)
1. Open a saved transcript file in a text editor.
2. Remove all commented lines leaving only the lines with commands.
ModelSim SE GUI Reference Manual, v10.2c
254
Window Reference
Transcript Window
3. Save the file as <name>.do.
Refer to the do command for information about executing a DO file.
Changing the Number of Lines Saved in the Transcript Window
By default, the Transcript window retains the last 5000 lines of output from the transcript. You
can change this default by selecting Transcript > Saved Lines. Setting this variable to 0
instructs the tool to retain all lines of the transcript.
Colorizing the Transcript
By default, all Transcript window messages are printed in blue. You may colorized Transcript
messages according to severity as follows:
1. Select Tools > Edit Preferences from the Main window menus.
2. In the Preferences window select the By Name tab.
3. Expand the list of Preferences under "Main."
4. Select the colorizeTranscript preference and click the Change Value button.
5. Enter "1" in the Change Main Preference Value dialog and click OK (Figure 4-87).
ModelSim SE GUI Reference Manual, v10.2c
255
Window Reference
Transcript Window
Figure 4-87. Changing the colorizeTranscript Preference Value
Disabling Creation of the Transcript File
You can disable the creation of the transcript file by using the following ModelSim command
immediately after ModelSim starts:
transcript file ""
Performing an Incremental Search
The Transcript tab includes an Find function (Figure 4-88) that allows you to do an incremental
search for specific text. To activate the Find bar select Edit > Find from the menus or click the
Find icon in the toolbar. For more information see Find and Filter Functions.
256
ModelSim SE GUI Reference Manual, v10.2c
Window Reference
Transcript Window
Figure 4-88. Transcript Window with Find Toolbar
Using Automatic Command Help
When you start typing a command at the prompt, a dropdown box appears which lists the
available commands matching what has been typed so far. You may use the Up and Down
arrow keys or the mouse to select the desired command. When a unique command has been
entered, the command usage is presented in the drop down box.
You can toggle this feature on and off by selecting Help > Command Completion.
Using drivers and Readers Command Results
The output from the drivers and readers commands, which is displayed in the Transcript
window as hypertext links, allows you to right-click to open a drop-down menu and to quickly
add signals to various windows. It also includes a "View Declaration" item to open the source
definition of the signal.
Figure 4-89. drivers Command Results in Transcript
ModelSim SE GUI Reference Manual, v10.2c
257
Window Reference
Transcript Window
Using Transcript Menu Items
When the Transcript window is active, a "Transcript" menu selection appears in the Main
window menu bar. The following items may be selected when you open the Transcript menu:
Adjust Font Scaling — Displays the Adjust Scaling dialog box, which allows you to
adjust how fonts appear for your display environment. Directions are available in the
dialog box.
Transcript File — Allows you to change the default name used when saving the
transcript file. The saved transcript file will contain all the text in the current transcript
file.
Command History — Allows you to change the default name used when saving
command history information. This file is saved at the same time as the transcript file.
Save File — Allows you to change the default name used when selecting File > Save
As.
Saved Lines — Allows you to change how many lines of text are saved in the transcript
window. Setting this value to zero (0) saves all lines.
Line Prefix — Allows you to change the character(s) that precedes the lines in the
transcript.
Update Rate — Allows you to change the length of time (in ms) between transcript
refreshes.
ModelSim Prompt — Allows you to change the string used for the command line
prompt.
VSIM Prompt — Allows you to change the string used for the simulation prompt.
Paused Prompt — Allows you to change the string used for when the simulation is
paused.
Transcript Toolbar Items
When undocked, the Transcript window allows access to the following toolbars:
•
•
258
Standard Toolbar
Help Toolbar
ModelSim SE GUI Reference Manual, v10.2c
Verification Management Browser Window
Use the Verification Management Browser window to display summary information for
original test results in UCDBs, ranking files, and merged test results in a UCDB. You can also
use it to has a feature for customizing and saving the organization of the tabs. It also supports
features for re-running tests, generating HTML reports from test results, and executing merges
and test ranking.
Window Reference
For details on how the Total Coverage column statistics are calculated, see Calculation of Total
Coverage”. Coverage numbers presented in all columns are by instance, not by file.
Accessing
•
•
GUI: View > Verification Management> Browser
Shell or vsim command prompt: view testbrowser
Figure 4-90 shows the Verification Browser window using the Code Coverage column view
setting, refer to “Controlling the Verification Browser Columns” for more information.
Figure 4-90. Browser Tab
Verification Browser Icons
The Browser uses the following icons to identify the type of file loaded into the browser:
Table 4-56. Verification Browser Icons
Browser Icon
Description
Indicates the file is an unmerged UCDB file. A
“P” notation in the upper right hand corner of the
icon indicates that a Verification Plan is included
in UCDB.
Indicates the file is a rank file.
ModelSim SE GUI Reference Manual, v10.2c
259
Window Reference
Verification Management Browser Window
Table 4-56. Verification Browser Icons (cont.)
Browser Icon
Description
Indicates the file is a merged UCDB file.
Notations on right hand side mean the following:
• P - verification (test) plan is included in
merged UCDB
• 1 - Totals merge
• 2 - Test-associated merge
See “Test-Associated Merge versus Totals Merge
Algorithm” for more information.
Verification Browser Window Tasks
Controlling the Verification Browser Columns
You can customize the appearance of the Browser using either of the following methods:
•
Use the “Column Layout Toolbar” to select from several pre-defined column
arrangements.
•
Right-click in the column headings to display a list of all column headings which allows
you to toggle the columns on or off.
Saving Verification Browser Column and Filter Settings
Save your column layout and any filter settings to an external file (browser_column_layout.do)
by selecting File > Export > Column Layout while the window is active. You can reload these
settings with the do command. This export does not retain changes to column width.
Viewing Verification Browser Data in HTML
You can Export the view of the columns and verification data in the Browser, including any
filter settings, to an HTML file (browser.htm) using the by selecting File > Export > HTML
while the window is active. A dialog opens in which you can set both the name of the file and
the directory to which it is saved. By default, the HTML file is saved into the current directory.
GUI Elements of the Verification Browser Window
This section provides an overview of the GUI elements specific to this window.
260
ModelSim SE GUI Reference Manual, v10.2c
Window Reference
Verification Management Browser Window
Column Descriptions
For a description of the columns ending in “Incr”, see the generic description for “xxxIncr”.
Table 4-57. Verification Management Browser Window Column Descriptions
Column Title
Description
Assertions
the number of hits from the total number of assertions, as a
percentage
xxxxIncr
(AssertionsIncr,
BranchesIncr, CoversIncr,
etc.)
valid only for rows within a .rank file whose tests contribute in
some measure to the overall coverage. Within those rows, the
numbers indicate the incremental additional coverage
contributed by the test in that row, relative to the previous test’s
coverage.
Branches
the number of executable branches in each level and all levels
under that level
Compulsory
whether the UCDB is part of a required (compulsory) test for
ranking
Covergroups
the number of hits from the total number of covergroups, as a
percentage
Covers
the number of hits from the total number of cover directives, as a
percentage
CPUTime
total CPU time consumed
CvgPeakMemory
the peak transient memory used by the covergroup.
CvgPeakTime
the simulation run time at which the peak transient memory
usage occurred.
CvgTotalMemory
the persistent memory used by the covergroup.
Date
date the test was run
FecConditions
the number of FEC conditions in each level and all levels under
that level
FecExpressions
the number of executable FEC expressions in each level and all
levels subsumed under that level
OriginalFileName
UCDB filename
Seed
random seed
SimTime
total simulation time
Statements
the number of executable statements in each level and all levels
under that UCDB
States
the number of states encountered in each level and all levels
subsumed under that UCDB
ModelSim SE GUI Reference Manual, v10.2c
261
Window Reference
Verification Management Browser Window
Table 4-57. Verification Management Browser Window Column Descriptions
Column Title
Description
SystemC
SystemC coverage as a percentage
TestCmd
vsim command used to run simulation
TestComment
comments for the test
TestName
name of the test
TestplanCoverage
coverage percentage for that section of plan
TestStatus
status of the test
ToggleNodes
the number of points in the UCDB where the logic will
transition from one state to another
TotalCoverage
the weighted average of all the coverage types (functional
coverage and code coverage) is recursive. Deselect Code
Coverage > Enable Recursive Coverage Sums to view results
for the local instance. See “Calculation of Total Coverage” for
coverage statistics details.
Transitions
the number of states encountered in each level and all levels
subsumed under that level for the UCDB
UdpConditions
the number of UCP conditions in each level and all levels under
that level
UdpExpressions
the number of executable UDP expressions in each level and all
levels subsumed under that level
UserName
name of user who ran simulation which created the UCDB
VsimArgs
arguments passed to vsim command
Toolbar
The Browser allows access to the Column Layout Toolbar and the Help Toolbar.
Verification Browser Menu
This menu becomes available in the Main menu when the Verification Management Browser
View window is active.
Table 4-58. Verification Browser View Menu
Browser View Menu
Item
Description
Add File
Adds UCDB (.ucdb) and ranking results (.rank) files to the browser.
Refer to the section Viewing Test Data in the GUI for more
information.
262
ModelSim SE GUI Reference Manual, v10.2c
Window Reference
Verification Management Browser Window
Table 4-58. Verification Browser View Menu (cont.)
Browser View Menu
Item
Description
Remove File
Removes an entry from this window (From Browser Only), as well
as from the file system (Browser and File System).
Remove NonContributing Test(s)
Operates only on ranked (.rank) files; menu selection is grayed out
unless a ranked file is selected. Removes any tests that do not
contribute toward the coverage.
Testplan Import
Displays the XML Testplan Import Dialog Box, which allows you to
import an XML test plan file into a UCDB which can then be
merged with test results. .
Merge
Displays the Merge Files Dialog Box, which allows you to merge
any selected UCDB files. Refer to the section Merging Coverage
Data for more information.
Rank
Displays the Rank Files Dialog Box, which allows you to create a
ranking results file based on the selected UCDB files. Refer to the
section Ranking Coverage Test Data for more information.
HTML Report
Displays the HTML Coverage Report Dialog Box, which allows you
to view your coverage statistics in an HTML viewer.
Command Execution
Allows you to re-run simulations based on the resultant UCDB file
based on the simulation settings to create the file. You can rerun any
test whose test record appears in an individual .ucdb file, a merged
.ucdb file, or ranking results (.rank) file. See Test Attribute Records
in the UCDB for more information on test records.
• Setup — Displays the Command Setup Dialog box, which
allows you to create and edit your own setups which can be used
to control the execution of commands. “Restore All Defaults”
removes any changes you make to the list of setups and the
associated commands.
• Execute on all — Executes the specified command(s) on all
.ucdb files in the browser (through TestReRun), even those used
in merged .ucdb files and .rank files.
• Execute on selected — Executes the specified command(s) on
the selected .ucdb file(s) through TestReRun.
Filter
Either opens the Filter Setup Dialog Box, or applies desired filter
setups.
• Setup — opens the Filter Setup dialog that allows you to save
and edit filters to apply to the data.
• Create button — opens the Create Filter dialog which allows
you to select filtering criteria, and select the tests for
application of the specified filters.
• Apply — applies the selected filter(s) on the data.
ModelSim SE GUI Reference Manual, v10.2c
263
Window Reference
Verification Management Browser Window
Table 4-58. Verification Browser View Menu (cont.)
Browser View Menu
Item
Description
Generate RMDB File
Generates Verification Run Management configuration file (.rmdb)
including selected tests or all tests in the directory. Selecting either
option brings up a dialog to enter the name to be used for the .rmdb
file.
• Save Selected Tests — Saves selected tests into a .rmdb or .tcl
file to be executed by vrun command.
• Save All Tests — Saves all tests in the directory into a .rmdb or
.tcl file to be executed by vrun command.
Show Full Path
Toggles whether the FileName column shows only the filename or
its full path.
Set Precision
Controls the decimal point precision of the data in the Verification
Browser window.
Trend Analysis
Active only when a Trend UCDB is selected, or when multiple
UCDBs are selected. Allows access to trending functionality.
• HTML Report — opens the Coverage Trend Report (HTML)
dialog box, where you set: the HTML report’s colorization
threshold; the output directory path; and other HTML reporting
options. See vcover report -html for detailed description of
options.
• XML Report — opens the Coverage Trend Report (XML) dialog
box, where you set whether you are reporting on all (or
specified) DUs, test plans, or instances; filtering; the coverage
type; and the report pathname.
• Text Report — opens the Coverage Trend Report (Text) dialog
box, where you set whether you are reporting on all (or
specified) DUs, test plans, or instances; filtering; the coverage
type; and the report pathname.
• Create Trend Database — opens the Create Trend Database
dialog box, where you enter the name of the output trend
database (the “Trend UCDB”) and input UCDBs.
• Export — opens the Coverage Trend Report Export dialog box,
where you set the options as shown for XML or HTML report,
and export the report into a comma separated value (csv) or other
format file.
• View Trender — opens the Trender window in the Main
window. In this window, right click on any coverage object to
display a trend graph for that object.
264
ModelSim SE GUI Reference Manual, v10.2c
Window Reference
Verification Management Browser Window
Popup Menu
Right-click on one of the UCDBs in the Browser window to display the popup menu and select
one of the following options, in addition to those listed in Table 4-58:
Table 4-59. Verification Management Browser Window Popup Menu
Popup Menu Item
Description
Expand / Collapse Selected
Expand or collapse selected UCDBs.
Expand / Collapse All
Expand or collapse all UCDBs.
Save Format
Saves the current contents of the browser to a .do
file.
Load
Loads a .do file that contains a previously saved
browser layout.
ModelSim SE GUI Reference Manual, v10.2c
265
Watch Window
Use the Watch window to view values for signals and variables at the current simulation time
and to explore the hierarchy of object oriented designs.
Window Reference
Unlike the Objects or Locals windows, the Watch window allows you to view any signal or
variable in the design regardless of the current context. You can view the following objects:
VHDL objects — signals, aliases, generics, constants, and variables.
Verilog objects — nets, registers, variables, named events, and module parameters.
SystemC objects — primitive channels and ports.
Virtual objects — virtual signals and virtual functions.
Accessing
Access the window using either of the following:
•
•
Menu item: View > Watch
Command: view watch
Figure 4-91. Watch Window
ModelSim SE GUI Reference Manual, v10.2c
266
Window Reference
Watch Window
Watch Window Tasks
This section describes tasks for using the Watch window.
Adding Objects to the Watch Window
To add objects to the Watch window, drag -and-drop objects from the Structure window or from
any of the following windows: List, Locals, Objects, Source, and Wave. You can also use the
“Add Selected to Window Button”. You can also use the add watch command.
Expanding Objects to Show Individual Bits
If you add an array or record to the window, you can view individual bit values by doubleclicking the array or record. As shown in Figure 4-92, /ram_tb/spram4/mem has been expanded
to show all the individual bit values. Notice the arrow that “ties” the array to the individual bit
display.
Figure 4-92. Expanded Array
GUI Elements of the Watch Window
This section describes GUI elements specific to this window.
ModelSim SE GUI Reference Manual, v10.2c
267
Window Reference
Watch Window
Graphical Element
The primary graphical element of the watch window is the item box, which typically shows
information about a single signal. The item can also be a group of signals created with the
“group” popup window option.
Header — shows the signal name, followed, parenthetically, by its address (if it has
one).
Body — shows the current value of the signal. Values that are red have changed since
the previous run command.
SystemVerilog Classes — Items are displayed in a scrollable, hierarchical list, such as
in Figure 4-93 where extended SystemVerilog classes hierarchically display their super
members.
Current Time Label — Displays the Current Time or the Now (end of simulation)
time. This is the time used to control state values annotated in the window. (For details,
refer to Current Time Label.)
Figure 4-93. Scrollable Hierarchical Display
Two Ref handles that refer to the same object will point to the same Watch window box,
even if the name used to reach the object is different. This means circular references will
be draw as circular.
268
ModelSim SE GUI Reference Manual, v10.2c
Window Reference
Watch Window
Popup Menu
Table 4-60. Watch Window Popup Menu
Popup menu Item
Description
Add
Add the selected item or items to the desired
window
Force
Opens the Force Selected Signal dialog box,
which allows you to force the signal to given
value. Refer to the force command for details
about the options.
NoForce
Removes the force on the selected object.
Refer to the noforce command.
Clock
Performs actions related to the force
command with the -repeat argument.
Change
Performs actions related to the change
command.
Follow Selection Context
Changes the current context in the Structure
window.
Save Format
Load Format
Saves a new (or loads an existing) .do file
containing add watch commands to recreate
the Watch window.
Group
Groups several selected signals into a single
item.
UnGroup
Breaks a previously created group back into
its individual signals
Properties
Opens the Properties dialog box, which
allows you to alter the properties of the
selected signal or group, including:
• Header name
• Radix type
This option is not available when multiple
signals are selected.
Delete Item
Removes the selected signal from the
window. You can alternatively use the delete
key.
Clear All
Removes all signals from the window.
ModelSim SE GUI Reference Manual, v10.2c
269
Window Reference
Watch Window
Watch Menu
This menu becomes available in the Main menu when the Watch window is active
Table 4-61. Watch Window Menu
270
Popup menu Item
Description
Force
Opens the Force Selected Signal dialog box,
which allows you to force the signal to given
value. Refer to the force command for details
about the options.
NoForce
Removes the force on the selected object.
Refer to the noforce command.
Clock
Performs actions related to the force
command with the -repeat argument.
Change
Performs actions related to the change
command.
Follow Selection Context
Changes the current context in the Structure
window.
Save Format
Load Format
Saves a new (or loads an existing) .do file
containing add watch commands to recreate
the Watch window.
Group
Groups several selected signals into a single
item.
UnGroup
Breaks a previously created group back into
its individual signals
Tile
Reorganizes the items in the Watch window
into different tiled formats.
Delete Item
Removes the selected signal from the
window. You can alternatively use the delete
key.
Clear All
Removes all signals from the window.
ModelSim SE GUI Reference Manual, v10.2c
Wave Window
The Wave window, like the List window, allows you to view the results of your simulation. In
the Wave window, however, you can see the results as waveforms and their values.
Window Reference
Figure 4-94. Wave Window
For information about using this window with a Power Aware simulation, refer to the section
"Power Aware Waveform Display" in the Power Aware Simulation User’s Manual.
Add Objects to the Wave Window
You can add objects to the Wave window from other windows in the following ways:
•
•
Mouse: Drag and drop.
•
Toolbar: Click-and-hold the “Add Selected to Window Button” to specify where
selected signals are placed: above the Insertion Point Bar in the Pathnames Pane,
Mouse: Click the middle mouse button when the cursor is over an object or group of
objects in the Objects or Locals windows. The specified object(s) are added to the Wave
Window.
ModelSim SE GUI Reference Manual, v10.2c
271
Window Reference
Wave Window
appended after the Insertion Pointer in the Pathnames Pane, at the top or the end of the
Pathnames Pane.
•
Command: add wave
When you drag and drop objects into the Wave window, the add wave command is reflected in
the Transcript window.
Refer to Adding Objects to the Wave Window for more information about adding objects to the
Wave window.
Wave Window Panes
The Wave window is divided into a number of window panes. All window panes in the Wave
window can be resized by clicking and dragging the bar between any two panes.
Pathname Pane
The pathname pane displays signal pathnames. Signals can be displayed with full pathnames, as
shown here, or with any number of path elements. You can increase the size of the pane by
clicking and dragging on the right border. The selected signal is highlighted.
The white bar along the left margin indicates the selected Wave window or pane of a split wave
window (see Splitting Wave Window Panes).
Insertion Point Bar
You can select the location for inserting signals by placing the cursor over the left white bar in
the Pathnames Pane. The white arrow and green bar indicate the selected location for the
insertion pointer. Clicking the left mouse button sets the new insertion pointer.
272
ModelSim SE GUI Reference Manual, v10.2c
Window Reference
Wave Window
Figure 4-95. Pathnames Pane
Values Pane
The values pane displays the values of the displayed signals. You can resize the values pane by
clicking on and dragging the right border. Some signals may be too wide (too many bits) for
their values to be fully displayed. Use the scroll bar at the bottom of the pane to see the entire
signal value. Small signal values will remain in view while scrolling.
The radix for each signal can be symbolic, binary, octal, decimal, unsigned, hexadecimal,
ASCII, or default. The default radix for all signals can be set by selecting Simulate > Runtime
Options.
Note
When the symbolic radix is chosen for SystemVerilog reg and integer types, the values
are treated as binary. When the symbolic radix is chosen for SystemVerilog bit and int
types, the values are considered to be decimal.
To change the radix for just the selected signal or signals, select Wave > Format > Radix >
Global Signal Radix from the menus, or right-click the selected signal(s) and select Radix >
Global Signal Radix from the popup menu. This opens the Global Signal Radix dialog
(Figure 4-96), where you may select a radix. This sets the radix for the selected signal(s) in the
Wave window and every other window where the signal appears.
ModelSim SE GUI Reference Manual, v10.2c
273
Window Reference
Wave Window
Figure 4-96. Setting the Global Signal Radix from the Wave Window
The data in this pane is similar to that shown in the Objects Window, except that the values
change dynamically whenever a cursor in the waveform pane is moved.
Figure 4-97. Values Pane
Waveform Pane
Figure 4-98 shows waveform pane, which displays waveforms that correspond to the displayed
signal pathnames. It can also display as many as 20 user-defined cursors. Signal values can be
displayed in analog step, analog interpolated, analog backstep, literal, logic, and event formats.
You can set the format of each signal individually by right-clicking the signal in the pathname
or values panes and choosing Format from the popup menu. The default format is Logic.
274
ModelSim SE GUI Reference Manual, v10.2c
Window Reference
Wave Window
If you place your mouse pointer on a signal in the waveform pane, a popup menu displays with
information about the signal. You can toggle this popup on and off in the Wave Window
Properties dialog box.
Dashed signal lines in the waveform pane indicate weak or ambiguous strengths of Verilog
states. See Verilog States in the Mixed-Language Simulation chapter.
Figure 4-98. Waveform Pane
Analog Sidebar Toolbox
When the waveform pane contains an analog waveform, you can hover your mouse pointer over
the left edge of the waveform to display the Analog Sidebar toolbox (see Figure 4-99). This
toolbox shows a group of icons that gives you quick access to actions you can perform on the
waveform display, as described in Table 4-62.
Figure 4-99. Analog Sidebar Toolbox
ModelSim SE GUI Reference Manual, v10.2c
275
Window Reference
Wave Window
Table 4-62. Analog Sidebar Icons
Icon
Action
Description
Open Wave Properties
Opens the Format tab of the Wave Properties
dialog box, with the Analog format already
selected. This dialog box duplicates the Wave
Analog dialog box displayed by choosing
Format > Format... > Analog (custom)
from the main menu.
Toggle Row Height
Changes the height of the row that contains the
analog waveform. Toggles the height between
the Min and Max values (in pixels) you specified
in the Open Wave Properties dialog box under
Analog Display.
Rescale to fit Y data
Changes the waveform height so that it fits topto-bottom within the current height of the row.
Show menu of other actions
Displays
• View Min Y
• View Max Y
• Overlay Above
• Overlay Below
• Colorize All
• Colorize Selected
Drag to resize waveform height
Creates an up/down dragging arrow that you can
use to temporarily change the height of the row
containing the analog waveform.
Cursor Pane
Figure 4-100 shows the Cursor Pane, which displays cursor names, cursor values and the cursor
locations on the timeline. You can link cursors so that they move across the timeline together.
See Linking Cursors in the Waveform Analysis chapter.
Figure 4-100. Cursor Pane
276
ModelSim SE GUI Reference Manual, v10.2c
Window Reference
Wave Window
On the left side of this pane is a group of icons called the Cursor and Timeline Toolbox (see
Working with Cursors). This toolbox gives you quick access to cursor and timeline features and
configurations. See Measuring Time with Cursors in the Wave Window for more information.
Messages Bar
The messages bar, located at the top of the Wave window, contains indicators pointing to the
times at which a message was output from the simulator. By default, the indicators are not
displayed. To turn on message indicators, use the -msgmode argument with the vsim command
or use the msgmode variable in the modelsim.ini file.
Figure 4-101. Wave Window - Message Bar
The message indicators (the down-pointing arrows) are color-coded as follows:
Red — Indicates an assertion failure or error.
Yellow — Indicates a warning.
Green — Indicates a note.
Grey — Indicates any other type of message.
You can use the Message bar in the following ways.
•
Move the cursor to the next message — You can do this in two ways:
o
Click on the word “Messages” in the message bar to cycle the cursor to the next
message after the current cursor location.
o
Click anywhere in the message bar, then use Tab or Shift-Tab to cycle the cursor
between error messages either forward or backward, respectively.
•
Display the Message Viewer Window — Double-click anywhere amongst the message
indicators.
•
Display, in the Message Viewer window, the message entry related to a specific
indicator — Double-click on any message indicator.
This function only works if you are using the Message Viewer in flat mode. To display
your messages in flat mode:
a. Right-click in the Message Viewer and select Display Options
b. In the Message Viewer Display Options dialog box, deselect Display with
Hierarchy.
ModelSim SE GUI Reference Manual, v10.2c
277
Window Reference
Wave Window
View Objects Window Button
This button opens the Objects window with a single click. However, if you click-and-hold the
button you can access additional options via a dropdown menu, as shown in Figure 4-102
Figure 4-102. View Objects Window Dropdown Menu
Assertions Debug Pane
The Assert Debug pane displays details on PSL and SVA assertion failures. See Analyzing
Assertion Failures in the Assertion Debug Pane of the Wave Window for more information.
Wave Window Icons
The following icons can be found in the Wave window.
Table 4-63. Window Icons
Icon shape
Example
Description
FSM button
opens the FSM Viewer window
Null
verilog/system verilog name event
Objects You Can View in the Wave Window
The following types of objects can be viewed in the Wave window
•
VHDL objects (indicated by a dark blue diamond) — signals, aliases, process variables,
and shared variables
•
Verilog objects (indicated by a light blue diamond) — nets, registers, variables, and
named events
The GUI displays inout variables of a clocking block separately, where the output of the
inout variable is appended with “__o”, for example you would see following two
objects:
clock1.c1
clock1.c1__o
278
/input portion of the inout c1
/output portion of the inout c1
ModelSim SE GUI Reference Manual, v10.2c
Window Reference
Wave Window
This display technique also applies to the Objects window
•
Verilog and SystemVerilog transactions (indicated by a blue four point star) — see for
more information
•
SystemC objects:
(indicated by a green diamond) — primitive channels and ports
(indicated by a green four point star) — transaction streams and their element
•
Virtual objects (indicated by an orange diamond) — virtual signals, buses, and
functions, see; Virtual Objects for more information
•
Comparison objects (indicated by a yellow triangle) — comparison region and
comparison signals; see Waveform Compare for more information
•
SystemVerilog and PSL assertions (indicated by a light-blue (SVA) or magenta (PSL)
triangle) — see Viewing Assertions and Cover Directives in the Wave Window
•
SystemVerilog and PSL cover directives (indicated by a light-blue (SVA) or magenta
(PSL) chevron) — see Viewing Assertions and Cover Directives in the Wave Window
•
Questa Verification IP objects (see Questa Verification IP Objects in the GUI) — see
Questa Verification IP Transaction Viewing in the GUI for more information
•
Created waveforms (indicated by a red dot on a diamond) — see Generating Stimulus
with Waveform Editor
The data in the object values pane is very similar to the Objects window, except that the values
change dynamically whenever a cursor in the waveform pane is moved.
At the bottom of the waveform pane you can see a time line, tick marks, and the time value of
each cursor’s position. As you click and drag to move a cursor, the time value at the cursor
location is updated at the bottom of the cursor.
You can resize the window panes by clicking on the bar between them and dragging the bar to a
new location.
Waveform and signal-name formatting are easily changed via the Format menu. You can reuse
any formatting changes you make by saving a Wave window format file (see Saving the
Window Format).
Wave Window Toolbar
The Wave window (in the undocked Wave window) gives you quick access to the following
toolbars:
•
•
Standard Toolbar
Compile Toolbar
ModelSim SE GUI Reference Manual, v10.2c
279
Window Reference
Wave Window
•
•
•
•
•
•
•
•
280
Simulate Toolbar
Step Toolbar
Wave Cursor Toolbar
Wave Edit Toolbar
Wave Toolbar
Wave Compare Toolbar
Zoom Toolbar
Wave Expand Time Toolbar
ModelSim SE GUI Reference Manual, v10.2c
Chapter 5
Keyboard Shortcuts and Mouse Actions
Window Specific Keyboard Shortcuts
You can open a dynamic list of common (pre-defined) and user defined keyboard shortcuts for
many windows by entering "Ctrl+/" on your keyboard. Figure 5-1 shows the keyboard shortcuts
for the Source window.
Figure 5-1. Keyboard Shortcuts for Source Window
You can find a complete list of all keyboard shortcuts - predefined and user defined - by
clicking "View All Shortcuts." Refer to User Defined Keyboard Shortcuts for more information
on how to create a customized shortcut.
The following windows have keyboard shortcuts assigned:
•
•
•
•
•
•
•
•
Dataflow Window
Library Window
Objects Window
Schematic Window
Source Window
Structure Window
Transcript Window
Wave Window
ModelSim SE GUI Reference Manual, v10.2c
281
Keyboard Shortcuts and Mouse Actions
User Defined Keyboard Shortcuts
User Defined Keyboard Shortcuts
In addition to the predefined keyboard shortcuts you can create your own shortcuts or modify
predefined keyboard shortcuts with the Keyboard Shortcuts dialog box (Figure 5-2). Shortcuts
can be either window specific (available only when the window is active) or global (available
from anywhere in the tool). You can create a keyboard shortcut for any window in ModelSim.
Once a shortcut is defined, it will be available in all subsequent invocations of the tool. The
dynamic nature of the architecture makes the keyboard shortcuts available to any tool that is
based upon the ModelSim GUI, such as ADMS, 0-In, MVC, and Codelink.
The Keyboard Shortcuts Dialog Box
The Keyboard Shortcuts dialog box lists all existing keyboard shortcuts. The dialog
distinguishes between shortcuts that are user defined and shortcuts that come predefined in the
tool (Figure 5-2).
Figure 5-2. Keyboard Shortcuts Dialog Box
The Keyboard Shortcuts Dialog Box allows you to:
•
282
Add a new user defined keyboard shortcut. Refer to Creating A Keyboard Shortcut for
more information.
ModelSim SE GUI Reference Manual, v10.2c
Keyboard Shortcuts and Mouse Actions
User Defined Keyboard Shortcuts
•
Modify an existing keyboard shortcut. Any shortcut can be modified including
predefined shortcuts.
•
•
Delete a shortcut.
•
Export all user defined keyboard shortcuts to bindings.do file. Keyboard shortcuts saved
in the file can be reloaded either by selecting the Import button in the Keyboard
Shorcuts Dialog Box or by entering do bindings.do on the command line.
Import shortcuts from a previously saved bindings.do file. You can also reload the
keyboard shortcuts file with the do command.
Creating A Keyboard Shortcut
You can create either a Global or a window specific shortcut.
1. If you are creating a window specific shortcut, the window must have been opened
sometime during the simulation run.
2. Open the Add Keyboard Shortcut dialog box by selecting Window > Keyboard
Shortcuts.
3. Click the Add button to open the Add Keyboard Shortcut dialog box.
ModelSim SE GUI Reference Manual, v10.2c
283
Keyboard Shortcuts and Mouse Actions
User Defined Keyboard Shortcuts
Figure 5-3. Add Keyboard Shortcut Dialog Box
4. Select the Shortcut Type, either Global or Window. If you are creating a window
specific shortcut, click the window button to open the Select Window Type dialog box.
The dialog box displays every window that has been opened during the current
simulation. If you do not see the window you are looking for, close both dialog boxes,
open the window you want by entering view <window> on the command line, or by
selecting the window from the View menu. Choosing Global or a specific window
changes the options available in the Shortcut Key Operation field and the dynamically
populated field to the right.
5. Enter the key combination in the Shortcut Key field. Or select the Change Entry
Mode button to enter a key combination.
6. Choose the type of operation the shortcut will execute.
284
ModelSim SE GUI Reference Manual, v10.2c
Keyboard Shortcuts and Mouse Actions
Main and Source Window Mouse and Keyboard Shortcuts
o
A Popup or Pulldown Menu — Opens the Menu Items dialog with a hierarchical list
of all popup and pulldown menu items available either globally or for the window
specified in step 4.
o
A Toolbar button — Opens the Toolbar Buttons dialog with a hierarchical list of all
toolbar button actions available either globally or for the window specified in step 4.
o
General Tcl script — Selecting this option opens the Tcl Script field to the right.
You can enter any Tcl script or command line sequence.
o
An Internal window command — This choice is available only for window specific
commands. Refer to step 4. Opens the Window Action dialog on the right with a list
of all window specific commands.
Main and Source Window Mouse and Keyboard
Shortcuts
The following mouse actions and special keystrokes can be used to edit commands in the entry
region of the Main window. They can also be used in editing the file displayed in the Source
window and all Notepad windows (enter the notepad command within ModelSim to open the
Notepad editor).
Table 5-1. Mouse Shortcuts
Mouse - UNIX and Windows
Result
Click the left mouse button
relocate the cursor
Click and drag the left mouse button
select an area
Shift-click the left mouse button
extend selection
Double-click the left mouse button
select a word
Double-click and drag the left mouse button
select a group of words
Ctrl-click the left mouse button
move insertion cursor without changing the
selection
Click the left mouse button on a previous
ModelSim or VSIM prompt
copy and paste previous command string to
current prompt
Click the middle mouse button
paste selection to the clipboard
Click and drag the middle mouse button
scroll the window
ModelSim SE GUI Reference Manual, v10.2c
285
Keyboard Shortcuts and Mouse Actions
Main and Source Window Mouse and Keyboard Shortcuts
Table 5-2. Keyboard Shortcuts
Keystrokes - UNIX and Windows
Result
Left Arrow
Right Arrow
move cursor left or right one character
Ctrl + Left Arrow
Ctrl + Right Arrow
move cursor left or right one word
Shift + Any Arrow
extend text selection
Ctrl + Shift + Left Arrow
Ctrl + Shift + Right Arrow
extend text selection by one word
Up Arrow
Down Arrow
Transcript window: scroll through command history
Source window: move cursor one line up or down
Ctrl + Up Arrow
Ctrl + Down Arrow
Transcript window: moves cursor to first or last line
Source window: moves cursor up or down one
paragraph
Alt + /
Open a pop-up command prompt for entering
commands.
Ctrl + Home
move cursor to the beginning of the text
Ctrl + End
move cursor to the end of the text
Backspace
Ctrl + h (UNIX only)
delete character to the left
Delete
Ctrl + d (UNIX only)
delete character to the right
Esc (Windows only)
cancel
Alt
activate or inactivate menu bar mode
Alt-F4
close active window
Home
Ctrl + a
move cursor to the beginning of the line
Ctrl + Shift + a
select all contents of active window
Ctrl + b
move cursor left
Ctrl + d
delete character to the right
End
Ctrl + e
move cursor to the end of the line
Ctrl + f (UNIX)
Right Arrow (Windows)
move cursor right one character
Ctrl + k
delete to the end of line
286
ModelSim SE GUI Reference Manual, v10.2c
Keyboard Shortcuts and Mouse Actions
Main and Source Window Mouse and Keyboard Shortcuts
Table 5-2. Keyboard Shortcuts (cont.)
Keystrokes - UNIX and Windows
Result
Ctrl + n
move cursor one line down (Source window only
under Windows)
Ctrl + o (UNIX only)
insert a new line character at the cursor
Ctrl + p
move cursor one line up (Source window only under
Windows)
Ctrl + s (UNIX)
Ctrl + f (Windows)
find
Ctrl + t
reverse the order of the two characters on either side of
the cursor
Ctrl + u
delete line
Page Down
Ctrl + v (UNIX only)
move cursor down one screen
Ctrl + x
cut the selection
Ctrl + s
Ctrl + x (UNIX Only)
save
Ctrl + v
paste the selection
Ctrl + a (Windows Only)
select the entire contents of the widget
Ctrl + \
clear any selection in the widget
Ctrl + - (UNIX)
Ctrl + / (UNIX)
Ctrl + z (Windows)
undoes previous edits in the Source window
Meta + < (UNIX only)
move cursor to the beginning of the file
Meta + > (UNIX only)
move cursor to the end of the file
Page Up
Meta + v (UNIX only)
move cursor up one screen
Ctrl + c
copy selection
F3
Performs a Find Next action in the Source window.
F4
Shift+F4
Change focus to next pane in main window
Change focus to previous pane in main window
F5
Toggle between expanding and restoring size of pane
to fit the entire main window
Toggle on/off the pane headers.
Shift+F5
F8
ModelSim SE GUI Reference Manual, v10.2c
search for the most recent command that matches the
characters typed (Main window only)
287
Keyboard Shortcuts and Mouse Actions
Main and Source Window Mouse and Keyboard Shortcuts
Table 5-2. Keyboard Shortcuts (cont.)
Keystrokes - UNIX and Windows
Result
F9
run simulation
F10
continue simulation
F11 (Windows only)
single-step
F12 (Windows only)
step-over
The Main window allows insertions or pastes only after the prompt; therefore, you don’t need to
set the cursor when copying strings to the command line.
List of Keyboard Shortcuts in GUI Windows
You can open a dynamic list of keyboard shortcuts, predetermined and user defined, for most
windows by entering Ctrl-Shift-?
Figure 5-4. Schematic Window Keyboard Shortcuts
You can create user defined keyboard shortcuts and change predetermined shortcuts. Refer to
User Defined Keyboard Shortcuts for more information.
288
ModelSim SE GUI Reference Manual, v10.2c
Keyboard Shortcuts and Mouse Actions
List Window Keyboard Shortcuts
List Window Keyboard Shortcuts
Using the following keys when the mouse cursor is within the List window will cause the
indicated actions:
Table 5-3. List Window Keyboard Shortcuts
Key - UNIX and Windows
Action
Left Arrow
scroll listing left (selects and highlights the item to the
left of the currently selected item)
Right Arrow
scroll listing right (selects and highlights the item to
the right of the currently selected item)
Up Arrow
scroll listing up
Down Arrow
scroll listing down
Page Up
Ctrl + Up Arrow
scroll listing up by page
Page Down
Ctrl + Down Arrow
scroll listing down by page
Tab
searches forward (down) to the next transition on the
selected signal
Shift + Tab
searches backward (up) to the previous transition on
the selected signal
Shift + Left Arrow
Shift + Right Arrow
extends selection left/right
Ctrl + f (Windows)
Ctrl + s (UNIX)
opens the Find dialog box to find the specified item
label within the list display
Wave Window Mouse and Keyboard Shortcuts
The following mouse actions and keystrokes can be used in the Wave window.
Table 5-4. Wave Window Mouse Shortcuts
Mouse action1
Result
Ctrl + Click left mouse button
and drag
zoom area (in)
Ctrl + Click left mouse button
and drag
zoom out
ModelSim SE GUI Reference Manual, v10.2c
289
Keyboard Shortcuts and Mouse Actions
Wave Window Mouse and Keyboard Shortcuts
Table 5-4. Wave Window Mouse Shortcuts (cont.)
Mouse action1
Result
Ctrl + Click left mouse button
and drag
zoom fit
Click left mouse button and drag
moves closest cursor
Ctrl + Click left mouse button on a
scroll bar arrow
scrolls window to very top or
bottom (vertical scroll) or far
left or right (horizontal scroll)
Click middle mouse button in scroll bar scrolls window to position of
(UNIX only)
click
Shift + scroll with middle mouse button scrolls window
1. If you choose Wave > Mouse Mode > Zoom Mode, you do not need to press
the Ctrl key.
Table 5-5. Wave Window Keyboard Shortcuts
290
Keystroke
Action
s
bring into view and center the currently active cursor
i
Shift + i
+
zoom in
(mouse pointer must be over the cursor or waveform panes)
o
Shift + o
-
zoom out
(mouse pointer must be over the cursor or waveform panes)
f
Shift + f
zoom full
(mouse pointer must be over the cursor or waveform panes)
l
Shift + l
zoom last
(mouse pointer must be over the cursor or waveform panes)
r
Shift + r
zoom range
(mouse pointer must be over the cursor or waveform panes)
m
zooms all open Wave windows to the zoom range of the
active window.
Up Arrow
Down Arrow
scrolls entire window up or down one line, when mouse
pointer is over waveform pane
scrolls highlight up or down one line, when mouse pointer is
over pathname or values pane
Left Arrow
scroll pathname, values, or waveform pane left
ModelSim SE GUI Reference Manual, v10.2c
Keyboard Shortcuts and Mouse Actions
Wave Window Mouse and Keyboard Shortcuts
Table 5-5. Wave Window Keyboard Shortcuts (cont.)
Keystroke
Action
Right Arrow
scroll pathname, values, or waveform pane right
Page Up
scroll waveform pane up by a page
Page Down
scroll waveform pane down by a page
Tab
search forward (right) to the next transition on the selected
signal - finds the next edge
Shift + Tab
search backward (left) to the previous transition on the
selected signal - finds the previous edge
Ctrl+G
automatically create a group for the selected signals by region
with the name Group<n>.
If you use this shortcut on signals for which there is already a
“Group<n>” they will be placed in that region’s group rather
than creating a new one.
Ctrl + F (Windows)
Ctrl + S (UNIX)
open the find dialog box; searches within the specified field in
the pathname pane for text strings
Ctrl + Left Arrow
Ctrl + Right Arrow
scroll pathname, values, or waveform pane left or right by a
page
ModelSim SE GUI Reference Manual, v10.2c
291
Keyboard Shortcuts and Mouse Actions
Wave Window Mouse and Keyboard Shortcuts
292
ModelSim SE GUI Reference Manual, v10.2c
Chapter 6
GUI Customization
The ModelSim GUI is programmed using Tcl/Tk. It is highly customizable. You can control
everything from window size, position, and color to the text of window prompts, default output
filenames, and so forth. You can even add buttons and menus that run user-programmable Tcl
code.
Most user GUI preferences are stored as Tcl variables in the .modelsim file on Unix/Linux
platforms or the Registry on Windows platforms. The variable values save automatically when
you exit ModelSim. Some of the variables are modified by actions you take with menus or
windows (for example, resizing a window changes its geometry variable). Or, you can edit the
variables directly either from the prompt in the Transcript window or the Tools > Edit
Preferences menu item.
Customizing the Simulator GUI Layout
There are five predefined layout modes that the GUI will load dependent upon which part of the
simulation flow you are currently in. They include:
•
NoDesign — This layout is the default view when you first open the GUI or quit out of
an active simulation.
•
•
Simulate — This layout appears after you have begun a simulation with vsim.
•
VMgmt — This layout appears after you have loaded a dataset containing test plan
information.
Coverage — This layout appears after you have begun a simulation with the -coverage
switch or loaded a UCDB dataset.
These layout modes are fully customizable and the GUI stores your manipulations in the
.modelsim file (UNIX and Linux) or the registry (Windows) when you exit the simulation or
change to another layout mode. The types of manipulations that are stored include: showing,
hiding, moving, and resizing windows.
Layout Mode Loading Priority
The GUI stores your manipulations on a directory by directory basis and attempts to load a
layout mode in the following order:
1. Directory — The GUI attempts to load any manipulations for the current layout mode
based on your current working directory.
ModelSim SE GUI Reference Manual, v10.2c
293
GUI Customization
Customizing the Simulator GUI Layout
2. Last Used — If there is no layout related to your current working directory, the GUI
attempts to load your last manipulations for that layout mode, regardless of your
directory.
3. Default — If you have never manipulated a layout mode, or have deleted the .modelsim
file or the registry, the GUI will load the default appearance of the layout mode.
Configure Window Layouts Dialog Box
The Configure Window Layouts dialog box allows you to alter the default behavior of the GUI
layouts. You can display this dialog box by selecting the Layout > Configure menu item. The
elements of this dialog box include:
•
Specify a Layout to Use — This pane allows you to map which layout is used for the
four actions. Refer to the section Changing Layout Mode Behavior for additional
information.
•
Save window layout automatically — This option (on by default) instructs the GUI to
save any manipulations to the layout mode upon exit or changing the layout mode.
•
Save Window Layout by Current Directory — This option (on by default) instructs
the tool to save the final state of the GUI layout on a directory by directory basis. This
means that the next time you open the GUI from a given directory, the tool will load
your previous GUI settings.
•
Window Restore Properties Button— Opens the Window Restore Properties Dialog
Box. Refer to Configuring Default Windows for Restored Layouts for more information.
Creating a Custom Layout Mode
To create a custom layout, follow these steps:
1. Rearrange the GUI as you see fit.
2. Select Layout > Save Layout As.
This displays the Save Current Window Layout dialog box.
3. In the Save Layout As field, type in a new name for the layout mode.
4. Click OK.
The layout is saved to the .modelsim file or registry. You can then access this layout mode from
the Layout menu or the Layout toolbar.
Changing Layout Mode Behavior
To assign which predefined or custom layout appears in each mode, follow these steps:
294
ModelSim SE GUI Reference Manual, v10.2c
GUI Customization
Customizing the Simulator GUI Layout
1. Create your custom layouts as described in Creating a Custom Layout Mode.
2. Select Layout > Configure.
This displays the Configure Window Layouts Dialog Box.
3. Select which layout you want the GUI to load for each scenario. This behavior affects
the Layout Mode Loading Priority.
4. Click OK.
The layout assignment is saved to the .modelsim file or registry.
Resetting a Layout Mode to its Default
To get a layout back to the default arrangement, follow these steps:
1. Load the layout mode you want to reset via the Layout menu or the Layout toolbar.
2. Select Layout > Reset.
Deleting a Custom Layout Mode
To delete a custom layout, follow these steps:
1. Load a custom layout mode from the Layout menu or the Layout toolbar.
2. Select Layout > Delete.
Displays the Delete Custom Layout dialog box.
3. Select the custom layout you wish to delete.
4. Delete.
Configuring Default Windows for Restored Layouts
The Window Restore Properties Dialog Box allows you to specify which windows will be
restored when a layout is reloaded.
1. Select Layout > Configure to open the Configure Window Layouts dialog box.
2. Click the Window Restore Properties button to open the Window Restore Properties
dialog box
3. Select the windows you want to have opened when a new layout is loaded. Windows
that are not selected will not load until specified with the view command or by selecting
View > <window>.
ModelSim SE GUI Reference Manual, v10.2c
295
GUI Customization
Customizing the Simulator GUI Layout
You can also work with window layouts by specifying layout suppresstype <window>, layout
restoretype, or layout showsuppresstypes. Refer to the layout command for more
information.
Configuring the Column Layout
Some windows allow you to configure the column layout using the Configure Column Layout
dialog (Configure Column Layout Dialog).
Figure 6-1. Configure Column Layout Dialog
This dialog can also be opened by right-clicking a column heading and selecting Configure
Column Layout from the popup menu; or by selecting “Configure ColumnLayout” from the
drop-down list in the Column Layout Toolbar.
An asterisk (*) prefix and blue font indicate column layouts are in their default state and which
have been added or modified.
Click the Edit button to open the Edit Column Layout dialog, where you can add and remove
columns from the display and change their order (Figure 6-2).
296
ModelSim SE GUI Reference Manual, v10.2c
GUI Customization
User Defined Buttons and Menus
Figure 6-2. Edit Column Layout Dialog
Or, click the Create button to create a customized column layout for your application.
The Create Column Layout window allows you to select the columns that you want to
appear in the customized layout. For example, in Figure 6-3, we have created a Memory
Usage layout for the Ranked Profile window that includes only those columns related to
memory usage.
Figure 6-3. Create Column Layout Dialog
User Defined Buttons and Menus
You can create Tcl processes (procs) that add user-defined buttons and menus to the main
window of ModelSim. The Tcl procs are loaded after initialization by assigning them to the
ModelSim SE GUI Reference Manual, v10.2c
297
GUI Customization
User Defined Buttons and Menus
PrefMain(user_hook) preference variable. The procs must be saved in a modelsim.tcl file
located in the install directory for Windows platforms or in the directory from which ModelSim
is invoked for other platforms (refer to The modelsim.tcl File for more information). Buttons
are added to the Standard toolbar and menus are added to the main menu bar in the GUI
The following Tcl example demonstrates two procs that create a menu and two buttons and the
syntax for setting the procs with the PrefMain(user_hook) preference variable. Refer to
(Figure 6-4).
Figure 6-4. User-Defined Buttons and Menus
proc AddMyMenus {wname} {
global myglobalvar
set cmd1 "echo my_own_thing $wname"
set cmd2 "echo my_to_upper $wname"
set cmd3 "echo my_to_lower $wname"
#
#
add_menu
add_menuitem
add_separator
add_submenu
add_menuitem
add_menuitem
add_submenu
add_menucb
WinName
------$wname
$wname
$wname
$wname
$wname
$wname
$wname
$wname
Menu
-----------------usrMenu
usrMenu
usrMenu
usrMenu
usrMenu.changeCase
usrMenu.changeCase
usrMenu
usrMenu.vars
MenuItem label
-----------------
Command
----------------
"Do My Own Thing"
;#--------------changeCase
"To Upper"
"To Lower"
vars
"Feature One"
$cmd1
---------------$cmd2
$cmd3
-variable
myglobalvar
-onvalue 1
-offvalue 0
-indicatoron 1
\
\
\
\
\
}
proc my_buttons {args} {
add button "Run Long" "run 2 us"
add button "Run Short" "run 2 ns"
}
lappend PrefMain(user_hook) AddMyMenus my_buttons
The code above is available in the following modelsim.tcl file:
<install_dir>/examples/gui/addmenu/modelsim.tcl
298
ModelSim SE GUI Reference Manual, v10.2c
GUI Customization
User-Defined Radices
•
Menu proc
Adds a menu to the Main menu bar containing a top-level item labeled "Do My Own
Thing...", which prints "my_own_thing.signals." It adds a cascading submenu labeled
"changeCase" with two entries, "To Upper" and "To Lower", which echo
"my_to_upper" and "my_to_lower" respectively. The menu selection UserMenu >
Vars > Feature One sets a checkbox that controls the value of myglobalvar
(.signals:one).
•
Button proc
Adds two buttons to the Standard tool bar. "Run Long," runs the simulation for 2 us,
"Run Short," runs the simulation for 2 ns.
•
The line:
lappend PrefMain(user_hook) AddMyMenus my_buttons
appends the two procs AddMyMenus and my_buttons to the user_hook variable when
ModelSim is finished initializing. Multiple procs are specified as a space separated list.
User-Defined Radices
A user definable radix is used to map bit patterns to a set of enumeration labels. After defining a
new radix, the radix will be available for use in the List, Watch, and Wave windows or with the
examine command.
There are four commands used to manage user defined radices:
•
•
•
•
radix define
radix names
radix list
radix delete
Using the radix define Command
The radix define command is used to create or modify a radix. It must include a radix name and
a definition body, which consists of a list of number pattern, label pairs. Optionally, it may
include the -color argument for setting the radix color (see Example 6-2).
{
<numeric-value> <enum-label>,
<numeric-value> <enum-label>
-default <radix>
}
A <numeric-value> is any legitimate HDL integer numeric literal. To be more specific:
ModelSim SE GUI Reference Manual, v10.2c
299
GUI Customization
User-Defined Radices
<base>#<base-integer># --- <base> is 2, 8, 10, or 16
<base>"bit-value"
--- <base> is B, O, or X
<integer>
<size>'<base><number> --- <size> is an integer, <base> is b, d, o, or h.
Check the Verilog and VHDL LRMs for exact definitions of these numeric literals.
The comma (,) in the definition body is optional. The <enum-label> is any arbitrary string. It
should be quoted (""), especially if it contains spaces.
The -default entry is optional. If present, it defines the radix to use if a match is not found for a
given value. The -default entry can appear anywhere in the list, it does not have to be at the end.
Example 6-1 shows the radix define command used to create a radix called “States,” which
will display state values in the List, Watch, and Wave windows instead of numeric values.
Example 6-1. Using the radix define Command
radix define States
11'b00000000001
11'b00000000010
11'b00000000100
11'b00000001000
11'b00000010000
11'b00000100000
11'b00001000000
11'b00010000000
11'b00100000000
11'b01000000000
11'b10000000000
-default hex
}
{
"IDLE",
"CTRL",
"WT_WD_1",
"WT_WD_2",
"WT_BLK_1",
"WT_BLK_2",
"WT_BLK_3",
"WT_BLK_4",
"WT_BLK_5",
"RD_WD_1",
"RD_WD_2",
Figure 6-5 shows an FSM signal called /test-sm/sm_seq0/sm_0/state in the Wave window with
a binary radix and with the user-defined “States” radix (as defined in Example 6-1).
Figure 6-5. User-Defined Radix “States” in the Wave Window
Figure 6-6 shows an FSM signal called /test-sm/sm_seq0/sm_0/state in the List window with a
binary radix and with the user-defined “States” radix (as defined in Example 6-1)
300
ModelSim SE GUI Reference Manual, v10.2c
GUI Customization
User-Defined Radices
Figure 6-6. User-Defined Radix “States” in the List Window
Using radix define to Specify Radix Color
The following example illustrates how to use the radix define command to specify the radix
color:
Example 6-2. Using radix define to Specify Color
radix define States {
11'b00000000001 "IDLE" -color yellow,
11'b00000000010 "CTRL" -color #ffee00,
11'b00000000100 "WT_WD_1" -color orange,
11'b00000001000 "WT_WD_2" -color orange,
11'b00000010000 "WT_BLK_1",
11'b00000100000 "WT_BLK_2",
11'b00001000000 "WT_BLK_3",
11'b00010000000 "WT_BLK_4",
11'b00100000000 "WT_BLK_5",
11'b01000000000 "RD_WD_1" -color green,
11'b10000000000 "RD_WD_2" -color green,
-default hex
-defaultcolor white
}
If a pattern/label pair does not specify a color, the normal wave window colors will be used. If
the value of the waveform does not match any pattern, then -default <radix_type> and
-defaultcolor will be used.
To specify a range of values, wildcards may be specified for bits or characters of the value. The
wildcard character is '?', similar to the iteration character in a Verilog UDP, for example:
radix define {
6'b01??00 "Write" -color orange,
6'b10??00 "Read" -color green
}
In this example, the first pattern will match "010000", "010100", "011000", and "011100". In
case of overlaps, the first matching pattern is used, going from top to bottom.
ModelSim SE GUI Reference Manual, v10.2c
301
GUI Customization
User-Defined Radices
Setting Global Signal Radix
The Global Signal Radix feature allows you to set the radix for a selected signal or signals in the
active window and in other windows where the signal appears. The Global Signal Radix can be
set from the Locals, Objects, Schematic, or Wave windows as follows:
•
•
Select a signal or group of signals.
Right-click the selected signal(s) and click the following popup menu option:
o
Objects Window: Radix
o
Locals Window: Global Signal Radix
o
Wave Window: Radix > Global Signal Radix
o
Schematic Window: Edit > Global Signal Radix
This opens the Global Signal Radix dialog box (Figure 6-7), where you may select a
radix. This sets the radix for the selected signal(s) in the active window and every other
window where the signal appears.
Figure 6-7. Setting the Global Signal Radix
Setting a Fixed Point Radix
Fixed point types are used in VHDL and SystemC to represents non-integer numbers without
using a floating point format. ModelSim automatically recognizes VHDL sfixed and ufixeda
types as well as SystemC SC_FIXED and SC_UFIXED types and displays them correctly with
a fixed point format.
302
ModelSim SE GUI Reference Manual, v10.2c
GUI Customization
User-Defined Radices
In addition, a general purpose fixed point radix feature is available for displaying any vector,
regardless of type, in a fixed point format in the Wave window. You simply have to specify how
many bits to use as fraction bits from the whole vector.
With the Wave window active:
1. Select (LMB) a signal or signals in the Pathnames pane of the Wave window.
2. Right-click the selected signal(s) and select Radix > Fixed Point from the popup menu.
This opens the Fixed Point Radix dialog.
Figure 6-8. Fixed Point Radix Dialog
3. Type the number of bits you want to appear as the fraction and click OK.
ModelSim SE GUI Reference Manual, v10.2c
303
GUI Customization
User-Defined Radices
304
ModelSim SE GUI Reference Manual, v10.2c
Chapter 7
GUI Preferences
Simulator GUI Preferences
Simulator GUI preferences are stored by default either in the .modelsim file in your HOME
directory on UNIX/Linux platforms or the Registry on Windows platforms.
Setting Preference Variables from the GUI
To edit a variable value from the GUI, select Tools > Edit Preferences.
The dialog organizes preferences into two tab groups: By Window and By Name. The By
Window tab primarily allows you to change colors and fonts for various GUI objects. For
example, if you want to change the color of the text in the Source window, do the following:
1. Select "Source Windows" from the Window List column.
2. Select "Text" from the Source Color Scheme column.
ModelSim SE GUI Reference Manual, v10.2c
305
GUI Preferences
Simulator GUI Preferences
3. Click the type of text you want to change (Regular Text, Selected Text, Found Text, and
so forth) from the Colors area.
4. Click the “Foreground” or “Background” color block.
5. Select a color from the palette.
To change the font type and/or size of the window selected in the Windows List column, use the
Fonts section of the By Window tab that appears under “General Text Settings” (Figure 7-1).
Figure 7-1. Change Text Fonts for Selected Windows
You can also make global font changes to all GUI windows with the Fonts section of the By
Window tab (Figure 7-2).
306
ModelSim SE GUI Reference Manual, v10.2c
GUI Preferences
Simulator GUI Preferences
Figure 7-2. Making Global Font Changes
Table 7-1. Global Fonts
Global Font Name Description
fixedFont
for all text in Source window and Notepad display, and in all text
entry fields or boxes
footerFont
for all footer text that appears in footer of Main window and all
undocked windows
menuFont
for all menu text
textFont
for Transcript window text and text in list boxes
treeFont
for all text that appears in any window that displays a
hierarchical tree
The By Name tab lists every Tcl variable in a tree structure. The procedure for changing a Tcl
variable is:
1. Expand the tree.
2. Highlight a variable.
3. Click Change Value to edit the current value.
Clicking OK or Apply at the bottom of the Preferences dialog changes the variable, and the
change is saved when you exit ModelSim.
You can search for information in the By Name tab by using the the Find button. However, the
Find button will only search expanded preference items, therefore it is suggested that you click
the Expand All button before searching within this tab.
Setting Preference Variables from the Command Line
Use the Tcl set Command Syntax to customize preference variables from the Main window
command line. For example:
set <variable name> <variable value>
ModelSim SE GUI Reference Manual, v10.2c
307
GUI Preferences
Simulator GUI Preferences
Saving GUI Preferences
GUI preferences are saved automatically when you exit the tool.
If you prefer to store GUI preferences elsewhere, set the MODELSIM_PREFERENCES
environment variable to designate where these preferences are stored. Setting this variable
causes ModelSim to use a specified path and file instead of the default location. Here are some
additional points to keep in mind about this variable setting:
•
•
•
The file does not need to exist before setting the variable as ModelSim will initialize it.
If the file is read-only, ModelSim will not update or otherwise modify the file.
This variable may contain a relative pathname, in which case the file is relative to the
working directory at the time the tool is started.
The modelsim.tcl File
Previous versions saved user GUI preferences into a modelsim.tcl file. Current versions will still
read in a modelsim.tcl file if it exists. ModelSim searches for the file as follows:
•
use MODELSIM_TCL environment variable if it exists (if MODELSIM_TCL is a list
of files, each file is loaded in the order that it appears in the list); else
•
•
use ./modelsim.tcl; else
use $(HOME)/modelsim.tcl if it exists
Note that in versions 6.1 and later, ModelSim will save to the .modelsim file any variables it
reads in from a modelsim.tcl file (except for user_hook variables). The values from the
modelsim.tcl file will override like variables in the .modelsim file.
User_hook Variables
You can create Tcl processes (procs) that add persistent user-defined buttons and menus to the
main window of ModelSim. The Tcl procs are loaded after initialization by assigning them to
the PrefMain(user_hook) preference variable. The procs must be saved in a modelsim.tcl file
located in the install directory for Windows platforms or in the directory from which ModelSim
is invoked for other platforms (refer to The modelsim.tcl File for more information). Buttons
are added to the Standard toolbar and menus are added to the main menu bar in the GUI
The following Tcl example demonstrates two procs that create a menu and two buttons and the
syntax for setting the procs with the PrefMain(user_hook) preference variable. Refer to
(Figure 7-3).
308
ModelSim SE GUI Reference Manual, v10.2c
GUI Preferences
Simulator GUI Preferences
Figure 7-3. Persistent Buttons and Menus
proc AddMyMenus {wname} {
global myglobalvar
set cmd1 "echo my_own_thing $wname"
set cmd2 "echo my_to_upper $wname"
set cmd3 "echo my_to_lower $wname"
#
#
add_menu
add_menuitem
add_separator
add_submenu
add_menuitem
add_menuitem
add_submenu
add_menucb
WinName
------$wname
$wname
$wname
$wname
$wname
$wname
$wname
$wname
Menu
-----------------usrMenu
usrMenu
usrMenu
usrMenu
usrMenu.changeCase
usrMenu.changeCase
usrMenu
usrMenu.vars
MenuItem label
--------------------
Command
-------------
"Do My Own Thing..."
;#-----------------changeCase
"To Upper"
"To Lower"
vars
"Feature One"
$cmd1
------------$cmd2
$cmd3
-variable
myglobalvar
-onvalue 1
-offvalue 0
-indicatoron 1
}
proc my_buttons {args} {
add button "Run Long" "run 2 us"
add button "Run Short" "run 2 ns"
}
lappend PrefMain(user_hook) AddMyMenus my_buttons
•
Menu proc
Adds a menu to the Main menu bar containing a top-level item labeled "Do My Own
Thing...", which prints "my_own_thing.signals." It adds a cascading submenu labeled
"changeCase" with two entries, "To Upper" and "To Lower", which echo
"my_to_upper" and "my_to_lower" respectively. The menu selection UserMenu >
Vars > Feature One sets a checkbox that controls the value of myglobalvar
(.signals:one).
•
Button proc
ModelSim SE GUI Reference Manual, v10.2c
309
GUI Preferences
GUI Preference Variables
Adds two buttons to the Standard tool bar. The first, "Run Long," runs the simulation for
2 us, the second, "Run Short," runs the simulation for 2 ns.
•
The line:
lappend PrefMain(user_hook) AddMyMenus my_buttons
appends the two procs AddMyMenus and my_buttons to the user_hook variable when
ModelSim is finished initializing. Multiple procs are specified as a space separated list.
This example is available in the following modelsim.tcl file:
<install_dir>/examples/gui/addmenu/modelsim.tcl
GUI Preference Variables
Wave Window Variables
The LogicStyleTable combined with the ListTranslateTable define how single bit waveforms
are displayed in the Wave window. The single value is first mapped into one of nine (9)
possible states: U, 0, 1, X, Z, W, H, L, or '-' (Don't Care). Then the entry for the corresponding
value in the LogicStyleTable is used to determine what is drawn in the Wave window. The line
style is either Solid or DoubleDash. The line is drawn in the color specified. Lastly, the line is
drawn at the top of the row (2), the middle of the row (1), or the bottom of the row (0).
The mapping of bit values to the 9 states is specified in the ListTranslateTable. The table is
searched to find a matching value. When a match is found, the corresponding table entry
defines the 9 state value used to define the style.
Table 7-2. Default ListTranslateTable Values
310
Mapped State
Bit Value
LOGIC_U
'U'
LOGIC_X
'X' 'x'
LOGIC_0
'0' FALSE
LOGIC_1
'1' TRUE
LOGIC_Z
'Z' 'z'
LOGIC_W
'W'
LOGIC_L
'L'
LOGIC_H
'H'
LOGIC_DC
'-'
ModelSim SE GUI Reference Manual, v10.2c
GUI Preferences
GUI Preference Variables
Table 7-3. Default LogicStyleTable Values
Mapped State
Line Style
Color
Row Position
LOGIC_U
Solid
red
1
LOGIC_X
Solid
red
1
LOGIC_0
Solid
green
0
LOGIC_1
Solid
green
2
LOGIC_Z
Solid
blue
1
LOGIC_W
DoubleDash
red
1
LOGIC_L
DoubleDash
grey90
0
LOGIC_H
DoubleDash
grey90
2
LOGIC_DC
DoubleDash
blue
1
Figure 7-4. Modifying Signal Display Attributes in the Wave Window
ModelSim SE GUI Reference Manual, v10.2c
311
GUI Preferences
GUI Preference Variables
Modifying Wave Window Variables from the Command
Line
Both the LogicStyleTable and the ListTranslateTable variables can be modified using the Tcl
set command. Changes are automatically saved in the preference file ($HOME/.modelsim on
UNIX/Linux platforms or the Registry on Windows platforms).
The Tcl set command equivalent of the ListTranslateTable is:
set
set
set
set
set
set
set
set
set
ListTranslateTable(LOGIC_U)
ListTranslateTable(LOGIC_X)
ListTranslateTable(LOGIC_0)
ListTranslateTable(LOGIC_1)
ListTranslateTable(LOGIC_Z)
ListTranslateTable(LOGIC_W)
ListTranslateTable(LOGIC_L)
ListTranslateTable(LOGIC_H)
ListTranslateTable(LOGIC_DC)
{'U'}
{'X' 'x'}
{'0' FALSE}
{'1' TRUE}
{'Z' 'z'}
{'W'}
{'L'}
{'H'}
{'-'}
The Tcl set command equivalent of the LogicStyleTable is:
set
set
set
set
set
set
set
set
set
312
LogicStyleTable(LOGIC_U)
LogicStyleTable(LOGIC_X)
LogicStyleTable(LOGIC_0)
LogicStyleTable(LOGIC_1)
LogicStyleTable(LOGIC_Z)
LogicStyleTable(LOGIC_W)
LogicStyleTable(LOGIC_L)
LogicStyleTable(LOGIC_H)
LogicStyleTable(LOGIC_DC)
{Solid
{Solid
{Solid
{Solid
{Solid
{DoubleDash
{DoubleDash
{DoubleDash
{DoubleDash
red
red
green
green
blue
red
grey90
grey90
blue
1}
1}
0}
2}
1}
1}
0}
2}
1}
ModelSim SE GUI Reference Manual, v10.2c
A B C D E F G H I J K L M N O P Q R S T U V W X Y Z
Index
Index
—A—
Active Processes pane, 196
<Italic>see also windows, Active Processes
pane
Active window, selecting, 18
Add bookmark
source window, 236
Analog sidebar, 275
Ascending expressions
ATV window, 53
Assertion directives
report on active, 87
Assertion expressions
ascending/descending, 53
Assertions
filtering, 244
Assertions window, 86
column descriptions, 86
ATV
ascending expressions, 53
graphic symbols, 93
toolbar, 53, 54
view grid icon, 53
Autofill text entry
find, 26
Automatic command help, 257
—B—
base (radix)
List window, 159
Bookmarks
clear all in Source window, 236
Source window, 236
break
stop simulation run, 57, 68
Breakpoints
command execution, 233
conditional, 233
ModelSim SE GUI Reference Manual, v10.2c
use of SystemVerilog keyword this,
233
deleting, 230
edit, 231
in SystemVerilog class methods, 233
load, 233
save, 233
set with GUI, 229
Source window, viewing in, 215
Bubble diagram
using the mouse, 136
Buttons
user-defined, 297
buttons
user-defined, 308
—C—
Call Stack pane, 95
Clear bookmarks
source window, 236
Click and sprout
schematic window
incremental view, 206
Clock change
sampling signals at, 166
Clocking block inout display, 278
Code Coverage, 251
Instance Coverage pane, 142
missed coverage, 108
Source window data, 220
toggle details, 117
Color
radix
example, 301
colorization, in Source window, 237
Colorize
Transcript window, 255
Column layout
configure, 56, 296
create, 297
313
A B C D E F G H I J K L M N O P Q R S T U V W X Y Z
edit, 296
Combine Selected Signals dialog box, 152
Combine signals, 162
Command completion, 257
compare, 162
Compare signal
virtual, 162
Conditional breakpoints, 233
use of SystemVerilog keyword this, 233
conditional breakpoints
use of keyword this, 233
Configure
column layout, 56, 296
Contains, 25, 28, 29
Cover directives
coverage percentage, 111
display options, 112
recursive display mode, 113
show all contexts display mode, 113
Cover Directives tab
column descriptions, 111
Cover Directives window, 111
Coverage
directive, Analysis pane, 111
Coverage Details window, 106, 114
Coverage numbers, mismatching, 222
Covergroups window, 119
column descriptions, 120
Create column layout, 297
Creating do file, 24, 162
Cursor linking, 276
Custom column layout, 297
Customize
columns, 56, 296
Customize GUI
fonts, 306
customizing
via preference variables, 305
—D—
Dashed signal lines, 275
Dataflow window, 124
<Italic>see also windows, Dataflow
window
Deltas
in List window, 164
314
descriptions of HDL items, 235
Design object icons, described, 37
Directive coverage, 111
Display mode
recursive, 113
show all contexts, 113
Display options
cover directives, 112
DO files (macros)
creating from a saved transcript, 254
—E—
Edit
breakpoints, 231
column layout, 296
Editing
in notepad windows, 285
in the Main window, 285
in the Source window, 285
EOS Note column
assertion directives, 87
Expanded Time
viewing in List window, 153
Expression Builder, 156
configuring a List trigger with, 165
saving expressions to Tcl variable, 158
Expressions
ascending/descending, 53
—F—
F8 function key, 287
File-line breakpoints, 229
edit, 231
Files window, 129, 251
Filter, 28
assertions, 244
subprograms, 244
Filtering
Contains field, 25, 29
signals in Objects window, 191
Find, 25
in Structure window, 242
inline search bar, 236, 256
prefill text entry field, 26
Fixed point radix, 302
FocusFollowsMouse, 18
ModelSim SE GUI Reference Manual, v10.2c
A B C D E F G H I J K L M N O P Q R S T U V W X Y Z
Fonts
scaling, 25
fonts
setting preferences, 306
Format
saving/restoring, 24, 162
signal
Wave window, 274
Format file
Wave window, 161
Function call, debugging, 95
—G—
Global GUI changes
fonts, 306
Global signal radix, 191, 273, 302
Glob-style, 29
Graphic symbols
ATV window, 93
Grid
ATV window, 53
GUI preferences
fonts, 306
GUI_expression_format
GUI expression builder, 156
—H—
Help
command help, 257
Highlighting, in Source window, 237
Highlights
in Source window, 219
Hypertext link, 215
—I—
Icons
shapes and meanings, 37
window based, 278
incremental (xxxIncr) coverage, in Browser
columns, 261
Incremental view
click and sprout, 206
schematic window
adding objects, 208
inline search bar, 236, 256
ModelSim SE GUI Reference Manual, v10.2c
—K—
Keyboard shortcuts
user defined, 282
keyboard shortcuts
List window, 289
Main window, 285
Source window, 285
Wave window, 289
—L—
Language templates, 226
Layout
columns, 56, 296
Link cursors, 276
List pane
<Italic>see also pane, List pane
List window, 150
expanded time viewing, 153
setting triggers, 165
Load
breakpoints, 233
Locals window, 170
<Italic>see also windows, Locals window
—M—
Macros (DO files)
creating from a saved transcript, 254
Memories
navigation, 173
save to WLF file, 179
saving formats, 179
selecting memory instances, 178
viewing contents, 178
viewing multiple instances, 178
Memory tab
memories you can view, 176
Menus
user-defined, 297
menus
user-defined, 308
Message Viewer Display Options dialog box,
188
Message Viewer tab, 182
Messages, 182
Mismatching coverage numbers, 222
Missed Coverage pane, 108
315
A B C D E F G H I J K L M N O P Q R S T U V W X Y Z
MODELSIM_PREFERENCES variable, 308
modelsim.tcl, 308
user_defined menus, 297, 308
user-defined buttons, 297, 308
mouse shortcuts
Main window, 285
Source window, 285
Wave window, 289
msgmode variable, 182
—N—
Nets
Dataflow window, displaying in, 124
values of
displaying in Objects window, 190
waveforms, viewing, 271
Notepad windows, text editing, 285
-notrigger argument, 166
—O—
Objects window, 190
—P—
preference variables
editing, 305
saving, 305
Preferences
schematic, 210
preferences
saving, 305
Prefill text entry
find, 26
PrefMemory(ExpandPackedMem) variable,
178
—R—
Radix
change in Watch pane, 269
color
example, 301
List window, 159
set globally, 191, 273, 302
setting fixed point, 302
setting for Objects window, 191, 302
user-defined, 299
definition body, 299
radix
316
SystemVerilog types, 273
Radix define command
setting radix color, 301
Recursive display mode, 113
Registers
values of
displaying in Objects window, 190
waveforms, viewing, 271
Regular-expression, 29
restart command
in GUI, 46
Restoring
window format, 24, 162
—S—
Save
breakpoints, 233
saveLines preference variable, 255
Saving
window format, 24, 162
Scaling fonts, 25
Schematic
click and sprout, 206
display preferences, 210
views, 206
Schematic window
add objects to incr view, 208
Search
in Structure window, 242
inline search bar
Source window, 236
Transcript, 256
prefill text entry field, 26
Search bar, 25
Searching
Expression Builder, 156
Setting radix
fixed point, 302
Shared library
building in SystemC, 45
Shortcuts
text editing, 285
shortcuts
List window, 289
Main window, 285
Source window, 285
ModelSim SE GUI Reference Manual, v10.2c
A B C D E F G H I J K L M N O P Q R S T U V W X Y Z
Wave window, 289
Show All Contexts display mode, 113
Signal format
Wave window, 274
Signal radix
for Objects window
Objects window
setting signal radix, 191, 302
set globally, 191, 273, 302
Signals
combine into bus, 162
dashed, 275
Dataflow window, displaying in, 124
sampling at clock change, 166
types, selecting which to view, 191
values of
displaying in Objects window, 190
waveforms, viewing, 271
signals
Filtering in the Objects window, 191
Simulating
viewing results in List window, 150
Source
textual connectivity, 225
Source annotation, 223
Annotation, 223
source files
Debug, 223
Source highlighting, customizing, 237
Source window, 215
clear highlights, 219
code coverage data, 220
colorization, 237
inline search bar, 236
tab stops in, 237
<Italic>see also windows, Source window
Status bar
Main window, 36
Structure window
find item, 242
Subprograms
filtering, 244
symbols
ATV window, 93
Syntax highlighting, 237
ModelSim SE GUI Reference Manual, v10.2c
SystemVerilog, 233
class methods, conditional breakpoints, 233
SystemVerilog types
radix, 273
—T—
tab stops
Source window, 237
Tcl
preference variables, 305
Text
filtering, 28
Text editing, 285
Textual connectivity
in the Source window, 225
Toolbar
ATV, 53
filter, 28
toolbar
ATV, 54
Transcript
colorize, 255
command help, 257
disable file creation, 256
inline search bar, 256
saving, 254
saving as a DO file, 254
Transcript window
changing buffer size, 255
changing line count, 255
Triggers
in List window, 162
Triggers, in the List window, 165
—U—
user_hook variable, 297, 308
User-defined bus, 162
User-defined radix, 299
definition body, 299
—V—
Values
of HDL items, 235
Variables
values of
displaying in Objects window, 190
317
A B C D E F G H I J K L M N O P Q R S T U V W X Y Z
Verilog
language templates, 226
source code viewing, 215
VHDL
language templates, 226
source code viewing, 215
View grid
ATV window, 53
viewing, 182
Viewing files for the simulation, 129
Views
schematic, 206
Virtual signal, 162
Variables window
VHDL and Verilog items viewed in,
170
Wave window, 271
save format file, 161
windows
Main window
text editing, 285
Source window
text editing, 285
WLF file
saving memories to, 179
write format restart, 24, 162
—W—
Wave window, 271
dashed signal lines, 275
format signal, 274
saving layout, 161
<Italic>see also windows, Wave window
Waveforms
viewing, 271
Window format
saving/restoring, 24, 162
Windows
Active Processes pane, 196
Assertions, 86
Dataflow window, 124
List window, 150
display properties of, 159
formatting HDL items, 159
setting triggers, 162, 165
Locals window, 170
Main window
status bar, 36
time and delta display, 36
Objects window, 190
Process window
specifying next process to be executed,
111
viewing processing in the region, 111
Signals window
VHDL and Verilog items viewed in,
190
Source window, 215
viewing HDL source code, 215
318
ModelSim SE GUI Reference Manual, v10.2c
End-User License Agreement
The latest version of the End-User License Agreement is available on-line at:
www.mentor.com/eula
IMPORTANT INFORMATION
USE OF ALL SOFTWARE IS SUBJECT TO LICENSE RESTRICTIONS. CAREFULLY READ THIS LICENSE
AGREEMENT BEFORE USING THE PRODUCTS. USE OF SOFTWARE INDICATES CUSTOMER’S
COMPLETE AND UNCONDITIONAL ACCEPTANCE OF THE TERMS AND CONDITIONS SET FORTH IN
THIS AGREEMENT. ANY ADDITIONAL OR DIFFERENT PURCHASE ORDER TERMS AND CONDITIONS
SHALL NOT APPLY.
END-USER LICENSE AGREEMENT (“Agreement”)
This is a legal agreement concerning the use of Software (as defined in Section 2) and hardware (collectively “Products”)
between the company acquiring the Products (“Customer”), and the Mentor Graphics entity that issued the
corresponding quotation or, if no quotation was issued, the applicable local Mentor Graphics entity (“Mentor
Graphics”). Except for license agreements related to the subject matter of this license agreement which are physically
signed by Customer and an authorized representative of Mentor Graphics, this Agreement and the applicable quotation
contain the parties’ entire understanding relating to the subject matter and supersede all prior or contemporaneous
agreements. If Customer does not agree to these terms and conditions, promptly return or, in the case of Software
received electronically, certify destruction of Software and all accompanying items within five days after receipt of
Software and receive a full refund of any license fee paid.
1.
ORDERS, FEES AND PAYMENT.
1.1. To the extent Customer (or if agreed by Mentor Graphics, Customer’s appointed third party buying agent) places and
Mentor Graphics accepts purchase orders pursuant to this Agreement (“Order(s)”), each Order will constitute a contract
between Customer and Mentor Graphics, which shall be governed solely and exclusively by the terms and conditions of
this Agreement, any applicable addenda and the applicable quotation, whether or not these documents are referenced on the
Order. Any additional or conflicting terms and conditions appearing on an Order or presented via any electronic portal or
other automated order management system will not be effective unless agreed in writing by an authorized representative of
Customer and Mentor Graphics.
1.2. Amounts invoiced will be paid, in the currency specified on the applicable invoice, within 30 days from the date of such
invoice. Any past due invoices will be subject to the imposition of interest charges in the amount of one and one-half
percent per month or the applicable legal rate currently in effect, whichever is lower. Prices do not include freight,
insurance, customs duties, taxes or other similar charges, which Mentor Graphics will state separately in the applicable
invoice(s). Unless timely provided with a valid certificate of exemption or other evidence that items are not taxable, Mentor
Graphics will invoice Customer for all applicable taxes including, but not limited to, VAT, GST, sales tax, consumption tax
and service tax. Customer will make all payments free and clear of, and without reduction for, any withholding or other
taxes; any such taxes imposed on payments by Customer hereunder will be Customer’s sole responsibility. If Customer
appoints a third party to place purchase orders and/or make payments on Customer’s behalf, Customer shall be liable for
payment under Orders placed by such third party in the event of default.
1.3. All Products are delivered FCA factory (Incoterms 2010), freight prepaid and invoiced to Customer, except Software
delivered electronically, which shall be deemed delivered when made available to Customer for download. Mentor
Graphics retains a security interest in all Products delivered under this Agreement, to secure payment of the purchase price
of such Products, and Customer agrees to sign any documents that Mentor Graphics determines to be necessary or
convenient for use in filing or perfecting such security interest. Mentor Graphics’ delivery of Software by electronic means
is subject to Customer’s provision of both a primary and an alternate e-mail address.
2.
GRANT OF LICENSE. The software installed, downloaded, or otherwise acquired by Customer under this Agreement,
including any updates, modifications, revisions, copies, documentation and design data (“Software”) are copyrighted, trade
secret and confidential information of Mentor Graphics or its licensors, who maintain exclusive title to all Software and retain
all rights not expressly granted by this Agreement. Mentor Graphics grants to Customer, subject to payment of applicable
license fees, a nontransferable, nonexclusive license to use Software solely: (a) in machine-readable, object-code form (except
as provided in Subsection 5.2); (b) for Customer’s internal business purposes; (c) for the term of the license; and (d) on the
computer hardware and at the site authorized by Mentor Graphics. A site is restricted to a one-half mile (800 meter) radius.
Customer may have Software temporarily used by an employee for telecommuting purposes from locations other than a
Customer office, such as the employee’s residence, an airport or hotel, provided that such employee’s primary place of
employment is the site where the Software is authorized for use. Mentor Graphics’ standard policies and programs, which vary
depending on Software, license fees paid or services purchased, apply to the following: (a) relocation of Software; (b) use of
Software, which may be limited, for example, to execution of a single session by a single user on the authorized hardware or for
a restricted period of time (such limitations may be technically implemented through the use of authorization codes or similar
devices); and (c) support services provided, including eligibility to receive telephone support, updates, modifications, and
revisions. For the avoidance of doubt, if Customer provides any feedback or requests any change or enhancement to Products,
whether in the course of receiving support or consulting services, evaluating Products, performing beta testing or otherwise, any
inventions, product improvements, modifications or developments made by Mentor Graphics (at Mentor Graphics’ sole
discretion) will be the exclusive property of Mentor Graphics.
3.
ESC SOFTWARE. If Customer purchases a license to use development or prototyping tools of Mentor Graphics’ Embedded
Software Channel (“ESC”), Mentor Graphics grants to Customer a nontransferable, nonexclusive license to reproduce and
distribute executable files created using ESC compilers, including the ESC run-time libraries distributed with ESC C and C++
compiler Software that are linked into a composite program as an integral part of Customer’s compiled computer program,
provided that Customer distributes these files only in conjunction with Customer’s compiled computer program. Mentor
Graphics does NOT grant Customer any right to duplicate, incorporate or embed copies of Mentor Graphics’ real-time operating
systems or other embedded software products into Customer’s products or applications without first signing or otherwise
agreeing to a separate agreement with Mentor Graphics for such purpose.
4.
BETA CODE.
4.1. Portions or all of certain Software may contain code for experimental testing and evaluation (which may be either alpha or
beta, collectively “Beta Code”), which may not be used without Mentor Graphics’ explicit authorization. Upon Mentor
Graphics’ authorization, Mentor Graphics grants to Customer a temporary, nontransferable, nonexclusive license for
experimental use to test and evaluate the Beta Code without charge for a limited period of time specified by Mentor
Graphics. This grant and Customer’s use of the Beta Code shall not be construed as marketing or offering to sell a license
to the Beta Code, which Mentor Graphics may choose not to release commercially in any form.
4.2. If Mentor Graphics authorizes Customer to use the Beta Code, Customer agrees to evaluate and test the Beta Code under
normal conditions as directed by Mentor Graphics. Customer will contact Mentor Graphics periodically during Customer’s
use of the Beta Code to discuss any malfunctions or suggested improvements. Upon completion of Customer’s evaluation
and testing, Customer will send to Mentor Graphics a written evaluation of the Beta Code, including its strengths,
weaknesses and recommended improvements.
4.3. Customer agrees to maintain Beta Code in confidence and shall restrict access to the Beta Code, including the methods and
concepts utilized therein, solely to those employees and Customer location(s) authorized by Mentor Graphics to perform
beta testing. Customer agrees that any written evaluations and all inventions, product improvements, modifications or
developments that Mentor Graphics conceived or made during or subsequent to this Agreement, including those based
partly or wholly on Customer’s feedback, will be the exclusive property of Mentor Graphics. Mentor Graphics will have
exclusive rights, title and interest in all such property. The provisions of this Subsection 4.3 shall survive termination of
this Agreement.
5.
RESTRICTIONS ON USE.
5.1. Customer may copy Software only as reasonably necessary to support the authorized use. Each copy must include all
notices and legends embedded in Software and affixed to its medium and container as received from Mentor Graphics. All
copies shall remain the property of Mentor Graphics or its licensors. Customer shall maintain a record of the number and
primary location of all copies of Software, including copies merged with other software, and shall make those records
available to Mentor Graphics upon request. Customer shall not make Products available in any form to any person other
than Customer’s employees and on-site contractors, excluding Mentor Graphics competitors, whose job performance
requires access and who are under obligations of confidentiality. Customer shall take appropriate action to protect the
confidentiality of Products and ensure that any person permitted access does not disclose or use Products except as
permitted by this Agreement. Customer shall give Mentor Graphics written notice of any unauthorized disclosure or use of
the Products as soon as Customer becomes aware of such unauthorized disclosure or use. Except as otherwise permitted for
purposes of interoperability as specified by applicable and mandatory local law, Customer shall not reverse-assemble,
reverse-compile, reverse-engineer or in any way derive any source code from Software. Log files, data files, rule files and
script files generated by or for the Software (collectively “Files”), including without limitation files containing Standard
Verification Rule Format (“SVRF”) and Tcl Verification Format (“TVF”) which are Mentor Graphics’ proprietary
syntaxes for expressing process rules, constitute or include confidential information of Mentor Graphics. Customer may
share Files with third parties, excluding Mentor Graphics competitors, provided that the confidentiality of such Files is
protected by written agreement at least as well as Customer protects other information of a similar nature or importance,
but in any case with at least reasonable care. Customer may use Files containing SVRF or TVF only with Mentor Graphics
products. Under no circumstances shall Customer use Software or Files or allow their use for the purpose of developing,
enhancing or marketing any product that is in any way competitive with Software, or disclose to any third party the results
of, or information pertaining to, any benchmark.
5.2. If any Software or portions thereof are provided in source code form, Customer will use the source code only to correct
software errors and enhance or modify the Software for the authorized use. Customer shall not disclose or permit disclosure
of source code, in whole or in part, including any of its methods or concepts, to anyone except Customer’s employees or
on-site contractors, excluding Mentor Graphics competitors, with a need to know. Customer shall not copy or compile
source code in any manner except to support this authorized use.
5.3. Customer may not assign this Agreement or the rights and duties under it, or relocate, sublicense or otherwise transfer the
Products, whether by operation of law or otherwise (“Attempted Transfer”), without Mentor Graphics’ prior written
consent and payment of Mentor Graphics’ then-current applicable relocation and/or transfer fees. Any Attempted Transfer
without Mentor Graphics’ prior written consent shall be a material breach of this Agreement and may, at Mentor Graphics’
option, result in the immediate termination of the Agreement and/or the licenses granted under this Agreement. The terms
of this Agreement, including without limitation the licensing and assignment provisions, shall be binding upon Customer’s
permitted successors in interest and assigns.
5.4. The provisions of this Section 5 shall survive the termination of this Agreement.
6.
SUPPORT SERVICES. To the extent Customer purchases support services, Mentor Graphics will provide Customer with
updates and technical support for the Products, at the Customer site(s) for which support is purchased, in accordance with
Mentor Graphics’ then current End-User Support Terms located at http://supportnet.mentor.com/about/legal/.
7.
LIMITED WARRANTY.
7.1. Mentor Graphics warrants that during the warranty period its standard, generally supported Products, when properly
installed, will substantially conform to the functional specifications set forth in the applicable user manual. Mentor
Graphics does not warrant that Products will meet Customer’s requirements or that operation of Products will be
uninterrupted or error free. The warranty period is 90 days starting on the 15th day after delivery or upon installation,
whichever first occurs. Customer must notify Mentor Graphics in writing of any nonconformity within the warranty period.
For the avoidance of doubt, this warranty applies only to the initial shipment of Software under an Order and does not
renew or reset, for example, with the delivery of (a) Software updates or (b) authorization codes or alternate Software under
a transaction involving Software re-mix. This warranty shall not be valid if Products have been subject to misuse,
unauthorized modification, improper installation or Customer is not in compliance with this Agreement. MENTOR
GRAPHICS’ ENTIRE LIABILITY AND CUSTOMER’S EXCLUSIVE REMEDY SHALL BE, AT MENTOR
GRAPHICS’ OPTION, EITHER (A) REFUND OF THE PRICE PAID UPON RETURN OF THE PRODUCTS TO
MENTOR GRAPHICS OR (B) MODIFICATION OR REPLACEMENT OF THE PRODUCTS THAT DO NOT MEET
THIS LIMITED WARRANTY. MENTOR GRAPHICS MAKES NO WARRANTIES WITH RESPECT TO:
(A) SERVICES; (B) PRODUCTS PROVIDED AT NO CHARGE; OR (C) BETA CODE; ALL OF WHICH ARE
PROVIDED “AS IS.”
7.2. THE WARRANTIES SET FORTH IN THIS SECTION 7 ARE EXCLUSIVE. NEITHER MENTOR GRAPHICS NOR
ITS LICENSORS MAKE ANY OTHER WARRANTIES EXPRESS, IMPLIED OR STATUTORY, WITH RESPECT TO
PRODUCTS PROVIDED UNDER THIS AGREEMENT. MENTOR GRAPHICS AND ITS LICENSORS
SPECIFICALLY DISCLAIM ALL IMPLIED WARRANTIES OF MERCHANTABILITY, FITNESS FOR A
PARTICULAR PURPOSE AND NON-INFRINGEMENT OF INTELLECTUAL PROPERTY.
8.
LIMITATION OF LIABILITY. EXCEPT WHERE THIS EXCLUSION OR RESTRICTION OF LIABILITY WOULD BE
VOID OR INEFFECTIVE UNDER APPLICABLE LAW, IN NO EVENT SHALL MENTOR GRAPHICS OR ITS
LICENSORS BE LIABLE FOR INDIRECT, SPECIAL, INCIDENTAL, OR CONSEQUENTIAL DAMAGES (INCLUDING
LOST PROFITS OR SAVINGS) WHETHER BASED ON CONTRACT, TORT OR ANY OTHER LEGAL THEORY, EVEN
IF MENTOR GRAPHICS OR ITS LICENSORS HAVE BEEN ADVISED OF THE POSSIBILITY OF SUCH DAMAGES. IN
NO EVENT SHALL MENTOR GRAPHICS’ OR ITS LICENSORS’ LIABILITY UNDER THIS AGREEMENT EXCEED
THE AMOUNT RECEIVED FROM CUSTOMER FOR THE HARDWARE, SOFTWARE LICENSE OR SERVICE GIVING
RISE TO THE CLAIM. IN THE CASE WHERE NO AMOUNT WAS PAID, MENTOR GRAPHICS AND ITS LICENSORS
SHALL HAVE NO LIABILITY FOR ANY DAMAGES WHATSOEVER. THE PROVISIONS OF THIS SECTION 8 SHALL
SURVIVE THE TERMINATION OF THIS AGREEMENT.
9.
HAZARDOUS APPLICATIONS. CUSTOMER ACKNOWLEDGES IT IS SOLELY RESPONSIBLE FOR TESTING ITS
PRODUCTS USED IN APPLICATIONS WHERE THE FAILURE OR INACCURACY OF ITS PRODUCTS MIGHT
RESULT IN DEATH OR PERSONAL INJURY (“HAZARDOUS APPLICATIONS”). EXCEPT TO THE EXTENT THIS
EXCLUSION OR RESTRICTION OF LIABILITY WOULD BE VOID OR INEFFECTIVE UNDER APPLICABLE LAW, IN
NO EVENT SHALL MENTOR GRAPHICS OR ITS LICENSORS BE LIABLE FOR ANY DAMAGES RESULTING FROM
OR IN CONNECTION WITH THE USE OF MENTOR GRAPHICS PRODUCTS IN OR FOR HAZARDOUS
APPLICATIONS. THE PROVISIONS OF THIS SECTION 9 SHALL SURVIVE THE TERMINATION OF THIS
AGREEMENT.
10. INDEMNIFICATION. CUSTOMER AGREES TO INDEMNIFY AND HOLD HARMLESS MENTOR GRAPHICS AND
ITS LICENSORS FROM ANY CLAIMS, LOSS, COST, DAMAGE, EXPENSE OR LIABILITY, INCLUDING
ATTORNEYS’ FEES, ARISING OUT OF OR IN CONNECTION WITH THE USE OF MENTOR GRAPHICS PRODUCTS
IN OR FOR HAZARDOUS APPLICATIONS. THE PROVISIONS OF THIS SECTION 10 SHALL SURVIVE THE
TERMINATION OF THIS AGREEMENT.
11. INFRINGEMENT.
11.1. Mentor Graphics will defend or settle, at its option and expense, any action brought against Customer in the United States,
Canada, Japan, or member state of the European Union which alleges that any standard, generally supported Product
acquired by Customer hereunder infringes a patent or copyright or misappropriates a trade secret in such jurisdiction.
Mentor Graphics will pay costs and damages finally awarded against Customer that are attributable to such action.
Customer understands and agrees that as conditions to Mentor Graphics’ obligations under this section Customer must:
(a) notify Mentor Graphics promptly in writing of the action; (b) provide Mentor Graphics all reasonable information and
assistance to settle or defend the action; and (c) grant Mentor Graphics sole authority and control of the defense or
settlement of the action.
11.2. If a claim is made under Subsection 11.1 Mentor Graphics may, at its option and expense: (a) replace or modify the Product
so that it becomes noninfringing; (b) procure for Customer the right to continue using the Product; or (c) require the return
of the Product and refund to Customer any purchase price or license fee paid, less a reasonable allowance for use.
11.3. Mentor Graphics has no liability to Customer if the action is based upon: (a) the combination of Software or hardware with
any product not furnished by Mentor Graphics; (b) the modification of the Product other than by Mentor Graphics; (c) the
use of other than a current unaltered release of Software; (d) the use of the Product as part of an infringing process; (e) a
product that Customer makes, uses, or sells; (f) any Beta Code or Product provided at no charge; (g) any software provided
by Mentor Graphics’ licensors who do not provide such indemnification to Mentor Graphics’ customers; or
(h) infringement by Customer that is deemed willful. In the case of (h), Customer shall reimburse Mentor Graphics for its
reasonable attorney fees and other costs related to the action.
11.4. THIS SECTION 11 IS SUBJECT TO SECTION 8 ABOVE AND STATES THE ENTIRE LIABILITY OF MENTOR
GRAPHICS AND ITS LICENSORS, AND CUSTOMER’S SOLE AND EXCLUSIVE REMEDY, FOR DEFENSE,
SETTLEMENT AND DAMAGES, WITH RESPECT TO ANY ALLEGED PATENT OR COPYRIGHT
INFRINGEMENT OR TRADE SECRET MISAPPROPRIATION BY ANY PRODUCT PROVIDED UNDER THIS
AGREEMENT.
12. TERMINATION AND EFFECT OF TERMINATION.
12.1. If a Software license was provided for limited term use, such license will automatically terminate at the end of the
authorized term. Mentor Graphics may terminate this Agreement and/or any license granted under this Agreement
immediately upon written notice if Customer: (a) exceeds the scope of the license or otherwise fails to comply with the
licensing or confidentiality provisions of this Agreement, or (b) becomes insolvent, files a bankruptcy petition, institutes
proceedings for liquidation or winding up or enters into an agreement to assign its assets for the benefit of creditors. For
any other material breach of any provision of this Agreement, Mentor Graphics may terminate this Agreement and/or any
license granted under this Agreement upon 30 days written notice if Customer fails to cure the breach within the 30 day
notice period. Termination of this Agreement or any license granted hereunder will not affect Customer’s obligation to pay
for Products shipped or licenses granted prior to the termination, which amounts shall be payable immediately upon the
date of termination.
12.2. Upon termination of this Agreement, the rights and obligations of the parties shall cease except as expressly set forth in this
Agreement. Upon termination, Customer shall ensure that all use of the affected Products ceases, and shall return hardware
and either return to Mentor Graphics or destroy Software in Customer’s possession, including all copies and
documentation, and certify in writing to Mentor Graphics within ten business days of the termination date that Customer no
longer possesses any of the affected Products or copies of Software in any form.
13. EXPORT. The Products provided hereunder are subject to regulation by local laws and United States (“U.S.”) government
agencies, which prohibit export, re-export or diversion of certain products, information about the products, and direct or indirect
products thereof, to certain countries and certain persons. Customer agrees that it will not export or re-export Products in any
manner without first obtaining all necessary approval from appropriate local and U.S. government agencies. If Customer wishes
to disclose any information to Mentor Graphics that is subject to any U.S. or other applicable export restrictions, including
without limitation the U.S. International Traffic in Arms Regulations (ITAR) or special controls under the Export
Administration Regulations (EAR), Customer will notify Mentor Graphics personnel, in advance of each instance of disclosure,
that such information is subject to such export restrictions.
14. U.S. GOVERNMENT LICENSE RIGHTS. Software was developed entirely at private expense. The parties agree that all
Software is commercial computer software within the meaning of the applicable acquisition regulations. Accordingly, pursuant
to U.S. FAR 48 CFR 12.212 and DFAR 48 CFR 227.7202, use, duplication and disclosure of the Software by or for the U.S.
government or a U.S. government subcontractor is subject solely to the terms and conditions set forth in this Agreement, which
shall supersede any conflicting terms or conditions in any government order document, except for provisions which are contrary
to applicable mandatory federal laws.
15. THIRD PARTY BENEFICIARY. Mentor Graphics Corporation, Mentor Graphics (Ireland) Limited, Microsoft Corporation
and other licensors may be third party beneficiaries of this Agreement with the right to enforce the obligations set forth herein.
16. REVIEW OF LICENSE USAGE. Customer will monitor the access to and use of Software. With prior written notice and
during Customer’s normal business hours, Mentor Graphics may engage an internationally recognized accounting firm to
review Customer’s software monitoring system and records deemed relevant by the internationally recognized accounting firm
to confirm Customer’s compliance with the terms of this Agreement or U.S. or other local export laws. Such review may include
FlexNet (or successor product) report log files that Customer shall capture and provide at Mentor Graphics’ request. Customer
shall make records available in electronic format and shall fully cooperate with data gathering to support the license review.
Mentor Graphics shall bear the expense of any such review unless a material non-compliance is revealed. Mentor Graphics shall
treat as confidential information all information gained as a result of any request or review and shall only use or disclose such
information as required by law or to enforce its rights under this Agreement. The provisions of this Section 16 shall survive the
termination of this Agreement.
17. CONTROLLING LAW, JURISDICTION AND DISPUTE RESOLUTION. The owners of certain Mentor Graphics
intellectual property licensed under this Agreement are located in Ireland and the U.S. To promote consistency around the
world, disputes shall be resolved as follows: excluding conflict of laws rules, this Agreement shall be governed by and construed
under the laws of the State of Oregon, U.S., if Customer is located in North or South America, and the laws of Ireland if
Customer is located outside of North or South America. All disputes arising out of or in relation to this Agreement shall be
submitted to the exclusive jurisdiction of the courts of Portland, Oregon when the laws of Oregon apply, or Dublin, Ireland when
the laws of Ireland apply. Notwithstanding the foregoing, all disputes in Asia arising out of or in relation to this Agreement shall
be resolved by arbitration in Singapore before a single arbitrator to be appointed by the chairman of the Singapore International
Arbitration Centre (“SIAC”) to be conducted in the English language, in accordance with the Arbitration Rules of the SIAC in
effect at the time of the dispute, which rules are deemed to be incorporated by reference in this section. Nothing in this section
shall restrict Mentor Graphics’ right to bring an action (including for example a motion for injunctive relief) against Customer in
the jurisdiction where Customer’s place of business is located. The United Nations Convention on Contracts for the
International Sale of Goods does not apply to this Agreement.
18. SEVERABILITY. If any provision of this Agreement is held by a court of competent jurisdiction to be void, invalid,
unenforceable or illegal, such provision shall be severed from this Agreement and the remaining provisions will remain in full
force and effect.
19. MISCELLANEOUS. This Agreement contains the parties’ entire understanding relating to its subject matter and supersedes all
prior or contemporaneous agreements. Some Software may contain code distributed under a third party license agreement that
may provide additional rights to Customer. Please see the applicable Software documentation for details. This Agreement may
only be modified in writing, signed by an authorized representative of each party. Waiver of terms or excuse of breach must be
in writing and shall not constitute subsequent consent, waiver or excuse.
Rev. 130502, Part No. 255853