1
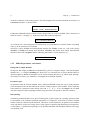
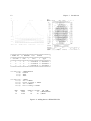
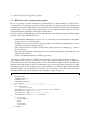
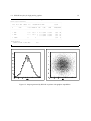
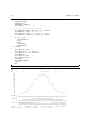
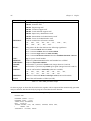
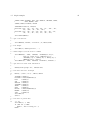
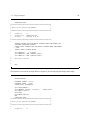
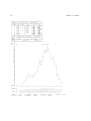
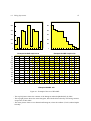
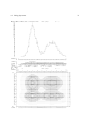
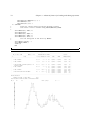
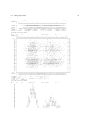
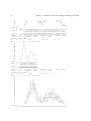
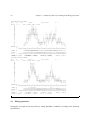
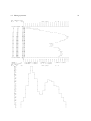
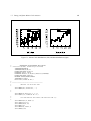
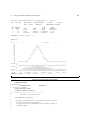
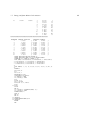
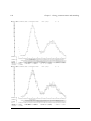
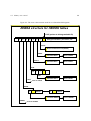
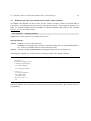
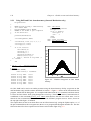
1.6. HPLOT interface for high quality graphics
13
1.6 HPLOT interface for high quality graphics
hplot is a package of Fortran subroutines for producing hbook output suitable for graphic devices
or in PostScript. It is designed to produce drawings and slides of a quality suitable for presentations at
conferences and scientific publications. It does not produce all the numerical information of the HBOOK
output routines. It is not restricted by the line printer’s poor resolution and unique character sets but it
uses the full graphics capabilities of the targeted output device.
HPLOT can access an HBOOK data structure and transform it into drawings using the HIGZ graphics
package. Some of the available options are :
– Predefined ISO standard paper size (A4, A3, etc.), horizontal or vertical orientation, with suitable
margins. Other sizes are also possible.
– Combination of several plots on the same page, either by windowing or superimposition, or both,
with different symbols to distinguish them.
– Titles on the axes and text anywhere on the picture, using various fonts, containing, e.g., Greek or
special characters.
– Three-dimensional surface representations for two-dimensional histograms (with hidden-line and
hidden-surface removal).
– Colour (if the hardware allows it), hatching, grey levels,. . . .
As a simple example of the use of HPLOT let us consider a program similar to the one in Figure 1.4.
After opening a file on unit 10 to write the metafile output (Fortran OPEN statement), we book, then
fill the Ntuple projections, and finally plot them. The call to HPLINT initialises HPLOT and HPLCAP
redirects the metafile output to unit 10. The parameters given to HPLOT instruct the program to output
all histograms in the current working directory to the metafile using “standard” option, while HPLEND
closes the metafile. See the HPLOT user’s guide [2] for more details. The result of the job and the
resulting PostScript file can be compared to the “lineprinter” output in Figure 1.4.
Example of a simple HPLOT program
PROGRAM HPTEST
COMMON/PAWC/H(80000)
DIMENSION X(3)
CHARACTER*8 CHTAGS(3)
DATA CHTAGS/’
X
’,’
Y
’,’
Z
’/
*.-----------------------------------------------------------CALL HLIMIT(80000)
*
Reopen data base
OPEN(UNIT=10,file=’hplot.meta’,form=’formatted’,status=’unknown’)
CALL HBOOK1(10,’TEST1’,100,-3.,3.,0.)
CALL HBOOK2(20,’TEST2’,30,-3.,3.,30,-3.,3.,250.)
CALL HBOOKN(30,’N-TUPLE’,3,’ ’,1000,CHTAGS)
*
DO 10 I=1,10000
CALL RANNOR(A,B)
X(1)=A
X(2)=B
X(3)=A*A+B*B
CALL HFN(30,X)
10 CONTINUE
*