1
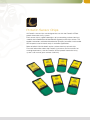
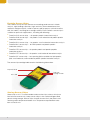
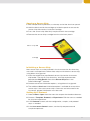
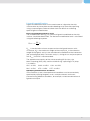
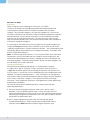
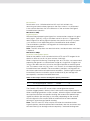
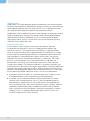
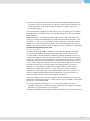
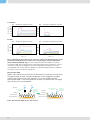
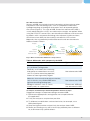
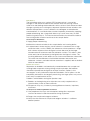
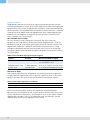
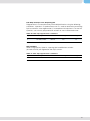
ProteOn Sensor Chips
ProteOn™ Sensor Chips
Tips and Techniques
Contents
ProteOn Sensor Chips
1
Storing Sensor Chips Opening a Sensor Chip Initializing a Sensor Chip Setting Up a Protocol 2
3
3
3
Running Experiments with Sensor Chips
4
Conditioning Chips Ligand Immobilization Desired Ligand Immobilization Level
Optimizing Immobilization Conditions
GLX Sensor Chips
Activation
Ligand Immobilization
Deactivation NLC Sensor Chip Ligand Capture HTX Sensor Chips Activation and Ligand Capture LCP Sensor Chip and Liposome Capturing Kit Activation, Conditioning, and Liposome Capture
GLC Lipid Kit Surface Modification
Partial Surface Modification
Liposome Capture
Troubleshooting Ligand Immobilization
Amine Coupling with GLX Chips
Typical Ligand Buffer Conditions
Activation Quality
Ligand Activity
Ligand Capture with the NLC Chip
Stabilization Analyte Injection Troubleshooting Analyte Injection
Nonspecific Binding
Electrostatic NSB
Non-Electrostatic NSB
Techniques for Reducing or Eliminating NSB on All Sensor Chips
Bulk Effect
Correcting for Bulk Effect
Bubble Formation
Tips for Reducing Bubble Formation
Regeneration GLX and NLC Sensor Chips HTX Sensor Chips
LCP Chip and Liposome Capturing Kit
GLC Lipid Kit Ordering Information Related Literature
4
5
5
5
6
6
6
7
7
7
7
7
8
8
8
8
9
9
10
10
10
10
10
11
12
12
13
13
14
15
15
17
17
17
17
18
18
18
19
19
20
2121
ProteOn Sensor Chips
All ProteOn sensor chips are designed for use with the ProteOn XPR36
protein interaction array system.
Each sensor chip is a gold-coated glass prism containing surface chemistry
used for the immobilization of biomolecules (ligands) to the chip surface. This
enables interactions with other biomolecules (analytes) to create a measurable
SPR response used in kinetic analysis and other applications.
Refer to bulletin 5404 for details on the surface chemistry of each chip.
For more information about the ProteOn instrument and instructions for
running experiments, see the ProteOn XPR36 protein interaction array
system user manual (part number 10021411).
ProteOn Sensor Chips
The ProteOn family of chips features outstanding performance in kinetic
analysis, high binding capacities, high sensitivity for the detection of low
molecular weight analytes, uniform spot-to-spot response, minimal baseline
drift, bar codes, and long-term storage stability. Each ProteOn sensor chip is
suitable for particular applications, including the following:
■■
■■
■■
■■
■■
■■
■■
ProteOn GLC sensor chip — for protein-protein interaction analysis
roteOn GLM sensor chip — for protein–small molecule and protein-protein
P
interaction analysis
ProteOn GLH sensor chip — for protein–small molecule interaction analysis
roteOn NLC sensor chip — for DNA-protein and protein-protein
P
interaction analysis
roteOn HTG sensor chip — for protein-protein and protein-peptide
P
interaction analysis
ProteOn HTE sensor chip — for protein–small molecule interaction analysis
roteOn LCP sensor chip — for capturing lipid assemblies for lipid-protein,
P
lipid–small molecule, and membrane protein–protein interaction analysis
The sensor chip cartridge label contains the following information:
Expiration date
Bar code
Chip type
Catalog number
Storing Sensor Chips
Store chips at 4°C. To avoid condensation on the chip surface, which can
lead to inaccurate results, keep sensor chips in the sealed nitrogen-filled
pouch during storage. Sensor chips should also remain in the pouch until
reaching room temperature before use. Temperature equilibration takes
from 30 to 60 min.
2
Opening a Sensor Chip
1. After temperature equilibration, cut the top seal of the aluminum pouch.
2. Hold the black end of the cartridge up inside the pouch to ensure the
sensor chip slide remains inside the cartridge.
3. Press the sensor chip slide firmly into place within the cartridge.
4. Remove the sensor chip cartridge from the aluminum pouch.
Sensor chip slide
Cartridge
Initializing a Sensor Chip
New sensor chips must be initialized in the instrument the first time they
are used in an experiment. Follow these steps to initialize the sensor chip,
using either air or glycerol.
1. Insert the temperature-equilibrated sensor chip into the instrument
chip loader. The chip ID, chip chemistry, and chip expiration date
populate the Chip Details area of the Sensor Chip box in the
ProteOn Manager™ software.
2. Choose one of the initialization options, using either air or glycerol.
3. The additional Use Last initialization option is available for reuse of the
sensor chip. If the used sensor chip is taken out and reinserted in the
instrument, glycerol initialization must be used.
Setting Up a Protocol
1. Choose New or Open from the menu bar to open the database browser.
2. Choose a Template, Protocol, or Experiment. Edit the name as needed
for your new experiment.
3. In the Protocol screen, edit the configuration, samples, and protocol
steps as needed.
4. In the Instrument Control screen, set the chip temperature and
sample temperature.
3
Running Experiments with Sensor Chips
An interaction analysis experiment comprises five major steps:
1. Conditioning
2. Ligand immobilization
3. Stabilization
4. Analyte injection
5. Regeneration
Conditioning Chips
Conditioning prepares the chip surface for use. Although optional, it is highly
recommended because it can increase baseline stability. The conditioning
protocols for all sensor chips are listed in Table 1.
Table 1. Conditioning parameters.
GLC, GLM, and GLH Chips
Injection
1
2
3
4
5
6
Reagent
Orientation
Volume, µl
Flow Rate, µl/min
0.5% SDS
50 mM NaOH
100 mM HCl
0.5% SDS
50 mM NaOH
100 mM HCl
Horizontal
Horizontal
Horizontal
Vertical
Vertical
Vertical
30 30
30
30
30
30
30
30
30
30
30
30
Reagent
Orientation
Volume, µl
Flow Rate, µl/min
50 mM NaOH
1 M NaCl
50 mM NaOH
1 M NaCl
Horizontal
Horizontal
Vertical
Vertical
30
30
30
30
30
30
30
30
Reagent
Orientation
Volume, µl
Flow Rate, µl/min
0.5% SDS
50 mM NaOH
100 mM HCl
300 mM EDTA
0.5% SDS
50 mM NaOH
100 mM HCl
300 mM EDTA
Horizontal
Horizontal
Horizontal
Horizontal
Vertical
Vertical
Vertical
Vertical
30
30
30
30
30
30
30
30
30
30
30
30
30
30
30
30
NLC Chip
Injection
1
2
3
4
HTG and HTE Chips
Injection
1
2
3
4
5
6
7
8
Note: 1. In conditioning, we recommend using the same buffer used for running
experiments. When working with buffers containing metal ions that form hydroxide
precipitates, however, eliminate the NaOH injections. 2. Trehalose is used as a
protective layer for the dry NeutrAvidin on the NLC chip surface. It will be completely
removed by continuous buffer flow over the chip surface. However, conditioning is
highly recommended to ensure complete removal of the protective layer. 3. For the
LCP chip used with the ProteOn liposome capturing kit, perform conditioning after
biotin-ssDNA capture and before liposome capture. For the GLC chip used with the
ProteOn GLC lipid kit, perform conditioning after surface modification and before
liposome capture. Refer to the Ligand Immobilization section for more details.
4
Ligand Immobilization
Ligand immobilization refers to the attachment of a ligand to the chip
surface either by irreversible covalent bonding or by reversible capturing
using a capture agent. Refer to bulletin 5821 for details on achieving
optimal ligand immobilization.
Desired Ligand Immobilization Level
The immobilization level (RL), or amount of ligand immobilized on the chip
surface, should be determined. The desired immobilization level is calculated
using the following equation:
Rmax = n
MA
ML
RL
Rmax is the desired maximum response when the ligand interacts with
an analyte, MA is the molecular weight of the analyte, ML is the molecular
weight of the ligand, and n is the stoichiometric coefficient of the interaction
(the analyte/ligand ratio). For kinetic analysis, aiming for an analyte response
with Rmax ≤200 RU is recommended.
The approximate capacity of the amine coupling (GLX) chips, the
biotin-capturing (NLC) chip, and the histidine tag– capturing (HTX) chips
is as follows:
GLC ~8 kRU
GLM ~12 kRU
NLC ~2 kRU
HTG ~5 kRU
GLH ~20 kRU
HTE ~12 kRU
Optimizing Immobilization Conditions
In the ProteOn system, the experimental conditions can be conveniently
optimized by injecting reagents across multiple channels with each
channel having different conditions, for example, varied concentrations of
ligand and analyte.
5
GLX Sensor Chips
Activation
When using the amine coupling or GLX chips, mix EDAC
(1-ethyl-3-(3-dimethylaminopropyl)carbodiimide hydrochloride) and
sulfo-NHS (N-hydroxysulfosuccinimide) to produce the activation
solution. The activation reagents are typically prepared as a mixture of
1x EDAC/sulfo-NHS and should be mixed immediately before the injection.
We recommend using a contact time of 60 sec for moderate activation
and 300 sec for high activation levels. For the GLH chip, avoid using a
high activation level because it can lead to overactivation and subsequent
multivalent linking of the ligand.
It is possible to eliminate the manual mixing of the activation reagents by
using the Co-inject function of the ProteOn system. Refer to the article
“Ligand Immobilization in Protein Interaction Studies – An Unattended Amine
Coupling Protocol with Automatic Co-Injection Activation” in the May 2012
online issue of BioRadiations.
Note: 1x EDAC/sulfo-NHS contains a 1:1 mixture of EDAC and sulfo-NHS,
components that are included with the ProteOn amine coupling kit. We
recommend following the instructions shipped with the kit to prepare the
activation reagents. The final concentrations of the activation reagents are
20 mM EDAC and 5 mM sulfo-NHS.
Ligand Immobilization
We recommend preparing the ligand in a concentration range of
0.5 µg/ml to 25 µg/ml. Typically, using a slow flow rate of 30 µl/min is
suggested to reduce ligand use during ligand injection; the contact time
may vary from 1 min to over 10 min, depending on the immobilization level
needed. The ligand coupling buffer is ~1 pH unit lower than the ligand pI
to facilitate charge attraction between the positive ligand and the negative
chip surface. Low ionic strength is also required to enhance charge
attraction. These conditions provide a starting point for further optimizing
experimental conditions.
To achieve the desired immobilization level, choose from the two
following approaches:
1. Set two consecutive ligand injection steps with a pause step in
between. The first ligand injection step is short and measures the
ligand immobilization rate. You may fine-tune the second ligand injection
according to the ligand immobilization rate at the pause step to achieve
the desired immobilization level.
2. Set a single long ligand injection step and monitor the ligand
immobilization process. When the desired immobilization level is
reached, hit the Abor t button to end the ligand injection step.
6
Deactivation
Deactivation uses 1 M ethanolamine HCl at pH 8.5 to block any
remaining activated carboxyl group on the chip surface. It is performed
in the vertical direction, the same direction as the activation and ligand
immobilization injections.
NLC Sensor Chip
Ligand Capture
We recommend preparing the ligand in a concentration range of 0.5 µg/ml
to 25 µg/ml. Typically, using a slow flow rate of 30 µl/min is suggested to
reduce ligand use during ligand injection; the contact time may vary from
1 min to over 10 min depending on the immobilization level needed.
These conditions provide a starting point for further optimization of
experimental conditions.
Note: The NLC chip does not need activation, and deactivation with biotin
is optional.
HTX Sensor Chips
Activation and Ligand Capture
Refer to the product insert included with the HTG and HTE reagent kit for
details on how to use this kit (part number 10021524).
When using the histidine tag–capturing chips or HTX chips, we recommend
preparing the ligand in a concentration range of 0.5 µg/ml to 25 µg/ml and
using a slow flow rate of 30 µl/min for the ligand injection to reduce ligand
use. The contact time may vary from 1 min to over 10 min depending on the
immobilization level needed. These conditions provide a starting point for
the further optimization of experimental conditions. Perform ligand injection
immediately after the activation step to avoid nickel (II) ion leakage and
consequently a reduced immobilization level.
Table 2. HTX chip activation and ligand capture parameters.
Injection
1
2
Reagent
Orientation Volume, µl Flow Rate, µl/min
Vertical
10 mM NiSO4
0.5–25 µg/ml ligand Vertical
60 Flexible
30
30
The ProteOn HTG and HTE sensor chips are designed to capture
histidine-tagged proteins directly from crude media and purified proteins.
When capturing ligand from crude samples, dilute the ligand sample before
the capture to reduce nonspecific binding. We recommend performing a
significant dilution (for example, by 100-fold), depending on the amount
of active ligand in the sample. Refer to bulletin 6302 for more detailed
techniques to reduce nonspecific binding.
Note: The HTG and HTE chips require activation but not deactivation.
Ligand injection should be performed immediately after the activation step
to avoid nickel (II) ion leakage and consequently a reduced binding level.
7
LCP Sensor Chip and Liposome Capturing Kit
Refer to the product insert of the liposome capturing kit for details on how
to use this kit (part number 10024332).
Activation, Conditioning, and Liposome Capture
Inject the biotin-ssDNA solution for surface activation. Then precondition the
chip surface with the lipid modification conditioning solution (20 mM CHAPS)
before liposome capture. Next, inject the chol-dsDNA 1 tagged liposome
solution. If an additional liposome layer is needed, inject the chol-dsDNA 2
solution (0.4 µM) and allow the signal to stabilize for 5 min: then inject the
chol-dsDNA 1 tagged liposome solution. Repeat this step to form multiple
liposome layers.
Table 3. LCP chip activation, conditioning, and liposome capture parameters.
Injection
1
2
3
4
5
Reagent
Orientation
Volume, µl
Flow Rate, µl/min
1.3 µM biotin-ssDNA
20 mM CHAPS
1 mg/ml chol-dsDNA 1
tagged liposomes
0.4 µM chol-dsDNA 2
1 mg/ml chol-dsDNA 1
tagged liposomes
Vertical
Vertical
Vertical
50 150
150
30
30
30
Vertical
Vertical
50
150
30
30
Note: Injections 4 and 5 are optional.
GLC Lipid Kit
Refer to the product insert of the GLC lipid kit for details on how to use
this kit (part number 10023826).
Surface Modification
Use the activation and deactivation reagents from the ProteOn amine
coupling kit. Inject 1x EDAC/sulfo-NHS, lipid modification solution, and 1 M
ethanolamine HCl sequentially.
Table 4. GLC surface modification parameters.
Injection
1
2
3
Reagent
1x EDAC/sulfo-NHS
4.6 mM alkylamine
1 M ethanolamine HCl
Orientation Volume, µl Flow Rate, µl/min
Vertical
Vertical
Vertical
150
150
150
30
30
30
Note: 1x EDAC/sulfo-NHS contains a 1:1 mixture of EDAC and sulfo-NHS. These
components are included with the ProteOn amine coupling kit. We recommend
following the instructions shipped with the kit to prepare the activation reagents for
this protocol. The final concentrations of the activation reagents are 20 mM EDAC
and 5 mM sulfo-NHS.
8
Partial Surface Modification
The extent of surface modification can be used to control the liposome
capturing level and configuration. Lower surface modification will reduce
the capturing capacity and in many cases improve the resistance to
nonspecific binding. Lower modification will also increase the chances
of capturing intact liposomes, while higher modification will increase the
tendency of liposomes to deform and even open into lipid bilayers spread
over the surface.
Partial surface modification refers to varying the immobilization level of
undecylamine by controlling the immobilization conditions. This can be
achieved by controlling the activation level, undecylamine concentration,
or injection volume. Otherwise, mixing undecylamine with ethanolamine
HCI (the deactivation solution from the amine coupling kit) is an easy-to-use
and efficient alternative. For fine-tuned control of the surface modification
level, we recommend varying the undecylamine concentration by diluting
the lipid modification solution (undecylamine) in the lipid modification
conditioning solution (CHAPS).
Liposome Capture
Before liposome capture, condition the chip surface with the lipid
modification conditioning solution (20 mM CHAPS), and then inject the
liposome solution.
Table 5. Liposome capture parameters.
Injection
1
2
Reagent
20 mM CHAPS
1 mg/ml liposomes
Orientation Volume, µl Flow Rate, µl/min
Vertical
Vertical
150 150
30
30
When injecting ligand, concentrations between 0.5 and 25 μg/ml are
typically used with a flow rate of 30 μl/min and a contact time of 1 to 14 min.
These conditions will produce signals of up to 5,000 RU on the HTG chip
and 12,000 RU on the HTE chip.
Please note that when capturing ligands from crude media, various
other proteins may also be adsorbed to the chip surface, mainly due to
nonspecific interaction with nickel (II) ions. Fortunately, these proteins will not
interfere with the kinetics because ligand-analyte interactions are specific.
However, the presence of nonspecifically bound lysate proteins will make
accurate determination of ligand binding levels difficult given that the
observed signal is the sum of the ligand signal and the signal from other
bound proteins.
9
Troubleshooting Ligand Immobilization
Amine Coupling with GLX Chips
The degree of success in ligand immobilization can be visualized by
observing the sensorgram during the procedure (see Figure 1).
Typical Ligand Buffer Conditions
The typical ligand buffer conditions are listed below:
1. The pH should be one unit below the pI value.
2. T
he ligand buffer ionic strength should be low, and the ligand
concentration should be above 0.1 μg/ml.
3. If a disulfide bond reduction reagent is needed in the ligand buffer,
TCEP is preferred over DTT because TCEP is compatible with the amine
coupling protocol.
Response, RU
A
B
20,000
Deactivation
15,000
10,000
0
–5,000
–200
8,200
Immobilization
Deactivation
19,400
13,800
Activation
5,000
25,000
Activation Immobilization
2,600
–3,000
0
500
Time, sec
1000
1,500
–200 180 560 940 1,3201,700
Time, sec
Fig. 1. Sensorgram examples of failed (A) and successful (B) ligand immobilization by
amine coupling.
Activation Quality
Verify the activation quality by:
1. Using fresh activation reagents.
2. Immobilizing another protein that was previously used under the same
conditions with success.
Ligand Activity
If a sufficiently high Rmax is predicted based on the RL value, but the binding
response is much lower than the expected response, this indicates low
ligand activity on the surface. Because the amine coupling method randomly
links any free amine group on the ligand molecule to the chip surface, the
ligand activity is usually not very high.
1. If low ligand activity is caused by nonoptimized ligand immobilization
conditions, correct the conditions.
2. If low ligand activity is caused by steric hindrance resulting from ligand
orientation, there are two potential solutions, the capture surface and
protected immobilization methods (Figure 2):
10
A. Capture surface method
Surface
Capture reagent
Surface
Analyte
Ligand
Ligand
Capture reagent
Capture reagent
Surface
Surface
B. Protected immobilization method
Protected ligand
Surface
Ligand
Surface
Surface
Analyte
Ligand
Surface
Fig. 2. The capture surface method (A) and protected immobilization method
(B) for eliminating steric hindrance resulting from ligand molecule orientation.
3. If the ligand is vulnerable when using amine coupling, use a capture
surface chemistry to reversibly capture the ligand such as a chip surface
functionalized with an antibody or NeutrAvidin. Note that the ligand should
be biotinylated or histidine tagged to use the biotin or histidine-tag binding
surface chemistry.
Ligand Capture with the NLC Chip
Tips for capturing ligands with NLC chips:
1. It is important to assess the result of biotinylation after ligand preparation.
If the biotinylation step was not successful, ligand capture will not be
observed on NLC chips.
2. If excess biotin is not removed properly from the ligand sample, it will
occupy the available binding sites on the chip surface and result in low
binding levels, typically of a few tens of RU.
3. If the ligand is biotinylated and captured on the chip surface but does
not show a binding response with the analyte, over-biotinylation may
have occurred. To avoid this, we recommend preparing the ligand in
a stoichiometry of 1:1 (one biotin molecule per ligand molecule). This
also prevents cross-linking of the ligand. Alternatively, carry out the
biotinylation reaction in a low pH buffer (50 mM acetate at pH 5.5) to favor
the selective biotinylation of alpha-amino groups, which leaves the lysine
residues unblocked.
11
Stabilization
Stabilization is the step between ligand immobilization and analyte injection.
Injecting running buffer or regeneration solutions removes any noncovalently
bound ligand molecules from the chip surface. Thus, stabilization creates
the stable baseline required to perform the interaction analysis.
Stabilization involves performing one or more injections of either the running
buffer or regeneration solutions that do not affect the immobilized ligand.
Allowing the baseline to stabilize for 30 min is recommended to obtain
high-quality kinetic analysis. For the NLC chip, we recommend injecting
1 M NaCl in the stabilization step.
Analyte Injection
In the ProteOn system, ligands and analytes are typically injected
at perpendicular directions in the 6 x 6 configuration to perform the
interaction analysis. This patented One-shot Kinetics™ approach allows
up to 36 individual interactions to be performed simultaneously in a single
analyte injection, providing high efficiency in experiment optimization and
high throughput in data production. Ligands and analytes are typically
injected in the vertical and horizontal directions, respectively. For kinetic
analysis, analyte injections are usually performed at a high flow rate
(for example, 100 µl/min), but a lower flow rate may be used to reduce
sample consumption. The injection conditions, including association and
dissociation time, flow rate, and analyte concentrations, should be optimized
to obtain high-quality interaction analysis. Refer to bulletin 6044 for further
details on achieving optimal ligand-analyte interaction analysis. Three useful
tips for obtaining reliable interaction analysis results are listed below:
1. Prepare the analyte samples as a concentration series, typically a twoor threefold dilution series centered around the expected KD.
2. If needed, set up a double reference. Replace one of the six analyte
channels with running buffer for use as a real-time double reference
(row reference). Alternatively, set up an injection of running buffer into
all six analyte channels prior to the injection of analyte samples (injection
reference). Double referencing is needed for baseline drift correction
and is used mostly when the ligand is reversibly captured by a capture
reagent such as an antibody, NeutrAvidin (NLC and LCP chips), or a
tris-NTA complex (HTG and HTE chips).
12
3. Set the association time of the interaction to be long enough to observe
curvature in the association phase. Similarly, allow the dissociation time
of the interaction to be long enough to observe a signal drop in the
dissociation phase.
The concentration range of analyte should span 10x above and 10x below
the expected KD. A buffer blank can also be injected as a real-time double
(row) reference.
Note: In protein–small molecule interaction analysis, the small molecule
analyte is sometimes prepared with a high refractive index cosolvent such
as DMSO. In such a case, excluded volume correction is typically used to
account for the excluded volume effect while maintaining the accuracy of
referencing. Refer to bulletin 5822 for details on how to apply this correction.
Troubleshooting Analyte Injection
Nonspecific Binding
Nonspecific binding (NSB) is defined as the direct binding of an analyte
or sample components other than the target ligand to the sensor chip
surface. NSB is characterized by significant binding responses that occur
on reference spots and do not return to baseline at the end of the injection
(Figure 3). These events can potentially skew experimental results. In theory,
if the NSB responses on the interaction surface and on the reference are
similar, subtracting the reference from the interaction response will correct
the data and lead to accurate fitting to the binding model. In practice,
however, it is very difficult to determine whether NSB is similar on the
interaction and reference surfaces. There are cases where the ligand
molecules on the interaction surface block NSB on the chip surface. This
leads to a higher NSB response on the reference surface and results in
incorrectly referenced data or even negative responses.
At present, NSB is one of the most difficult factors to optimize in label-free
biomolecular interaction analysis. There are two main strategies used in SPR
biosensors to overcome NSB:
1. Using a reference surface that is as similar to the ligand surface as
possible. Optimally, a reference protein unrelated to the ligand should be
bound at the same density as the ligand.
2. Minimizing NSB by optimizing the buffer conditions and surface chemistry.
13
A. No NSB
Response, RU
(i)
Analyte on ligand channel
(ii)
200
200
160
160
120
120
80
80
40
40
0
0
–40 0 40 80 120 160200240
B. NSB
(i)
Response, RU
Analyte on reference channel
-–40 0 40 80 120 160200240
Analyte on ligand channel
(ii)
600
600
400
400
200
200
0
Analyte on reference channel
0
–100 0 100200300400
Time, sec
–100 0 100200300400
Time, sec
Fig. 3. Comparison of responses on reference surfaces showing only bulk effect
(a refractive index difference between the sample buffer and running buffer)
(A) or exhibiting NSB (B). A (ii), for the analyte injected in the reference channel
showing no NSB, the analyte response is flat during the injection and returns to zero
at the end of the injection. B (ii), for the analyte injected in the reference channel
showing NSB, the analyte response exhibits curvature during the injection and does
not return to zero at the end of the injection.
Electrostatic NSB
NSB is most commonly caused by the electrostatic attraction of a positively
charged analyte or other sample components to the negatively charged
surface layer of the sensor chip (Figure 4). This type of NSB, termed
electrostatic NSB, is common when the analyte is a protein with a pI higher
than the pH of the running buffer.
(+)
(+)
Analyte
Electrostatic
NSB
Ligand
(-)
Ligandanalyte
interaction
Analyte
(-)
Ligand
Surface layer
Surface layer
Gold substrate
Surface layer
Fig. 4. Electrostatic NSB on the chip surface.
14
Electrostatic
NSB
(+)
Ligandanalyte
interaction
(-)
Gold substrate
Non-Electrostatic NSB
Sources of NSB also include chemical interactions of the analyte or other
components with the binding layer, such as hydrophobic interactions,
hydrogen bonding, or binding to nanoscopic areas of exposed gold on
the surface (Figure 5). This type of NSB, termed non-electrostatic NSB, is
usually observed when “sticky” or crude analyte samples are applied. When
using the HTG/HTE sensor chips, non-electrostatic NSB can also be caused
by proteins with a sequence containing a few adjacent histidine residues,
which have a low affinity for the nickel (II)-activated tris-NTA surface.
Molecules that can potentially exhibit electrostatic and non-electrostatic
NSB are listed in Table 6.
Analyte
Nonelectrostatic
NSB
Ligandanalyte
interaction
Analyte
Ligand
Ligand
Surface layer
Surface layer
Gold substrate
Gold substrate
Nonelectrostatic
NSB
Ligandanalyte
interaction
Fig. 5. Non-electrostatic NSB on the chip surface.
Table 6. Molecules with a propensity for NSB.
Molecules in Samples
Type of NSB
Positively charged proteins with a pI > pH of the running buffer
Electrostatic NSB
Relatively small molecules containing
thiol groups or related forms of sulfur, such as cysteine-containing peptides,
known to show high affinity to gold
Non-electrostatic NSB
Molecules that naturally bind polysaccharides,
such as lectins, may exhibit NSB to the alginate-containing binding layer
Non-electrostatic NSB
Biological solutions such as serum, crude lysates, or supernatants
Electrostatic NSB and
non-electrostatic NSB
Techniques for Reducing or Eliminating NSB on All Sensor Chips
Suggested changes in experiment design to reduce NSB:
1. Optimize the appropriate running buffer and sample buffer for
the application.
2. Purify the analyte or sample when possible.
3. Try different immobilization surface chemistries; for example, use a
biotinylated ligand.
4. Swap the ligand and the analyte if only the analyte shows NSB.
5. Retest your binding assay with a fresh chip, preferably from a different
lot, to eliminate chip-specific defects.
15
Table 7. Techniques for reducing or eliminating NSB on all sensor chips.
Methods
Details
Non-Electrostatic
Electrostatic NSB
NSB
Increase the buffer salt concentration
Increase the salt concentration
to up to 500 mM in the analyte
buffer and running buffer, using NaCl for example, to shield the
electrostatic charges. It is
important to verify that the high
salt concentration does not affect
the ligand or analyte activity.
Increase the Increase the pH of the analyte
buffer pHbuffer and running buffer to reduce
the positive charges contributing to electrostatic NSB. It is important
to verify that the high pH does not
affect the ligand or analyte activity.
Add 0.05% Add 0.05% Tween 20 and/or
Tween 20 and/ 0.1% BSA to the running buffer
or 0.1% BSAto reduce both electrostatic and
non-electrostatic NSB; 0.1% BSA may also be used to saturate the
chip surface to block potential
NSB sites.
Create an Create an appropriate reference
appropriate
surface by capturing a reference
reference protein unrelated to the ligand,
surfacesuch as BSA, to the same level
as the ligand. The reference protein does not reduce NSB directly, but
it shields the charges on the chip
surface as much as the ligand. NSB
will be corrected for by subtracting
the reference.
Dilute the When using a complex analyte
analytesample like serum or crude lysate,
dilute the sample with the running
buffer—a five- to tenfold dilution is usually recommended. Higher
dilution rates should be used if
the sample is very concentrated.
Use prepurification
Use simple prepurification methods
to remove the majority of the contaminants in the analyte sample.
Remove If a ligand sample contains
albumin from albumin, inject a pulse of 1 M
the ligand salt solution to remove the samplealbumin bound to the chip surface
before the analyte injection.
–
•
–
•
•
•
–
•
•
•
•
•
•
•
Note: Refer to bulletin 6302 for specific troubleshooting tips for HTX chips.
16
Bulk Effect
The bulk effect refers to a spurious SPR response that is caused by
changes in the refractive index of the solution near the sensing surface
rather than the binding of biomolecules to the surface. Such refractive index
changes typically occur during the sequential injection of two solutions with
different compositions such as different salt, detergent, or biomolecule
concentrations. A small bulk effect can be completely removed by applying
proper referencing, but a large bulk effect may cause inaccuracy in data
processing and analysis. To minimize the bulk effect, the refractive index of
the running buffer should match that of the sample buffer.
Correcting for Bulk Effect
1. Apply proper referencing.
2. Match the refractive index of the sample buffer and running buffer.
3. In experiments where analytes are dissolved in a cosolvent with a high
refractive index, such as DMSO, the reference surface produces a larger
bulk solvent response than the ligand surface because of the larger
concentration of cosolvent near the reference surface. This effect is due
to the exclusion of cosolvent by the ligand near the ligand surface. The
resulting difference in bulk effect causes inaccurate reference subtraction.
To correct for the difference in bulk effect between interaction and
reference surfaces, excluded volume correction is applied; refer to bulletin
5822 for more details.
Bubble Formation
Separation air bubbles are intentionally created between the sample and
running buffer to prevent mixing during sample aspiration. No bubbles
should be injected into the ligand or analyte channels. Spikes in the
sensorgram usually indicate the injection of bubbles. Small spikes can be
completely removed in sensorgram processing, but large spikes may cause
inaccuracy in experimental results.
Problems with bubbles during the injection step:
1. Bubbles at the beginning of an injection are usually coupled with an
injection delay in one or more channels.
2. Responses may vary in intensity among different channels, injections,
and times.
Techniques for Reducing Bubble Formation
1. Use prepierced vial caps and microplate sealing films to prevent
vacuum formation inside the container during aspiration.
2. Degas the sample and reagent solutions.
3. Verify that the volume of sample and reagent solutions is sufficient
before injection.
17
Regeneration
Regeneration removes the analyte or ligand-analyte complex on the chip
surface to prepare the surface for the next experiment without damaging the
ligand and/or chip surface. Regeneration conditions should be optimized for
each interaction. The reproducibility of repeated analyte injections is typically
used to check the performance of regeneration. With a good regeneration
protocol, the sensorgrams of repeated analyte injections should overlap
when viewed in the same window.
GLX and NLC Sensor Chips
For GLX and NLC chips, the ligand is bound to the chip surface by
covalent or very high affinity noncovalent linking. Regeneration is used to
remove the analyte while keeping the ligand active on the chip surface. The
regeneration conditions should be optimized to a balance that is strong
enough to completely remove the analyte but not so harsh as to damage
the ligand. Some recommended conditions for different interaction systems
are listed below.
Table 8. GLX and NLC chip regeneration reagents.
Ligand
Analyte
Recommended Reagent
Protein/antibody
Protein/peptide
10 mM glycine pH 1.5–3.0,
1% phosphoric acid
Peptide/nucleic acid
Protein/peptide
0.01–0.5% SDS/5–10 mM NaOH
Nucleic acid
Nucleic acid
5–10 mM NaOH/deionized water
HTX Sensor Chips
The captured ligand can be stripped off and replaced with fresh ligand by
a highly efficient regeneration step using 300 mM EDTA, pH 8.5. Once the
ligand is removed, the chip can be reactivated to capture new ligands.
Table 9. HTX chip regeneration conditions.
Injection
1
Reagent
Orientation
Volume, µl
Flow Rate, µl/min
300 mM EDTA, pH 8.5
Vertical
400
30
EDTA may not completely remove nonspecifically adsorbed proteins
because they are adsorbed to the surface not only via the nickel (II) ions but
also by electrostatic interactions, for example. In such cases, other ProteOn
regeneration solutions, such as 50 mM NaOH and 100 mM HCl, may be
needed along with EDTA to regenerate the surface.
18
LCP Chip and Liposome Capturing Kit
Regeneration is accomplished by DNA dehybridization using the following
conditions. Injection 2 is optional because it is used to remove the remaining
lipid assemblies if the regeneration is incomplete with injection 1. For the first
injection, use a freshly prepared 8 M solution of urea in deionized water.
Table 10. LCP chip regeneration conditions.
Injection
1
2
Reagent
Orientation
Volume, µl
Flow Rate, µl/min
8 M urea*
20 mM CHAPS
Vertical
Vertical
150
150
30
30
* If urea is not available, inject deionized water.
GLC Lipid Kit
When using the GLC lipid kit, injecting lipid modification solution
(20 mM CHAPS) will regenerate the chip surface.
Table 11. GLC chip regeneration conditions.
Injection
1
Reagent
Orientation
Volume, µl
Flow Rate, µl/min
20 mM CHAPS
Vertical
150
30
19
Ordering Information
Catalog #
Description
Sensor Chips
176-5011
roteOn GLC Sensor Chip, for general amine coupling, compact
P
polymer layer with binding capacity of approximately one protein
monolayer
176-5012 ProteOn GLM Sensor Chip, for general amine coupling, polymer
matrix layer with intermediate binding capacity
176-5013
ProteOn GLH Sensor Chip, for general amine coupling, polymer
matrix layer with highest binding capacity
176-5021 ProteOn NLC Sensor Chip, for binding of biotinylated molecules,
contains NeutrAvidin immobilized to GLC layer
176-5031
ProteOn HTG Sensor Chip, for capturing histidine-tagged proteins,
polymer matrix layer contains tris-NTA complexes with compact
binding capacity
176-5033
ProteOn HTE Sensor Chip, for capturing histidine-tagged proteins,
polymer matrix layer contains tris-NTA complexes with higher
binding capacity
176-5041
ProteOn LCP Sensor Chip, for capturing lipid assemblies such as
liposomes, for use with the ProteOn LCP capturing reagent kit
Sensor Chip Application Kits
176-2300
ProteOn Liposome Capturing Kit, includes 1 ProteOn LCP sensor
chip, 1 ProteOn LCP capturing reagent kit, and ProteOn lipid
modification conditioning solution
176-2350
ProteOn GLC Lipid Kit, includes 1 ProteOn GLC sensor chip and
1 ProteOn lipid modification kit
176-2500
ProteOn HTG Capturing Kit, includes 1 ProteOn HTG sensor chip
and 1 ProteOn HTG and HTE reagent kit
176-2600
ProteOn HTE Capturing Kit, includes 1 ProteOn HTE sensor chip
and 1 ProteOn HTG and HTE reagent kit
Reagent Kits
176-2110
roteOn Immobilization Buffer Kit, includes 1 each sodium
P
acetate buffer (pH 4.0, 4.5, 5.0, 5.5)
176-2210
ProteOn Regeneration and Conditioning Kit, includes 1
each glycine buffer (pH 1.5, 2.0, 2.5, 3.0), and NaOH, SDS, HCl,
phosphoric acid, NaCl; 50 ml solution each
176-2310
ProteOn LCP Capturing Reagent Kit, for capturing lipid assemblies
such as liposomes, for use with the ProteOn LCP sensor chip
176-2360
ProteOn Lipid Modification Kit, includes ProteOn lipid modification
conditioning solution and ProteOn lipid modification solution
176-2410
ProteOn Amine Coupling Kit, includes EDAC (EDC), sulfo-NHS
and ethanolamine HCl
176-2510
ProteOn HTG and HTE Reagent Kit, includes reagents for
activation and regeneration of HTG and HTE sensor chips
20
Related Literature
Bio-Rad (2009). How to perform excluded volume correction on the ProteOn XPR36
protein interaction system. Bio-Rad Bulletin 5822
Bio-Rad (2011). Analyte interaction and kinetics. Bio-Rad Bulletin 6044
Bio-Rad (2012). Reduction of nonspecific binding on ProteOn™ HTG and HTE sensor
chips. Bio-Rad Bulletin 6302
Moriarty L (2010). Guide to Ligand Immobilization. Bio-Rad Bulletin 5821.
Shezifi D et al., (2012). Ligand Immobilization in Protein Interaction Studies —
An Unattended Amine Coupling Protocol with Automatic Co-Injection Activation.
BioRadiations, May 2012.
21
NeutrAvidin is a trademark of Thermo Fisher Scientific, Inc.
Tween is a trademark of ICI Americas, Inc.
For technical support, call your local Bio-Rad office, or in the U.S.,
call 1-800-424-6723. This product is for research use only.
©2012 Bio-Rad Laboratories, Inc. Reproduction in any form,
either print or electronic, is prohibited without written permission
of Bio-Rad Laboratories, Inc.
Bio-Rad
Laboratories, Inc.
Web site www.bio-rad.com USA 800 424 6723
Australia 61 2 9914 2800 Austria 01 877 89 01 Belgium 09 385 55 11
Brazil 55 31 3689 6600 Canada 905 364 3435 China 86 21 6169 8500
Czech Republic 420 241 430 532 Denmark 44 52 10 00
Finland 09 804 22 00 France 01 47 95 69 65 Germany 089 31 884 0
Greece 30 210 777 4396 Hong Kong 852 2789 3300
Hungary 36 1 459 6100 India 91 124 4029300 Israel 03 963 6050
Italy 39 02 216091 Japan 03 6361 7000 Korea 82 2 3473 4460
Malaysia 60 3 2117 5260 Mexico 52 555 488 7670
The Netherlands 0318 540666 New Zealand 64 9 415 2280
Norway 23 38 41 30 Poland 48 22 331 99 99 Portugal 351 21 472 7700
Russia 7 495 721 14 04 Singapore 65 6415 3170
South Africa 27 861 246 723 Spain 34 91 590 5200
Sweden 08 555 12700 Switzerland 061 717 95 55
Taiwan 886 2 2578 7189 Thailand 66 2 6518311
United Kingdom 020 8328 2000
Life Science
Group
Bulletin 6295 Rev A
US/EG
12-1094
1012 Sig 1211