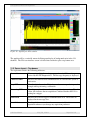
1
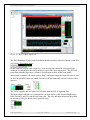
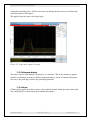
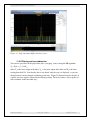
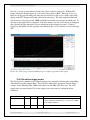
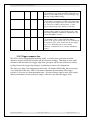
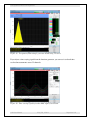
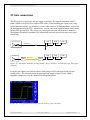
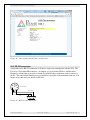
PSI System Controls and Diagnostics
Figure 33. Strip chart data display showing cursor.
11.5.5 Filtering and zero subtraction
You can low-pass filter the displayed data with “averaging” value A using the IIR algorithm
Yi = Xi/A + (1 - 1/A)Yi-1,
where Yi is the latest output of the filter, Yi-1 is the prior output of the filter and Xi is the latest
reading from the I128. Note that the data is not altered, only the way it is displayed, so you can
change between various amounts of filtering at any time. Figure 34 illustrates how the display of
a square wave test signal is affected by the filtering setting. The noise reduces, at the expense of
time resolution, in the inevitable way.
I128 User Manual
I128_UM_141014
Page 57 of 121