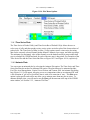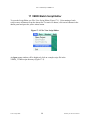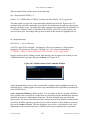
1
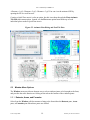
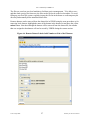
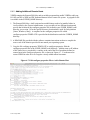
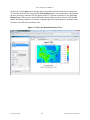
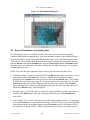
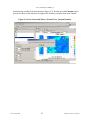
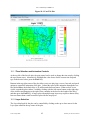
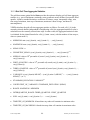
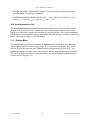
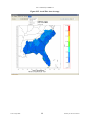
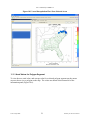
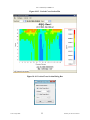
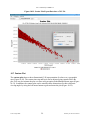
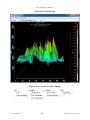
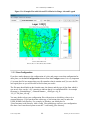
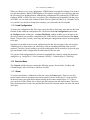
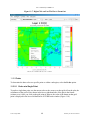
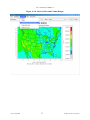
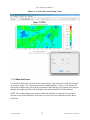
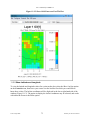
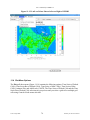
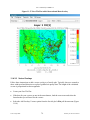
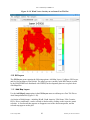
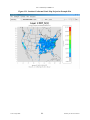
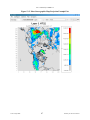
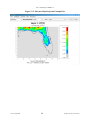
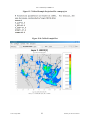
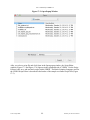
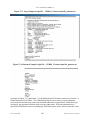
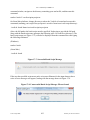
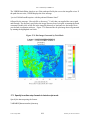
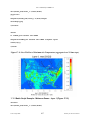
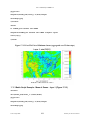
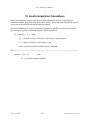
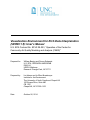
User’s Manual for VERDI 1.5
Figure 17-10. Fast Tile Plot of Ozone at Time step 17, Layer 1
17.2 Mathematical function capability in batch script mode
This update provides the user the ability to perform mathematical functions in VERDI using the
scripting mode. For example, Find maximum over all time steps at each grid cells.
The batch script can be used to generate plots for each mathematical function by using the task
block to define each function. The notation used within the task block is:
s=Formula(Variable[dataset#])
For example:
s=max(O3[1]) to plot the Maximum value over all timesteps for each grid cell in the
domain.
s=min(O3[1]) to plot the Minimum value over all timesteps for each grid cell
s=mean(O3[1]) to plot the Mean value over all timesteps for each grid cell
s=sum(O3[1]) to plot the Sum of the variable over all timesteps for each grid cell
The mathematical functions operate over all time steps at each grid cell. Examples for the batch
script notation and the images produced are provided in the following sections.
17.2.1 Batch Script Example: Maximum Ozone – layer 1 (Figure 17-11)
<Global>
UNC–Chapel Hill
106
Institute for the Environment