1
User’s Manual for VERDI 1.5
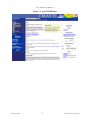
Figure 10-3. Areal Plot: Area Totals..............................................................................................49
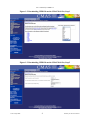
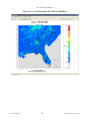
Figure 10-4. Areal Interpolation Plot: Show Gridded Data ...........................................................50
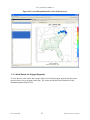
Figure 10-5. Areal Interpolation Plot: Show Selected Areas .........................................................51
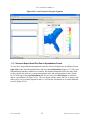
Figure 10-6. Areal Values for Polygon Segments .........................................................................52
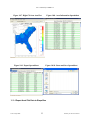
Figure 10-7. Right Click on Area Plot ...........................................................................................53
Figure 10-8. Area Information Spreadsheet ...................................................................................53
Figure 10-9. Export Spreadsheet....................................................................................................53
Figure 10-10. Name and Save Spreadsheet ...................................................................................53
Figure 10-11. Export Shapefile ......................................................................................................54
Figure 10-12. Name and Save Shapefile........................................................................................54
Figure 10-13. Vertical Cross Section Plot .....................................................................................55
Figure 10-14. Vertical Cross Section Dialog Box .........................................................................55
Figure 10-15. Time Series Plot ......................................................................................................56
Figure 10-16. Time Series Bar Plot ...............................................................................................57
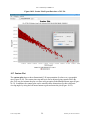
Figure 10-17. Scatter Plot ..............................................................................................................58
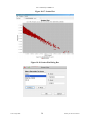
Figure 10-18. Scatter Plot Dialog Box ...........................................................................................58
Figure 10-19. Scatter Plot Export Data into a CSV file .................................................................59
Figure 10-20. Contour Plot ............................................................................................................60
Figure 10-21. Contour Plot Menu Options ....................................................................................60
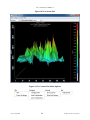
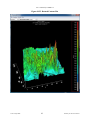
Figure 10-22. Rotated Contour Plot ...............................................................................................61
Figure 11-1. Fast Tile and Areal Plot Pull-down Menu Options ...................................................62
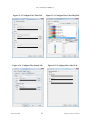
Figure 11-2. Configure Plot, Titles Tab .........................................................................................65
Figure 11-3. Configure Plot, Color Map Tab ................................................................................65
Figure 11-4. Configure Plot, Labels Tab .......................................................................................65
Figure 11-5. Configure Plot, Other Tab .........................................................................................65
Figure 11-6. Example Plot with Selected Tick Marks for Range Axis and Legend ......................66
Figure 11-7. Right-Click on Fast Tile Plot to Zoom Out ...............................................................68
Figure 11-8. Click on Plot to Probe: Data Value Shown in Lower Left of VERDI,
Latitude/Longitude Values Shown in Lower Right ...............................................................69
Figure 11-9. Spreadsheet Showing Probed Values for Region of Interest ....................................70
Figure 11-10. Select Set Row and Column Ranges .......................................................................71
Figure 11-11. Enter Row and Column Values ...............................................................................72
Figure 11-12. Show Grid Lines on a Fast Tile Plot .......................................................................73
Figure 11-13. Lat/Lon Values Shown in Lower Right of VERDI.................................................74
Figure 11-14. Plot Menu Options ..................................................................................................75
Figure 11-15. Animate Plot Dialog Box ........................................................................................76
UNC–Chapel Hill
vii
Institute for the Environment