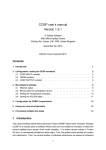
1
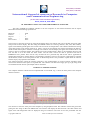
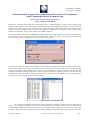
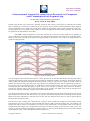
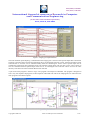
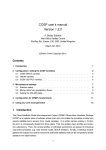
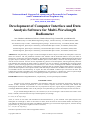
ISSN(Online): 2320-9801
ISSN (Print): 2320-9798
International Journal of Innovative Research in Computer
and Communication Engineering
(An ISO 3297: 2007 Certified Organization)
Vol. 3, Issue 6, June 2015
2minuts. This file has to be converted to “date.dat” format for data analysis. The first line of “date.dat” file contains
date in “dd mm yyyy” format, sky condition as per user selection. The second line contains Declination angle, Equation
of time and Radius vector. Third line contains filter number 01 and number of data points corresponds to that filter.
Then the signal value corresponds to filter number 01 will be listed against the time of data acquisition. This block will
be repeated for acquired data for all 10 filters.
The MWR is operated generally on clear days when the sky is free from visible clouds. If it is operating on
partly cloudy days, the clouds entering the field of view during the measurement may affect some of the data points,
which are then to be removed by the clouds screening algorithm in the software. Fig. 4 shows the implementation of
cloud screening algorithm.
Figure 4. Cloud screening process
This sub program can be initiated from “Process” menu. The user has to select the date.dat file. Pressing “OK” button
will make polynomial fit of the signal values and plot them in 10 different windows according to wavelengths. Pressing
“Mark” button will calculate the standard deviation and mark on the plot. The user has to press the “Screen” button to
perform the cloud screening. The data points lying outside of the standard deviation will be deleted from the data set.
This process will be repeated three times for performing a smooth cloud screening. The user has to assess the cloud
screened data plot and if the data quality is good, user can save the data by pressing “Save” button or discard by
pressing the “Discard” button. The cloud screened data will be stored in the folder from where the date.dat file is
selected. The software will display the path of the cloud screened data file.
The cloud screened data is used to estimate the total columnar atmospheric Optical Depth from which spectral Aerosol
Optical Depths are retrieved. The data set has to be split in to forenoon and afternoon for calculating Aerosol Optical
Depth for forenoon and afternoon. The user has to use the “FN AN” submenu from “Process” menu to split the data to
forenoon data and afternoon data.
The user has to take “Langley Plot” submenu from “Analysis” menu to make the Langley plot and estimate Aerosol
Optical Depth. User has to select the cloud screened data and press OK to make the Langley plot. The software will
estimate the relative airmass corresponding to the time of each measurement. The logarithmic value of the signal is
calculated and the Langley plot is implemented with relative airmass (m) along x-axis and logVλ. along y-axis. The
software is utilizing students-T distribution to refine the data set. The slope of the langley plot gives the total columnar
optical depth (Ʈλ). Fig. 5 shows the implementation of langley plot.
Copyright to IJIRCCE
DOI: 10.15680/ijircce.2015.0306024
5129