1
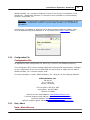
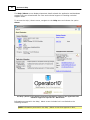
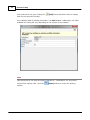
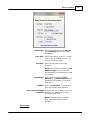
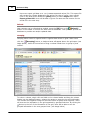
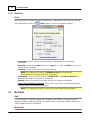
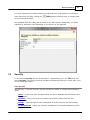
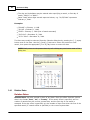
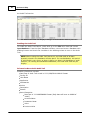
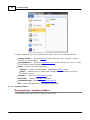
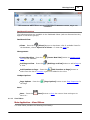
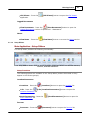
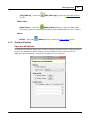
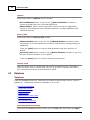
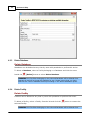
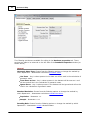
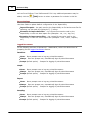
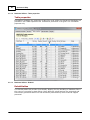
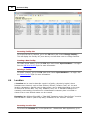
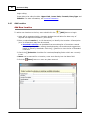
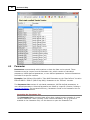
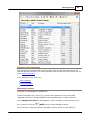
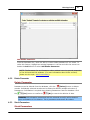
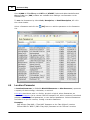
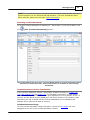
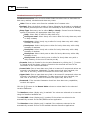
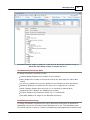
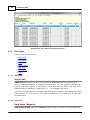
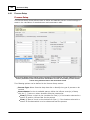
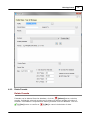
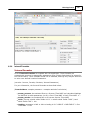
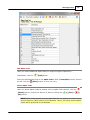
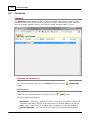
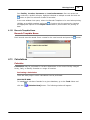
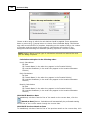
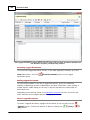
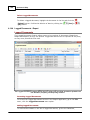
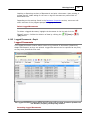
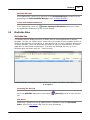
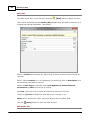
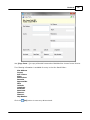
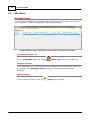
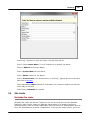
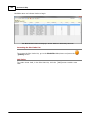
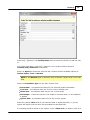
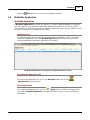
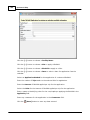
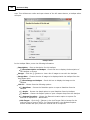
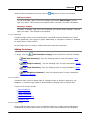
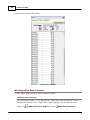
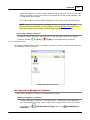
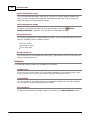
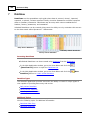
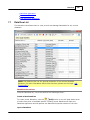
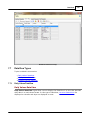
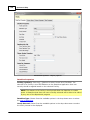
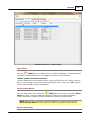
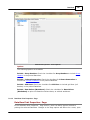
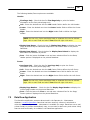
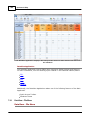
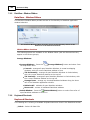
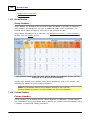
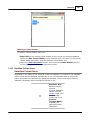
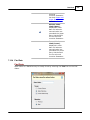
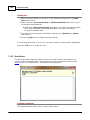
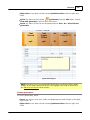
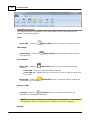
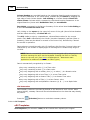
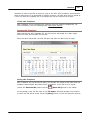
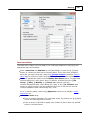
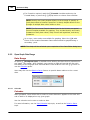
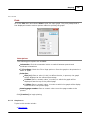
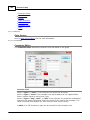
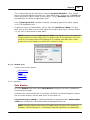
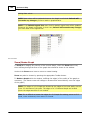
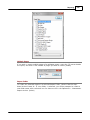
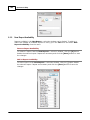
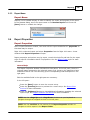
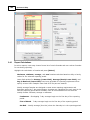
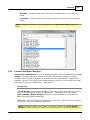
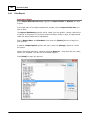
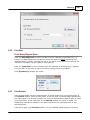
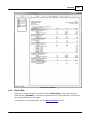
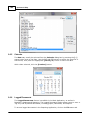
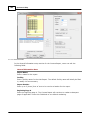
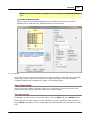
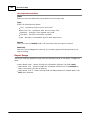
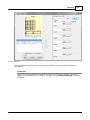
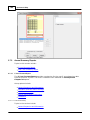
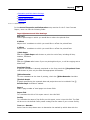
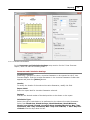
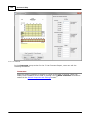
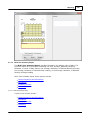
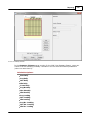
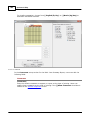
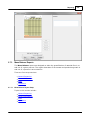
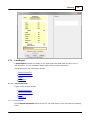
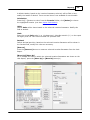
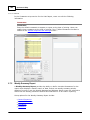
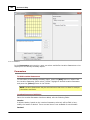
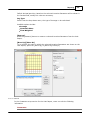
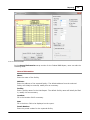
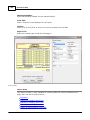
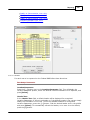
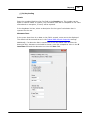
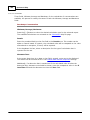
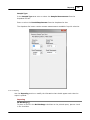
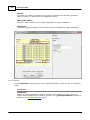
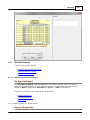
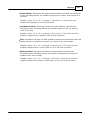
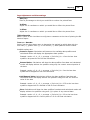
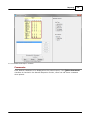
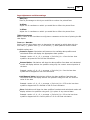
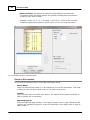
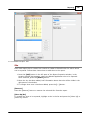
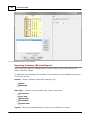
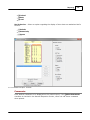
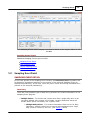
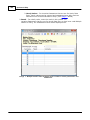
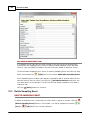
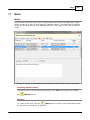
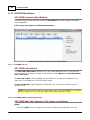
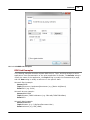
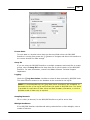
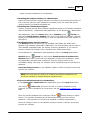
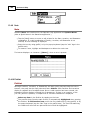
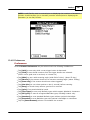
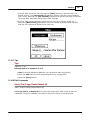
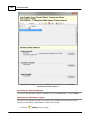
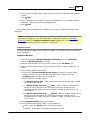
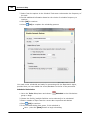
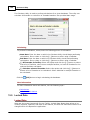
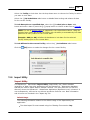
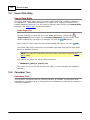
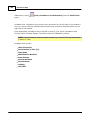
Graphing
235
The X Legend Gap may be specified by using the X Legend Gap Editor. The X Legend
Gap is the minimum distance between the x-axis marks (ticks). Choose the ( ) Fixed radio
button and enter a value in pixels (screen points). The ( ) Automatic radio button allows
the application to choose an appropriate value.
If the [ ]Clip Legend Text checkbox is marked, overlapping legend text will be clipped
(cut) to an appropriate size.
To label the x-axis non-sequentially, enter a value for Label Every ? Marks. The first
mark, and the first mark of each normal period for the data range type, is always labeled
(i.e. the first of each month for daily data).
NOTE: Entering a value for Label Every ? Marks that is greater than the number of
normal periods in the data range type (i.e. greater than 31 for daily data), then the
value for the normal period will be displayed. For example, daily data with a value
greater than 31 will display the month label, instead of a day.
8.4.1.4
Window menu
Topics in this section include:
Data Window
Zoom
Palette Bar
Pattern Bar
8.4.1.4.1 Data Window
Data Window
Go to the Window menu and choose Data Window to displays the data in spreadsheet
form instead of a graph.
It includes the x-axis Legend text as row labels, the Series (Location:Parameter) Legend
text as column headers, and the data shown in each Data cell.
Legend text may be edited by LeftDoubleClicking the appropriate label. Graphed Data
values may be edited by LeftDoubleClicking the appropriate Data cell.
NOTE: Changing graphed Data values does not change the data in the underlying
database. Use the Operator10 - Wastewater DataView application for permanently
© 2014 AllMax Software, Inc.