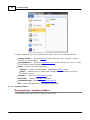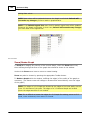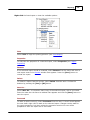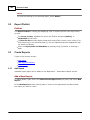
1
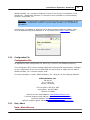
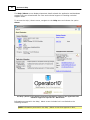
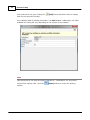
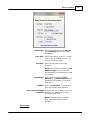
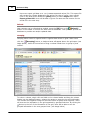
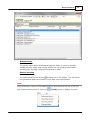
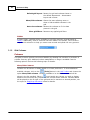
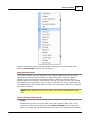
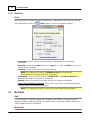
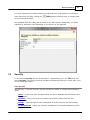
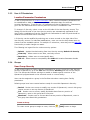
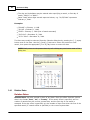
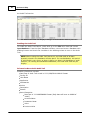
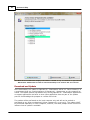
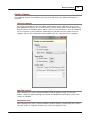
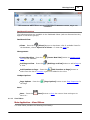
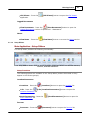
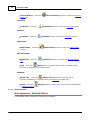
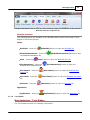
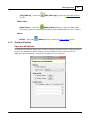
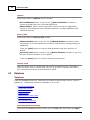
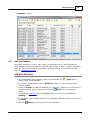
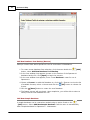
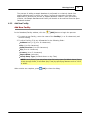
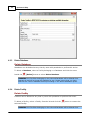
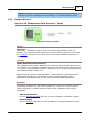
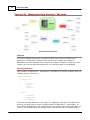
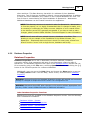
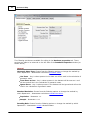
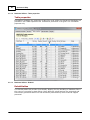
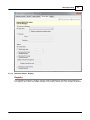
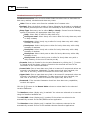
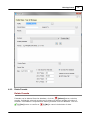
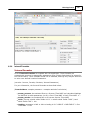
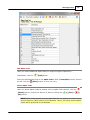
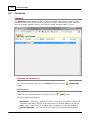
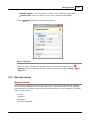
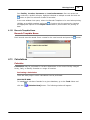
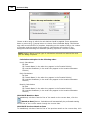
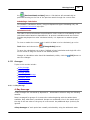
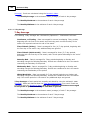
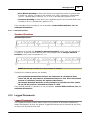
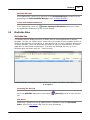
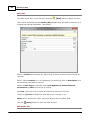
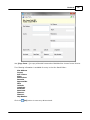
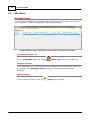
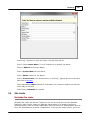
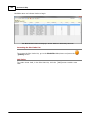
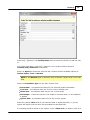
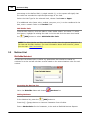
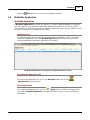
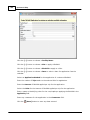
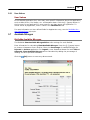
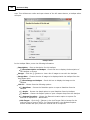
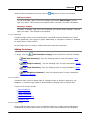
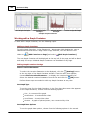
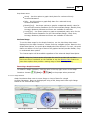
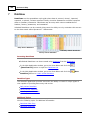
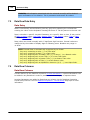
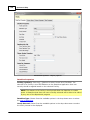
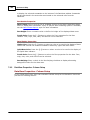
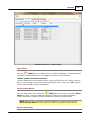
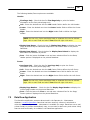
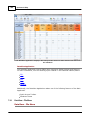
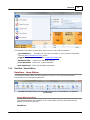
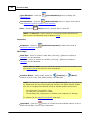
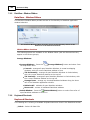
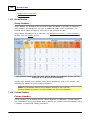
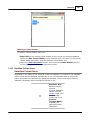
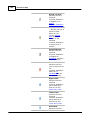
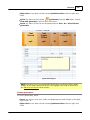
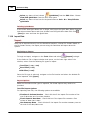
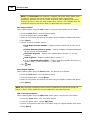
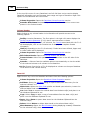
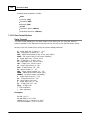
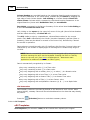
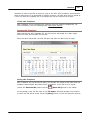
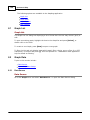
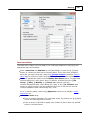
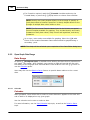
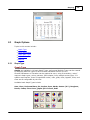
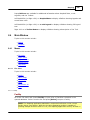
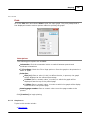
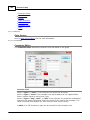
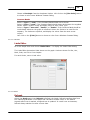
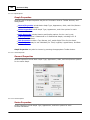
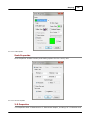
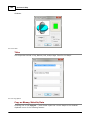
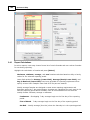
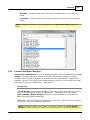
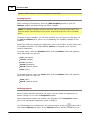
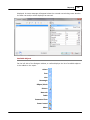
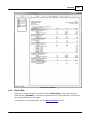
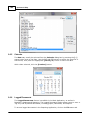
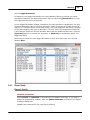
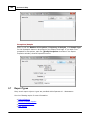
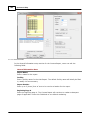
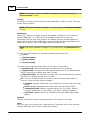
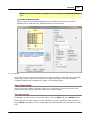
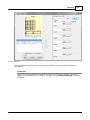
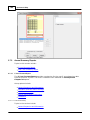
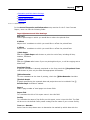
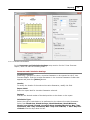
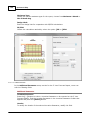
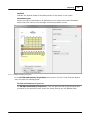
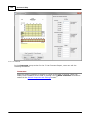
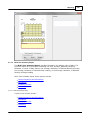
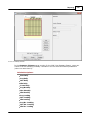
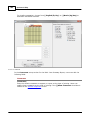
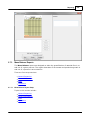
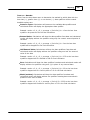
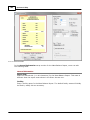
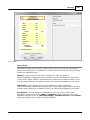
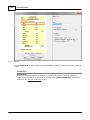
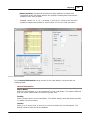
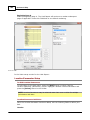
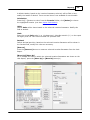
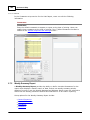
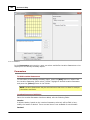
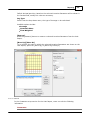
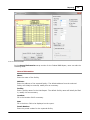
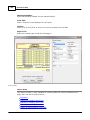
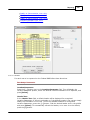
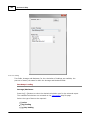
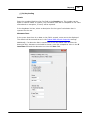
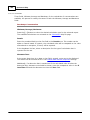
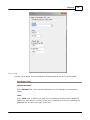
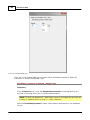
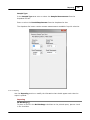
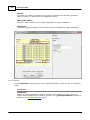
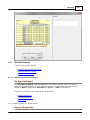
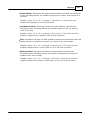
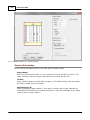
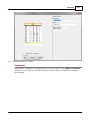
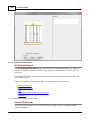
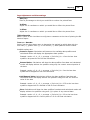
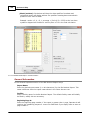
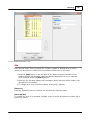
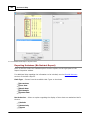
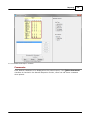
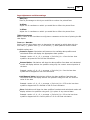
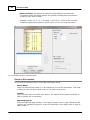
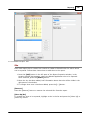
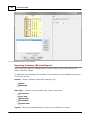
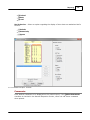
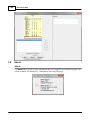
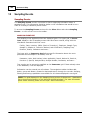
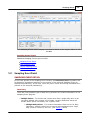
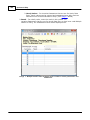
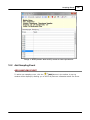
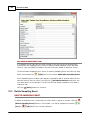
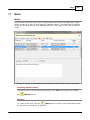
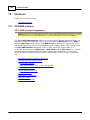
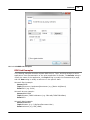
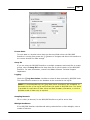
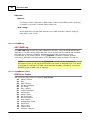
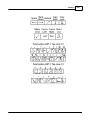
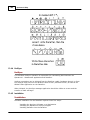
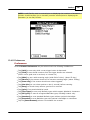
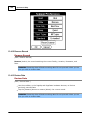
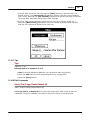
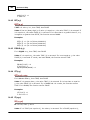
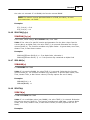
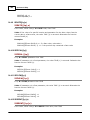
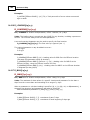
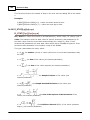
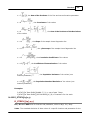
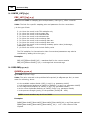
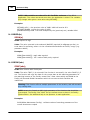
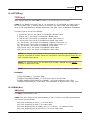
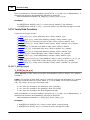
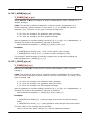
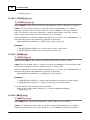
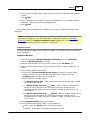
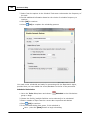
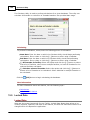
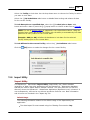
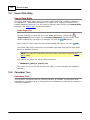
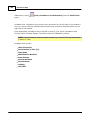
Dashboard
161
drop-down menu:
Hourly - Use this option to graph Hourly data for a selected Hourly
Location:Parameter
Daily - Use this option to graph Daily data for a selected Hourly
Location:Parameter
Monthly[xyz] - Use these options to graph a summarized monthly value for
the selected Location:Parameter for the selected Date Range; Monthly Sum,
Average, Maximum, Minimum and Count are available for selection
Yearly[xyz] - Use these options to graph a summarized yearly value for the
selected Location:Parameter for the selected Date Range; Yearly Sum,
Average, Maximum, Minimum and Count are available for selection
Set Date Range
To set the date range for the Graph Container, use the third drop-down menu
displayed on the Graph Container. Choose from the available options. Based on the
Graph Data Options, the quick dates displayed will be different. For each, the quick
dates are relative to the type of data to be graphed and will provide familiar, easy
to understand date options.
The Custom option will be available regardless of the selected Graph Data Option.
NOTE: Using the Custom option will prompt the user for a start and end date.
Users can select from dates on the calendar or use the Relative Date feature to
enter date options that provide a moving range of data from day to day.
Removing a Graph Container
To remove a Graph Container, click the red X in the top right corner of the Graph
Container. Answer
[Yes] or
[No] to the prompt when presented.
6.1.4.2.3.3 Gauge Containers
Graph Containers allow users to see a Gauge or chart of data for a single
Location:Parameter. Data can be displayed using a Dial, Gauge and Linear style Gauge
based on the selected date range.
Dial Gauge Example
© 2014 AllMax Software, Inc.
Speedometer Gauge Example
Linear Gauge Example