1
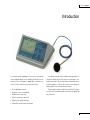
Extension to
INSTRUCTION
MANUAL
SOFTWARE VERSION 4.0
Introducing:
Swept-Sine
measurement
technique
and other new features
nor121
SOUNDANALYSER
nor121
Introducing:
Swept-Sine measurement technique
Nor121 - Extension to instruction Manual March 2006 Edition
Software version 4.0
Introducing SweptSine measurement technique
Im121_5Ed1R0Eng
Norsonic is a registered trademark of Norsonic AS. All other brand
or product names are trademarks or registered trademarks of their
respective companies.
Every effort has been made to supply complete and accurate information. However, Norsonic AS assumes no responsibility for
the use of – nor for the consequential damages of the use of – this
information and/or the instrumentation described herein. Furthermore Norsonic AS assumes no responsibility for any infringement
of the intellectual property rights of third parties, wherever applicable, which would result from such use.
Norsonic AS reserves the right to amend any of the information
given in this manual in order to take account of new developments.
If you wish to communicate with us, please feel welcome.
Our address is:
Norsonic AS, P.O. Box 24, N-3421 Lierskogen, Norway
Find us on the web: www.norsonic.com
Tel: +47 3285 8900
Fax: +47 3285 2208
e-mail: [email protected]
Copyright © Norsonic AS 2006
All rights reserved
Instruction manual
Contents
Introduction
1
Building Acoustics measurements
using Swept-Sine technique
14
General Features
3
Quicker instrument switch-off
Save a new default set-up
SMS command for date and time
0 dB reference selection
Improved modem connections
New weather station connection
3
3
3
4
4
4
Environmental mode
5
Pre-weighting of spectra
Noise criterions (NC, NR, RC)
Marker for external DC failure
5
6
8
Introduction - What is Swept-Sine technique?
Benefits of using Swept-Sine
Principles behind the method
Implementation in Nor121
Excitation signal
Measurement of IRs - deconvolution
Setting up for Swept-Sine measurement
Level Setup
Reverberation setup
Rating and BGN setup
Correction setup
Making Measurements with Swept-Sine
14
15
16
18
18
19
20
22
24
24
24
25
Reference tone on recordings
8
Pure tone mode
9
Improved possibilities
Pre-set pure tone Standards
9
9
Level in channel 2 and SNR display
What does the measured BGN and SNR mean?
What does the “?” displayed with level values mean?
Measurement of high sound insulation values
25
27
27
29
Technical specifications
30
Building acoustic mode
10
Spectrum Adaptation Terms
10
Bandwidth = 1/3 Octaves
Bandwidth = 1/1 Octaves
30
30
Equalizer
11
General
Equalizer implementation characteristics
Using EQ with the pink noise excitation - a cookbook
Using EQ with the Swept-Sine excitation - a cookbook
11
11
12
12
Broadband impulse response
measurements using Swept-Sine
31
Implementation
Making IR Measurements - a cookbook
Transferring measured IR from the Instrument to a PC
Technical specifications
31
31
32
32
Swept-Sine measurement technique
13
page v
Instruction manual
Introduction
The measurement capabilities of the Nor121 sound level
meter depend largely on the options installed in the instrument. This user guide is applicable to software version 4.0 which contains many new features like:
• Pre-weighting of spectra
• Reference tone on recordings
• 0 dB reference selection
The options may be either ordered and installed in instruments delivered from the factory or retrofitted to earlier delivered units. This manual does not describe how to
install the options. Contact the factory or your Norsonic
representative if you need more information.
For description of the sound level meter Nor121 in general, reference should be made to the main user guide for
the instrument.
• Quicker instrument switch-off
• Equaliser for signal generator
• Swept-Sine measurement technique
page 1
Nor121
page 2
Instruction manual
General Features
Quicker instrument switch-off
Save a new default set-up
The Nor121 was originally designed to save the current
set-up by switch-off in order to start up again with exactly
the same set-up. However, this means that the turn-off
procedure lasts for couple of seconds. The new version
has a choice in the Setup menu that will de-activate this
feature allowing the instrument to switch-off immediately.
The consequence, however, is that the instrument may
not start up again with the same set-up that it had just
before switch-off.
The Nor121 contains a default set-up that will always be
loaded by turning the instrument on until a new Standard
set-up is chosen. The operator now has a choice to save
any current setting of the instrument as the future default
set-up just by selecting the field named “Save current
set-up as default” in the Set-up menu and then pressing
the Enter key. If the instrument is later turned off with the
“Save default set-up at switch-off” flag set to “No” (see
the new feature described above), then the instrument will
on subsequent switch-on start with exact the set-up previously chosen as default.
The “Save current set-up as default” feature may also
be activated using the remote control command “SDS”.
SMS command for date and time
The Nor121 will respond to SMS-messages and give the
results from both noise and weather measurements. However, it is now possible to additionally read-out the actual
date and time of the instrument’s clock simply by sending
the SMS-command “CLOCK” to the Nor121.
In the Set-up/Standards menu, the user may save the current set-up as a future default set-up, as well as turn off the
automatic save of current set-up at instrument switch-off.
page 3
Nor121
Improved modem connections
The Nor121 may be used for long term noise monitoring
in a system based on modem connection to the NorXfer
version 4.2 software. Earlier versions of the Nor121 occasionally had some problems with the output buffer when
the modem connection was broken. This has now been
improved and the stability of such remote connections is
much better with the version 4.0 internal software.
0 dB reference selection
New weather station connection
The Nor121 has had the possibility to choose different “0
dB reference” values in order to make measurement in dB
relative to either sound or vibration units. The choices are
2.0e-5 (sound), 1.0e-6 (acceleration) and 5.0e-8 (sound
particle velocity). The “normal” value is the 2.0e-5 (i.e. 20
micro Pascal). When another reference is chosen, the dB
labels are displayed with inverse video in order to avoid
the misunderstandings with “normal” dB values.
In the new version, the selection of the “0 dB reference” value is moved from the Range/Calib menu to a
separate Range / 0 dB reference menu in order to avoid
possible misunderstanding or wrong selection by a user
that is working under pressure.
The original version of the Nor121 only connected to the
Reinhard weather station type MWS9. The new version of
internal Nor121 software now additionally communicates
with the new model MWS9-5 and MWS5.
The 0 dB reference selection is now moved to a seperate
sub-menu.
page 4
Instruction manual
Environmental mode
Pre-weighting of spectra
The graphical and numerical displays of frequency spectra within all the reports in the Environmental mode, may
now be viewed via a selectable A-weighting filter. This Apreweighting feature is turned On/Off in the Set-up/Display menu.
The presence of A-pre-weighting is clearly indicated
in the various displays as all values are followed by a
“dB(A)” indication instead of the normal “dB” label.
All frequency spectrum displays in the Environmental mode may be viewed
without any pre-weighting (left) or with the new A-pre-weighting feature (right).
page 5
Nor121
Noise criterions (NC, NR, RC)
Many applications, particularly in the heating & ventilation
industry, require the use of noise rating criteria that compare the frequency spectra of the measured noise levels
against reference curves.. Version 4.0 of Nor121 provides
the standardized NC, NR and RC noise rating criteria,
and hence any spectrum measured in the Environmental mode may therefore be evaluated using these criteria.
This new feature is available from a soft key displayed
below all the level vs. frequency numerical tables with the
results displayed in a dialogue box.
These noise criteria normally require a 1/1-octave frequency spectrum, however if a 1/3 –octave spectrum is
selected the Nor121 will automatically re-calculate it into
an appropriate 1/1-octave spectrum prior to noise criterion evaluation.
The Noise Criterions evaluation
are calculated and presented
as a table by a push on the
Criterion softkey displayed with
the numerical frequency table of
the selected report
page 6
Instruction manual
The Noise Criterion evaluation search the highest 1/1-octave band that fits below the applicable noise
criterion lines. The evaluation is performed in 1 dB steps. 1/3-octave spectrums are re-calculated into
1/1-octave spectrums prior to evaluation.
page 7
Nor121
Marker for external DC failure
When the Nor121 instrument is used for long-term noise
monitoring powered by an external 12V supply, with the
internal battery as backup, it may be useful to know if the
external power source has powered down at any time
during a running measurement. By entering the name
“Ext DC fail” for marker no.9 the Nor121 will automatically
activate this marker each time the external DC is absent.
When the external power for the Nor121 is restored again,
the marker will be turned off. Hence, at the end of a longterm measurement, the operator may view the absent
time periods as a marker along the level vs. time display,
or, at the PC using the NorReview post processing software. This feature will indicate if the instrument was, for
example, powered down and moved to another location
during the measurement.
Reference tone on recordings
When the Nor121 is used to make true audio recordings of
the measured sound it is often necessary for them to be
replayed as part of either mediation or legal proceedings.
In these circumstances it is important to be able to adjust
the speaker, or headset, to the correct level in order for a
non-technical audience to appreciate the original acoustic environment. The new version of Nor121 has therefore
the possibility to record a reference tone at a pre-defined
level that can be used as a reference to adjust the headset or speaker level.
The reference tone can be recorded at the start of the
measurement, and additionally at any time during that
particular measurement. The maximum level of the reference tone is 1 V rms, but may be set to a lower level in the
RangeCal / Ref. Tone menu. The length of the reference
tone after activation may also be selected. In the same
menu the type of signal used for the reference tone may
page 8
be specified; in addition to a single sine wave, at a user
specified frequency, White, Pink, or Band-filtered random
noise are optionally available. These latter selections will
be helpful where standing waves in the replay environment
make it difficult to set the correct level. These reference
noise feature requires that the Option 3A is available.
Prior to the use of the reference tone the “AC output
ch.2” in the Set-up/ I/O menu must be selected as “Signal
gen”. The reference tone is selected via the Activate reference tone field in the RangeCal / Ref. Tone menu, and
then activated by pushing the Enter key. Alternatively, providing that one of the single markers is preset to the name
“Ref tone”, the reference tone may be activated by selecting that marker number key on the Nor121 front panel.
In the pre-stored setups, these new reference tone settings are implemented within the standard setup named
“Annoyance Recorder”.
Instruction manual
Pure tone mode
Improved possibilities
Pre-set pure tone Standards
In the MeasSetup menu, there is now a choice between
the algorithm specified in the DIN 45 681 (Entwurf 2001)
and the algorithm specified in both the ISO/DIS 1996-2
(2005) and in the Joint Nordic Method—Version 2. For
the ISO/JNM algorithm, the parameters “Delta” and “Regression Range” may also be adjusted. The operator may
speed up the pure tone analysis by deactivate the search
for moving pure tones, selecting the lowest level of analysis (“Lmin”) and/or turning off any analysis below hearing
threshold.
In the Set-up/Standards menu, there is now a wider range
of preset Standards for pure tone analysis. This includes
all the above mentioned Standards plus the special Joint
Nordic Method (JNM) for wind turbines.
It is also possible to conduct FFT analysis for the use
with the DIN 45 681 standard from 2005. FFT data are
stored in the instrument and can be later transfered to a
PC where the pure tone analysis can be performed using
a special macro for Microsoft Excel.
Another possibility for performing a pure tone analysis
is to make recordings of the sound in the form of 16-bit
wav files. These files can then be transfered to a PC and
pure tone analysis can be done using the NorReview post
processing software
The MeasControl/PureTone menu now contains more features
in order to analyse for pure tones in accordance with different
Standard proposals.
In the Set-up/Standards menu, the user may choose among
preset set-ups in accordance with misc. Standard proposals.
page 9
Nor121
Building acoustic mode
Spectrum Adaptation Terms
The Average Rating Report is now also calculating the
Spectrum Adaptation Terms as given in the ISO 717
Standard. These terms are calculated both for airborne
and impact sound insulation measurements. When an extended frequency range is used for the measurement the
corresponding terms are calculated as well.
All the terms are displayed in a sub-menu that is accessed from the leftmost soft key below the display when
the Average Rating Report is displayed in either graphical
or numerical format.
The Spectrum Adaptation
Terms are calculated and
presented by a push on the
leftmost softkey displayed in
the Average Rating Report.
page 10
Instruction manual
Equalizer
General
Equalizer is a new feature introduced with software version 4.0. It is used with signal generator in building acoustics mode to provide the user with even better control over
the excitation signal.
The international standard ISO 140-4 specifies that
the excitation signal shall be such that the level difference
between adjacent one-third-octave bands shall not be
greater then 6 dB. In other words it is required that the
frequency characteristic of excitation signal is sufficiently
flat. Rooms and loudspeakers hinder us from having this
requirement always fulfilled, hence we need an equalizer
to control the difference. This provides the possibility to
fine-tune the spectrum of excitation signal to every sending room ensuring the fulfilment of standard requirements
and quality of measurement results.
menu. However, it is advisable to use equaliser in order
to lower the levels in those bands where it is necessary
rather then to boost level in other bands.
Figure below shows that positive gain at one frequency
(upper curve) will result in negative gain correction of the
output. The result is that the actual gain cannot exceed 0
dB (lower curve) in order to protect the loudspeaker and
the amplifier.
Equalizer can be used with both noise excitation and
Swept-Sine excitation. Equalizer gains can be adjusted
while the generator is running with pink noise excitation.
If Swept-Sine excitation is used the gains has to be adjusted prior the measurement.
Please note the equalizer cannot be used with SweptSine excitation when sweep duration parameter has value
“Long”.
Equalizer implementation characteristics
The equalizer implemented in Nor121 is a 21 band equalizer with one-third-octave bandwidth. The central frequencies of filters are at one-third-octave bands’ mid-frequencies from 50Hz to 5kHz.
Gain in each band can be adjusted from +6dB to -6dB.
If positive gains are used, the overall level will be correspondingly lowered in order to prevent speaker and
amplifier overload. If the user needs more power it can be
added by increasing “Level” parameter from “Generator”
page 11
Nor121
Equalizer can be used with both one-third-octave and
one-octave band resolution. When used with octave resolution, gain is applied to all three one-third-octave bands
constituting that octave.
Equalizer gains are saved at instrument switch-off.
Using EQ with the pink noise excitation
- a cookbook
1. Place the speaker and microphone in the sending
room, and connect everything as desired.
2. Open generator menu
Using EQ with the Swept-Sine excitation
- a cookbook
Basically the same as with the pink noise excitation except that the generator can not be started separately and
therefore EQ cannot be adjusted while playing excitation
signal. Instead, the user is advised to do the following:
1. Make a test measurement first, look at the display that
shows the level in sending room.
2. Open the “Generator” menu and adjust EQ as desired.
3. Make a new measurement with EQ On.
As an alternative, you may adjust the equilizer by using
pink noise before the Swept-Sine mode is entered.
3. Press “Gen On/Off” software key again in order to start
the generator.
4. The measured levels in each band are shown on display, both as numerical values and graphically.
5. Use inner LEFT and RIGHT arrow keys to move cursor
between frequency bands. Current frequency can be
seen above the graphical display (e.g. f=1 kHz in the
figure)
6. While standing on the “Equalizer” parameter use inner UP or DOWN keys to toggle between EQ “On” or
“Off”.
7. While standing on the “Gain at this frequency” parameter use inner UP or DOWN keys to adjust gain at
the frequency of the cursor. Gain is adjusted in 1 dB
steps.
8. Move the cursor to another frequency and if necessary
repeat the step 7.
page 12
User interface
Open the “Generator” menu and two parameters related
to EQ are:
1. “Equalizer”, values: {On, Off}, turns generator on/off
2. “Gain at this frequency”, values: [-6, 6] dB, adjusts the
gain at each frequency band individually
Instruction manual
Swept-Sine
measurement technique
Building acoustic measurements under difficult situations, such as high background noise in the receiving
room, may be greatly improved by use of the SweptSine measurement technique. This technique may also
be used for measurement on high-performance sound
insulations that is impossible to measure with traditional
technique.
The previous Norsonic analyzer Nor840 offered a similar
feature with its unique MLS (Maximum Length Sequence)
measurement mode. The new Swept-Sine technique
within the Nor121 analyzer is also based on the impulse
response of the measured rooms, but the Swept-Sine
technique is more robust for environmental influences
such as temperature and wind than the MLS technique.
Hence, Norsonic has taken a new step forward by implementing a new improved feature.
Both the MLS and Swept-Sine measurement technique for use on building acoustics application are described in ISO 18233. This new standard, currently at the
FDIS-stage, will probably be turned into a legal standard
early 2006, which means that sound insulation tests may
be performed using this new technique as an alternative
to the traditional ISO-140 technique.
The Swept-Sine measurement technique is available
for all Nor121 units equipped with version 4.x and the new
option 14 SweptSine technique.
Swept-Sine measurement technique is an optional extension for the Nor121. Furthermore, it is an extension of
building acoustic measurement mode of Nor121.
Swept-Sine based measurements on Nor121 can be
performed with two aims in mind. The first one is to obtain
results used in the building acoustics such as airborne
sound insulation and reverberation time. Application of
Swept-Sine technique to this type of measurement is described in the first part of this chapter. As a contrast to this
highly specialized task, the second type of measurement
that Swept-Sine provides, is much more general. It is dual
or single channel measurement of broadband impulse
response and is described in second part of this chapter. As an impulse response is a fundamental quality in
system analysis in general, its measurement with Nor121
can be performed in broad range of applications, even
beyond field of acoustics!
page 13
Nor121
Building Acoustics measurements
using Swept-Sine technique
Introduction What is Swept-Sine technique?
Classical method for the measurement of sound transmission phenomena uses random noise or impulse signals
as excitation. The resulting levels or decay times are determined directly from the recorded responses.
In order to measure with greater accuracy and repeatability, new measurement methods have been developed.
They use deterministic signals as excitation and apply
digital signal processing principles to obtain the impulse
response of system under test. This is a great advantage
as all acoustical parameters can be obtained from further
processing of the impulse response. This makes these
methods applicable to all areas of acoustics.
In building acoustics, this method is applicable to
sound pressures measured in rooms as well as to the
velocities measured on structures. In room acoustics impulse response plays a central role as many acoustical
quantities can be derived from it, as specified in International standard ISO 3382. Development of transducers
such as loudspeakers and microphones involves numerous measurements of frequency response function, which
is linked to the impulse response by Fourier transform. Vibroacoustics, acoustical profiling (sonar) and many other
areas are closely linked to measurement of impulse responses. Even high-end fields like virtual acoustic, which
is a part of virtual reality strongly rely on convolution with
impulse responses with high signal to noise ratio.
page 14
Impulse response is also indirectly involved in the
classical method with noise excitation as the measured
response to such excitation can be described as a convolution between the excitation signal and the impulse response of the room. However, in such case the response
to noise excitation is recorded directly and information
about the impulse response is normally not known.
Several new measurement methods may be applied
to obtain the impulse response as described in standard ISO 18233. One of those methods, based on use of
maximum length sequences (MLS) became very popular
in the 1980s due to the ability to use computer features
available at that time. However, MLS based techniques
have some undesirable properties such as vulnerability to
distortion and time variance. Those undesired properties
motivated further research which resulted in even more
advanced method, known as Swept-Sine.
The Swept-Sine is a measurement method, which uses
an excitation signal of a sinusoidal shape whose frequency increases from low to high frequencies. The response
to this excitation is recorded by the analyser and the impulse response between source and receiver position is
extracted by the use of a mathematical technique known
as deconvolution.
Instruction manual
Benefits of using Swept-Sine
The international standard ISO 18233: Acoustics - Application of new measurement methods in building acoustics focuses on use of MLS and Swept-Sine techniques.
Both of them provide the possibility to conduct measurements in high background noise, which is the huge advantage over classical method. MLS technique achieves
this by synchronous averaging which is very effective
against random noise but unfortunately increases sensitivity to distortion and time variance. This limits the use of
MLS. Swept-Sine is much more resistant to this and it has
reduced sensitivity to time variance, extended signal-tonoise ratio (SNR) and high distortion immunity.
The transmission of sound within a room as well as the
transmission of sound between rooms may normally be
regarded as an approximation to a linear and time invariant
system. However, if time variance increases as a result of
temperature changes and air movement, this assumption ceases to hold. This can result in distorted shape of
impulse response and decreased SNR. Measurements
with sweeps are less vulnerable to those unwanted effects
of time variance than measurements with MLS. In outdoor
measurements and under windy weather conditions where
a)
air movement is expressed, sweeps are sometimes the only
viable option when measuring impulse responses.
The measured impulse response is normally the combined impulse response of the system consisting of amplifiers, transducers, applied filters, and the enclosure
between the transmitting and the receiving points.
Thanks to known fact that crest factor, which is a ratio
of peak to RMS voltage, of a sine signal is only 3.01 dB,
Swept-Sine excitation can be fed to amplifier and loudspeaker with substantially more power than noise signal.
As more signal power means better SNR, sweep measurements can provide signal-to-noise ratios in excess of
100 dB at quiet sites. This extended measurement range
enables a measurement under situations where no result
is obtained by the classical method.
Due to use of signal processing, the new method is
more immune to noise from other sources such as clicks,
pops and even footsteps. This is very important in building acoustics where measurements sometimes need to
be conducted on construction site while work is still underway.
The use of linear deconvolution allows all distortion effects from an overloaded loudspeaker to be deleted from
the results.
b)
Figure 1. a) Time-frequency representation of pulse excitation b) t-f representation of response to pulse excitation
page 15
Nor121
Swept-Sine does not require synchronization between
generator and receiver. For MLS this was the issue as the
errors in synchronization degrade the measurement. Presending, which is necessary with MLS in order to reduce
influence of transients is obsolete with Swept-Sine.
Principles behind the method
To explain principles behind Swept-Sine method let us
first take a look at classical pulse excitation (by start-pistol for example) and its response. Let us assume that excitation pistol will produce a pulse whose energy covers
the frequency range of at least 50 Hz to 5 kHz, which is
our range of interest. With such pulse all excitation energy
appears at all frequencies at the same time. Response
to such pulse also contains information at all frequencies
at the same time as shown in figure 1. So measurement
is undertaken for all frequencies at only one instance of
time. The inherent drawback is that a large amount of energy has to be delivered at once. This limits the signal to
noise ratio.
To obtain higher signal to noise ratios, more excitation
energy has to be used. Both Swept-Sine and MLS tech-
nique exploit this approach. With MLS, we simply shoot
several pulses and we do it very fast and for several seconds or even minutes. Each of those pulses delivers energy at all frequencies and they are very close so signal
has spectral density of white noise. Each of pulses will
have its own response whose tails will overlap to form a
noise-like response signal.
To depict this in a way which is analogous to pulse
excitation, we need to observe two isolated pulses at time
instances t1 and t 2 as depicted in figure 2. Note that signal itself would not look like this but responses to those
pulses would be buried into thousands of responses from
other pulses. However this representation is convenient to
depict the physical process.
To obtain one impulse response from noise-like response signal we use a mathematical method known as
Hadamard transformation, which does nothing else but
shifts all those responses back in time in proper order so
that all of them appear at the same time. After this they are
summed. Let us emphasize that this operation involves
summing of energy at each frequency obtained at different time instances. Note that all frequencies are measured in several time instances.
b)
Figure 2. a) Time-frequency representation of part of MLS excitation b) t-f representation of corresponding part of response
page 16
Instruction manual
The effect of air fluctuation (wind) and temperature
fluctuations is that the speed of sound changes over time.
This means that response obtained at lower speed will
be stretched in time as it takes more time to gather all the
energy. The reflections arrive later as they travel slower.
Let us assume that such a change of speed of sound
happens between two time instances t1 and t 2. Figure 3
represents level as function of time for fixed frequency f1.
As an increase of speed of sound it is noticeable that response appearing at t 2 is shorter than response appearing at t1.
Synchronous averaging shifts both responses to time
0 and averages them. This means that it is necessary to
sum up two responses: “the right one” (at t1) and “the
compressed one” (at t 2).
Resulting decay will be distorted and resulting noise
floor will be higher as noise will not be averaged out.
With Swept-Sine we do not shoot pulses at all. We can
think of Swept-Sine excitation as of one pulse stretched
in time. It is therefore no wonder that synonyms like chirp
and time-stretched pulse also appear in the literature.
Let us for the moment look at the pulse not in time but
in frequency domain. It covers the range of frequencies
from 50 Hz to 5 kHz. If we would use a sine signal at 50
Hz frequency and constantly increase it’s frequency up
to 5 kHz the spectrum would be the same. So this signal
will produce the same effect as a pulse when considered
over a period of time. Because the frequency of the signal
changes we would be at one frequency at exactly one
instance of time. The response recorded with the instrument is also a sine signal but it is changed by the influence of the system under test. To transform this signal
into impulse response we need to perform mathematical
operation known as deconvolution. The effect of deconvolution is to transfer responses at individual times (and
frequencies) so that they appear at the same time.
Figure 3. Decay curve gets compressed as a consequence
of increase of speed of sound
1
Figure 4. Resulting decay curve gets distorted
page 17
Nor121
The reason why Swept-Sine technique is less sensitive to time variance is that response to each frequency
appears at exactly one instance of time. This means that
deconvolution only shifts and aligns responses at different frequencies i.e. there is no summation of several responses at same frequency which might be time-scaled
differently.
Implementation in Nor121
The combination of a powerful digital signal processing
hardware components in the hand-held sound analyser
Nor121, and carefully crafted algorithms enabled implementation of such an advantageous technique as SweptSine.
Furthermore, every effort has been made to fit the
Swept-Sine algorithm into existing user interface of
Nor121’s building acoustics measurement mode. This
requires the minimal effort for an user who is already experienced with classical measurements to become effective with Swept-Sine technique. As a matter of fact, some
functionality became even easier to use.
The technique is implemented in accordance with international standard “ISO 18233 Acoustics - Application
of new measurement methods in building acoustics”.
a)
Excitation signal
A sinusoidal signal is used for the excitation, whose frequency increases exponentially with time. This means that
the time to sweep through each fractional-octave-band
is constant. The energy per fractional-octave-band will
therefore be the same, and the spectrum of the excitation
signal will have a pink character.
The sweep is started at or below the lowest bandedge frequency of the lowest fractional-octave-band
to be measured and continues upwards to at least the
upper band-edge frequency of the highest fractionaloctave-band to be measured. Fade-in and fade-out are
applied at beginning and end of the excitation signal to
protect loudspeaker from transients. The acquisition time
for recording the sweep response has to be longer than
the sweep itself to collect the reverberated sound. This
should be thought of as if the generator delivers silence
for a period of time after the sweep is finished.
b)
Figure 5. a) Time-frequency representation of SweptSine excitation b) T-F representation of response to SweptSine
page 18
Instruction manual
Measurement of IRs - deconvolution
Normally, in building and room acoustic measurements,
the aim is to obtain results in octave- or third-octave bands.
This is achieved by one continuous sweep through all of
the bands. The energy in eacg band of interest is separated from the energy in other bands by filtering. In the
Swept-Sine implementation, filtering is done by means of
time and frequency domain windowing. For this purpose
hybrid windows were developed. Those windows had to
satisfy a number of constraints. Most important, they satisfy the frequency response requirements for a class 1
fractional-octave band filters as specified in IEC 61260.
At the same time they produce short virtual reverberation
time. This is very important as virtual reverberation time
limits the shortest reverberation time that can be measured. In Swept-Sine case, those times are considerably
shorter then at the classical method.
S
With present implementation, it is possible to measure
in one-third-octave bands with midband frequencies from
50 Hz to 5 kHz i.e. 21 one-third-octave bands or in octave
bands with midband frequencies from 63 Hz to 4kHz i.e.
in 7 octaves. The duration of the sweep is directly proportional to amount of energy used for excitation. The longer
the sweep time, the greater the resistance toward background noise present at measurement site.
For measurement of reverberation time, background
noise is seldom a problem as the excitation loudspeaker and measuring microphone(s) are in the same room.
Therefore a sweep duration of approx. 15 s for octave and
approx 60 s for third-octave bands has been chosen for
measurement of reverberation time. These durations in
normal measurement conditions can provide signal-tonoise ratio of up to 100 dB which is far more then what the
standard requires.
l
r
()
Figure 6. Block diagram of implementation in Nor121
page 19
Nor121
For measurement of levels, the signal-to-noise ratio in
the receiving room might be an issue. In such situations
the user is provided with parameter named “Sweep Duration”. It offers the choice between three values named
“Short”, “Medium” and “Long”. Table below contains
information about duration per bandwidth (inverse of
sweep speed) and the total duration for a sweep covering
the frequency range of third octave bands with midband
frequencies from 50 Hz to 5 kHz and octave bands with
midband frequencies from 63 Hz to 4 kHz. Noted that this
parameter has no influence on the sweep duration for octave band measurement.
The lengths of the measured impulse responses (IR)
exceed 10 s. Block diagram of implementation in Nor121
is presented in figure 6. It is important to notice that despite the use of spectral division, a linear deconvolution
has been implemented. This is important as it enables
removal of distortion components from the measured impulse response.
Setting up for Swept-Sine measurement
Our traditional motto “Measurements made easy” has
been followed during implementation of the Swept-Sine
method. User already experienced with classical measurement will find it easy to start using tje Swept-Sine
technique as the structure of user interface and menus
is unchanged. Practically there is just a need to get used
to a reduced set of parameters as Swept-Sine technique
does some settings automatically. Predefined standard
setups allow the user to completely set up the instrument
for measurement by loading one of the standard setups
from setup menu. The setup menu may appear at start-up
by default. The menu is also accessible by pressing the
Setup key.
However, if it is necessary to perform measurements
which are different from the standard setup, parameters
can be changed from measurement control menu. (Accessed by pressing the Meas Control key.) The menu is
divided in several subparts each of which is accessible
via a corresponding soft key.
Octave bands
Sweep Duration
page 20
Third-octave bands
Total Duration [s]
Duration per bandwith
[s/octave]
Total Duration [s]
Duration per bandwidth
[s/one-third octave]
Short
14
2.1
60
2.9
Medium
14
2.1
336
16
Long
14
2.1
762
32
Instruction manual
The instrument is equipped with 7 standard setups for Swept-Sine measurements:
1. Impulse Response Measurement, Swept-Sine is used for broadband impulse response measurements which are closely
described in second part of this chapter.
2. Reverberation time, Sweep is the setup intended for general measurements of reverberation time. Both channels are used
for measurements in one-third octave bands with midband frequencies from 50 Hz to 5 kHz
3. Swept-Sine, Airborne normalized level dif sets the instrument to perform the measurement in accordance to International
Standard ISO-140-4. This is the same type of measurement as with setup ISO-140-4, Airborne normalized level diff just with
the Swept-Sine method
4. Swept-Sine, Airborne sound reduction index sets the instrument to perform the measurement in accordance to International Standard ISO-140-4. This is the same type of measurement as with setup ISO-140-4, Airborne sound reduction index
just with the Swept-Sine method
5. Swept-Sine, Airborne standard. level diff. sets the instrument to perform the measurement in accordance to International
Standard ISO-140-4. This is the same type of measurement as with setup ISO-140-4, Airborne standard. level diff. just with
the Swept-Sine method
6. Swept-Sine, Façade loudsp, sound red. inx. sets the instrument to perform the measurement in accordance to International Standard ISO-140-5. This is the same type of measurement as with setup ISO-140-5, Façade loudsp, sound red. inx.
just with the Swept-Sine method
7. Swept-Sine, Façade loudsp, std. level diff sets the instrument to perform the measurement in accordance to
International Standard ISO-140-5. This is the same type
of measurement as with setup ISO-140-5, Façade loudsp,
std. level diff just with the Swept-Sine method
Tip: You are not confined to stick with the selected setup. It
may be modified as much as you like - and even stored as
one of your own setups for later use. As default the setup
menu appears at start-up. If you don’t want this option,
select No in the lower parameter field. The menu can be
accessed any time by pressing the Setup key. Note that
changing the setup will delete any unsaved measurements.
However, a warning will always be given.
Figure 7. Setup/Standards menu, accessed with SETUP key
page 21
Nor121
Level Setup
Level setup menu is presented in figure 8. It is used to
contol the input channels, the frequency range, the
measurement duration and the dispaly of results. Most
of parameters are identical to those used for traditional
measurement so only the parameters introduced with
Swept-Sine will be described here.
If parameter “Show unreliable values“ is set to “On”
then all level values will be displayed but marked with
“?” if judged unreliable. The symbol “?“ is used to mark
measured values as unreliable if the measured signal to
noise ratio is bellow a chosen threshold. More about level
values and use of “?” symbol can be found in the chapter
“What does the “?” displayed with level value mean?“.
Parameter “Required S/N-ratio“ sets the threshold for
marking the level results with “?”. If this value is set too
high, there will be too many question marks. If this value is
too low, there will be less question marks but some values
might deviate from the correct value without any warnings.
Figure 8. Level setup is part of measurement control menu,
accessed by Meas Control key
page 22
Parameter “Sweep Duration” can have three values:
“Short”, “Medium” and “Long”. This parameter together
with “Frequency range” and “Bandwidth” affect the total
duration of excitation which is displayed at the bottom of
the menu.
The idea behind the Sweep duration parameter is following: The “Short” duration is considered as the default
value. It is expected that this setup will give satisfactory
results for most applications. The other two longer durations are meant to be used only in cases the noise level
in receiving room is too hight such that “short” duration
measurement cannot produce reliable results. In this case
an increase in SNR can be achieved by exciting the room
under measurement with more energy which is equivalent
to delivering excitation energy in a longer period of time.
In order to save time it is suggested to first try to
measure with “Short” sweep duration. Only if the
results of such a measurement are marked as unreliable (with “?”) the medium or long durations should
be chosen.
Instruction manual
A
B
C
D
E
I
F
G
H
A Upper range for measurement
B One or both channels can be selected for measurement, just as with classical measurement
C Excitation type can only be SweptSine. Only this exitation is available in Swept-Sine standard setup.
D Details parameter, dispalys group of parameters marked with I on the screenshot
E Primary and secondary level range reverberation times, Secondary is measurement if it is not possible to measure
primary RT
F Defines the distance from estimated level of noise floor to the lower end of the level range from which the reverberation times are calculated. This parameter directly influences the condition for reliability of results (display of “?” sign
with the value). Meaning is the same as in classical measurement.
G These parameters define frequency resolution and range for the measurement, valid parameters for Swept-Sine
measurements are in range 63 - 4k Hz for Bandwidth 1/1Oct and 50 - 5k Hz for Bandwidth 1/3 Oct.
H In building acoustic measurement this parameter should be kept Off. Turning it on activates measurement of broadband impulse response, which is described in second part of this chapter.
I
Parameters which constitute the Details group
Figure 9. Reverberation setup with parameters explained
page 23
Nor121
Reverberation setup
Rating and BGN setup
Reverberation setup menu is presented in figure 9. This
menu contains three submenus depending on excitation
type. Each of submenus contains ia details switch. When
Details is set to On, additional parameters are displayed.
Although intended for advanced users, this menu is quite
simple to use. If parameter Details is set to Off, the details
will not be displayed (see figure 9). Parameters from Details group are described in the figure. The use of other
parameters similar to classical measurement.
Please note that parameter “BGN correction” from Rating
setup menu (displayed in figure 10) is automatically set
to “On” when any of SweptSine related setups is loaded.
This is because measured levels are automatically corrected for background noise with Swept-Sine technique.
Even if user changes the value of this parameter to Off,
the correction will still be applied since it is a part of the
method.
For the same reason there are no accessible parameters from Measurement control/Background level setup
(accessible by BGN soft-key from the measurement control menu. A message “The measured levels are automatically corrected for the apparent background noise when
sweep is excitation type” is displayed instead.
The use of other parameters from Rating setup menu
is the same as for classical measurements. Please refer to
main user manual for details.
Correction setup
The use of correction setup menu is the same as for a
classical measurement. Please refer to section “Applying
corrections” in main user manual for details.
Figure 10. Rating setup, part of Measurement control menu
page 24
Instruction manual
Making Measurements with Swept-Sine
Making measurements using Swept-Sine technique is
even simpler than with the classical method, as it is not
necessary to measure background noise levels separately. As measurement is usually conducted in accordance
with an appropriate standard it is advisable to use standard setups and follow the instructions given in section
“Measuring airborne sound reduction between rooms - a
cookbook” from the main instruction manual. The rest of
this chapter will focus on things that are specific to SweptSine.
Level in channel 2 and SNR display
It is possible to measure levels in source and receiving
room as well as reverberation times in receiving room.
However, it is neither possible, nor needed, to measure
background noise levels separately as with a classical
measurement. With Swept-Sine technique, background
noise level is measured as a part of a normal level measurement. There is no need for compensation as this is
performed automatically.
An extra display has been added to the Level report. This display, which is presented in figure 11, contains measured levels and measured background noise
(BGN). To display the measurement results from this display in numeric form, as shown in figure 12, simply press
the Num key. Press Num key again to return to graphical mode. Pressing Display key instead will take you to
the next display in the sequence. The whole sequence of
available displays is presented in figure 13.
Figure 11. Levels in receiving room and measured background
noise (BGN) levels are now displayed for LAST register
Figure 12. Channel 2, BGN and SNR as numerical table
page 25
Nor121
S
LEVEL
Figure 13. Sequence of displays in Level report
page 26
Instruction manual
Tip: Do not correct for the background noise level!
Note that Swept-Sine method compensates for the
apparent background noise automatically. Therefore
do not attempt to make any further compensation for
the noise yourself, as you are used to do with conventional measurements!
What does the measured
BGN and SNR mean?
It is important to note that signal-to-noise ratio (SNR) obtained with Swept-Sine measurement is not the same as
SNR obtained with classical measurement. SNR in classical measurement is ratio between excitation signal and
background noise in the receiving room, at microphone
position. What is measured with the Swept-Sine technique is the SNR with processing gain included. It is SNR
in the measured impulse response which benefits from
the noise suppressing features of the technique. It is the
term which determines the reliability of the results.
A novelty in Swept-Sine based measurements is that
“?” symbol can be displayed with level results. However,
note that it does not have the same meaning as with reverberation results. Level report contains several displays.
Individual level values or level difference between channel 1 and 2 might be displayed.
If an individual level value is marked with “?” this
means that the real value is less or equal to the measured
value. In other words the real value might be lower, but
we are not able to measure it because the noise hinder
us. Example of individual level value marked with “?” is
shown in figure 14.
If a level difference value is marked with “?” you need
to take a look at reliabilities of individual values of L1 and
L2 in order to draw a conclusion.
What does the “?” displayed with
level values mean?
User familiar with measurements of reverberation time in
classical measurement might note that reverberation time
results can be marked with “?” which means that results
are unreliable. This can be because reverberation time
is too short or background noise level is too high. Please
refer to main user manual for details on this. However, no
such indication of reliability was used with level results in
classical measurement.
Figure 14. Question mark with individual level value means
less or equal
page 27
Nor121
If only L2 is marked with “?” that means that real difference is greater or equal to the measured value. In other
words the real value might be higher, but we are not able
to measure it again because of noise. Example of level
difference value marked with “?” is presented in figure
15.
If only L1 is marked with “?” that means that the real
difference is smaller or equal to measured value.
If both L1 and L2 are marked with “?” we can not draw
any other conclusion but that the result is simply unreliable.
All other features, including rating and calculation of
different parameters are the same as for the classical
measurement, as well as the use of LAST and AVERAGE
data registers to perform spatial averaging. Results can
be saved and transferred to a PC using NorXfer software.
Reports can be generated using the NorBuild software
package.
Figure 15. Question mark with level difference value
page 28
Note that the “?” symbols are displayed only after the
whole measurement is finished i.e. when instrument is in
ENDED state. Level values on the other hand, are already
displayed as they are measured i.e. while the instrument
is in RUNNING state.
In order to provide the information about reliability of
measured results while the measurement is still running
a warning “S/N-ratio requirement is not fulfilled“ is used.
It will be displayed during the measurement as soon as a
level which will be marked by “?“ when the measurement
is finished, is detected.
This can help the user to identify the suspicious results
and eventually stop the measurement.
Instruction manual
Measurement of high sound
insulation values
One of the advantages of the Swept-Sine technique is
the ability to perform measurements of high sound insulation values and measurements in presence of high background noise. In both cases the measurement benefits
from the noise suppressing capability of Swept-Sine algorithm. The noise suppressing capability makes it possible
to measure signals whose level is lower then the level of
background noise i.e. measure signals in negative SNR
environments. However, this benefit necessiate certain
measures to be taken. User should be aware that by suppressing noise not only the useful signal becomes available but also all other signal components which would
usually be “buried” in noise. One such undesired signal
component is the consequence of crosstalk in the instrument itself.
When measuring high insulation values, signal levels
recorded in the receiving room may be considerably lower than the levels in sending room. The following measures might be used to reduce the influence of crosstalk in
such a measurement:
2. Use a low generator output level and amplify the signal in the power amplifier. This will reduce the risk for
crosstalk from the generator output to the signal output.
3. For level difference values higher than 80 dB the use
of microphone front-end Nor336 for microphone in the
receiving room is recommended. This preamplifier
provides the gain up to 40 dB. The calibration should
be performed with both microphone and front-end
connected. The care must be taken that the full scale
deflection should be diminished for the amount of gain
used on the front-end. For example if the fullscale has
value of 90 dB and front-end gain is 30 dB the actual
fullscale value is 90-30=60 dB. Any level higher than
60 dB will produce an overload condition.
1. Turn off HP filters. High-pass filters in Range menu
should be turned off. Note that when HP filters are
turned off, the instrument becomes more sensitive for
overload by low frequencies. If an overload occurs the
measurement should be restarted and not copied to
the average register.
page 29
Nor121
Technical
specifications
Frequency [Hz]
RTmin [s]
RTmax [s]
50
0.20
15
63
0.14
15
80
0.14
15
Bandwidth = 1/3 Octaves:
100
0.10
15
125
0.09
15
160
0.08
15
200
0.07
15
250
0.06
15
315
0.05
15
400
0.04
15
500
0
15
630
0
15
800
0
15
1000
0
15
Sweep duration
Duration per bandwidth
Acquisition duration
Start frequency
Stop frequency
Sweep duration
Duration per bandwidth
Acquisition duration
Start frequency
Stop frequency
:
:
:
:
:
:
:
:
:
:
“Short”, 60.9 s
2.9 s/one-third-octave-band
68.92 s
38.13 Hz
5956.5 Hz
“Medium”, 336 s
16 s/one-third-octave-band
338.92 s
44.44 Hz
5956.5 Hz
Sweep duration
: “Long”, 672 s
Duration per bandwidth
Acquisition duration
Start frequency
Stop frequency
:
:
:
:
32 s/one-third-octave-band
674.92 s
44.59 Hz
5956.5 Hz
One-third-octave bands:
1250
0
15
1600
0
15
2000
0
15
2500
0
15
3150
0
15
4000
0
15
5000
0
15
Length of impulse response : 10.72 s
Octave bands:
Bandwidth = 1/1 Octaves:
Sweep duration
Duration per bandwidth
Acquisition duration
Start frequency
Stop frequency
:
:
:
:
:
14.7 s
2.1s/octave
23.5 s
33.19 Hz
5956.5 Hz
Length of impulse response : 10.72 s
page 30
Frequency [Hz]
RTmin [s]
RTmax [s]
63
0.13
15
125
0
15
250
0
15
500
0
15
1000
0
15
2000
0
15
4000
0
15
Instruction manual
Broadband impulse response
measurements using Swept-Sine
Broadband impulse response measurements are used in
every field of acoustics hence it is a great advantage to
be able to perform them using a sound analyser. Especially, the ability to use two channels and simultaneously
perform two measurements, completely independent of
each other, opens a broad range of applications. Some of
these might be measurements of microphone characteristics, analog equipment testing or even measurements
of head related transfer functions (HRTFs). Measured
impulse response of the room can be used to calculate
room acoustic parameters in accordance with ISO3382.
Implementation
Measurement is always performed using a sampling frequency of 48 kHz. Each measured impulse response is
stored in two files i.e. two copies are made, each with
different resolution. One 16-bit .wav file and one 24-bit
.ndf data files are stored and can be transferred to PC
for further processing. Note that .ndf is a Norsonic data
file used internally in the instrument. The format used for
data storage in an .ndf file is raw data format (without any
header or trailer) with 24 bit mono samples stored as Little-Endian byte order (Intel type - LSB first).
Header and trailer usually contain data about format,
such as sampling rate, bits per samples etc. The fact that
.ndf file contains no header and trailer means that it is users responsibility to specify file’s format while opening a
file if 24 bit data are required.
Making IR Measurements - a cookbook
1. Use the Setup menu to load standard setup “Impulse
Response Measurement, SweptSine” By default both
cahnnels will be enabled. If a one channel measurement is needed the other channel can be turned off
using “Meas Control” menu.
2. Press START button to make a measurement
3. After the measurement is finished (status becomes
“ENDED”), the echogram of measured impulse response will be shown on display (Figure 16). Inspect
the echogram to confirm that the measured results are
correct.
4. Copy the measured impulse responses to Average
registry by pressing “Copy Avrg” soft key. We will not
perform any averaging here but this step is necessary
in order to save the impulse responses to memory.
5. Save the measurement on the PC card or instruments
hard disk using Memory menu
6. Press STOP button to put instrument back to READY
state.
page 31
Nor121
Figure 16. Echogram of an impulse response measured in
Nor121
8. Click on the “connect” icon and chose Nor121 as an
Instrument and Local as a Connection
9. Copy the measurement to My Measurements.
If cable is used, do the following:
7. Connect the parallel cable to the instrument and set
the instrument in “Transfer mode” by choosing the
“NorXfer” button from the MEMORY menu.
8. Click on the “connect” icon in the NorXfer and chose
Nor121 as an Instrument and LPT as a Connection
9. Copy the measurement to My Measurements.
If several measurements are to be made it is important
to press STOP after saving each measurement. This
will put the instrument back in READY state before
the next measurement. Otherwise every measurement
will overwrite the previous one.
Transferring measured IR from
the Instrument to a PC
The measured impulse response can be transferred to a
PC either by moving the PC-card or by a cable connetion
between the instrument and the PC. In either case, use
the NorXfer software for transferring the data.
If PC card is used, do the following:
7. Take the PC card out and put it in the PC running
NorXfer software
page 32
Subdirectory Ch1 will contain file ir1.wav and subdirectory
ch2 will contain file ir2.wav. NorXfer does not show the
24-bit .ndf files although it transfers them to My Measurements. User is advised to access these files from Windows Explorer or some other file management program.
Both ir1.wav and ir1.ndf files will be stored in the Ch1 subdirectory of the corresponding measurement. Files with
impulse response measured on channel 2 (ir2.wav and
ir2.ndf) will be stored in subdirectory Ch2.
Technical specifications
Bandwidth = Broadband covering third-octave bands
centred at 50 Hz to 20 kHz
Sweep duration
: 1.5 s
Acquisition duration
: 2.73 s
Start frequency
: 42.17 Hz
Stop frequency
: 23713.7Hz
Impulse response length : 2.73 s
Sampling frequency
: 48000 Hz
P.O. Box 24
N-3421 Lierskogen
Norway
Tel: +47 3285 8900
Fax: +47 3285 2208
[email protected]
Norsonic AS supplies a complete range of instrumentation for acoustics – from sound calibrators, micro-
www.norsonic.com
Contact your local representative or the factory for information on our complete range of instrumentation.
phones & preamplifers; via small handheld sound level meters to advanced, yet portable, real time analysers,
but also building acoustics analysers and complete community, industry and airport noise monitoring systems.