1
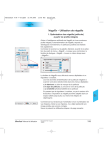
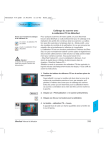
b. Optimising the Magenta Channel in the Histogram Click on the magenta button. As above, we now define the magenta channel. By moving the triangle we also realise the value of “5” for the magenta display in the densitometer. c. Optimising the Yellow Channel in the Histogram Click on the yellow button. Here, too, we move the triangle until the densitometer shows a value of “5”. We now can see that within the image a beautiful, neutral white has developed, as shown on page before. 140 5.3 • Histogram SilverFast® Manual