1
- Short range wireless devices, Zgbee, Wireless-USB, Wireless keyboard/mouse, etc.,
- Personal living environment EMF safety evaluation
9112t2008
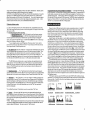
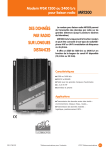
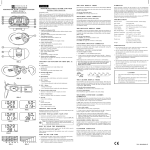
CORNET ED15SA Electrosmog meter with build-in Spectrum Analyzer for 2.4GHz band is a pocket
size, affordable tool for quick measurement of High frequency @F) Radio wave field strength (160MHz -
]!Hz),powerdensity, andfrequencyspectrumof2.4GHzbandwirelessapplications.
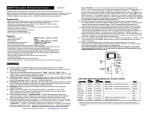
lraxim!n d€tooted si gfl st
F$'ar leYBl i9f entfe
Iti;designedfor
Signal power level scate in
RF radiation safety level measurement ald general wireless applications such as: Mobile phone ridiation
safety level, Base station antenna power level (GSM, WiMAX, ,CDMA), DECT phone, Wini WL,q,N,
Bluetooth, cordless phone, Zigbee, microwave oven leakage, wireless home audi;/video, radio
transceivers and other RF applications signals.
ED15 SA has two operation modes: RF power-meter mode and Spectrum Analyzer mode. It has high
sensitivity, wide dynamic range, and easy to read graphic LCD to display the frequency and signal
strength of the RF signals. It is excellent for individual or company with Electromagnitic wavi safety
conc€ms. It is also an excellent tool for field measurement, installation aid and analysis of WiFi wireiess
I-AN or any other wireless communications applications in the 2.4GHz frequency band.
lGHz
to 2:48GAz band
dBh {0dftmto"1oDdB$)
63ch st6D
iB
'5dBm
si9nal power level
il
rlals oilly
)
{;n HDld
Frsquency scale
ir ro ?.4A4cHz)
(2.400O1
ar Chennel numbe'
ICH#1 ln CH!14)
Hdd key
RF Frw6{ r6vel tu powet
Features:
denslty lev€l tablo
Power-meter mode:
- Frequency
100MHz to 3GHz useful dete€tion range
- High Dlmamic range: 60 dB
- High
-55dBm to OdBm (25mvlm to 14.8V/m)
- Peak power density measurement: 1.Suilm"to 0.58w/m' (auto scale)
- LCD digital power level and power density level display
- Moving Histogram display, and Analog style tsar Segment signal level display
- 8 high brightness LED to display power density level with 3 safety range indications
- Continues wave (AM/FM) and high speed burst RF (GSM, TDMA, pCS, CDMA, Wi-Fi, WiMAX)
- Super fast response time with easy reading color LED segment display
range:
sensitivity:
There are two modes of operations of ED 15sA: power-m€ler mode and spectrum Analyzer
mode. Push the first button below the power switch will change the EDl5SA operation modes in
Power-meter-mode, (2) PeakHold-spectrum-mode, and (3) Normal-spectrum-mod; in sequence.
1)
(l)
Powermetermode:
Speclrum Analfzer mode:
range:
- Frequency
Standard 2.4GHzfrequency butd (2.4GHz - 2.4B5GHz)
- Wide Dynmic range: 90 dB
- High
-106dBmto -12dBm
- Frequency resolution: up to 333 KHz and I MHz
- Amplitude resolution: 0.5dBm
{nat9g nf'@V,ml) and Digiral RF (WiFi, Bluetooth, DECT, Spread spectnrm)
Graphics LCD frequency spectrum and signal level display
- Operation
Spectrum, PeakHold, Hold, cursor-frequenccy/level dispiay
sensitivity:
Signls:
Display:
mode:
General:
- LCD back
10 seconds auto-off, with manual on/off control
Small, compact handheld design, 65mmx130mmx25mm
- B attery operated: 9V DC (alkaline battery recommended) *not included in the package
Size:
light:
Applications:
- High frequency (RI) Elecnomagnetic wave field strength measurement
- Mobile phone and Base station antenna radiation power density measurement
- Wireless communication applications (AM/FM, TDMA, GSM, DECT, CDMA, WiFi,
- 2.4GHz band Wireless network frequency spectrum and signal level measurement
- Bluetooth device, and RF wireless remote control device detection, testing and setup
- Spy camera, wireless bug finder
- WiFi wireless LAN setup, installation, detection, exploration, and optimization
- Wireless security system maintenance
- Radio transceivers power output level measurement
- Cordless phone, DECT phone radiation safety level measurement
- Microwave oven leakage detection
- Wireless Home audio/video devices, video sender, baby monitor
(1) Put the 9V battery in the ED15SA, Handle the EDl5SA with right hand in vertical direcrion, and
_
push the power switch button. The EDI5SA will come up with Field strength Power-meter mode first.
(2) The RF sensor is located in the left hand side of the ED 1 5SA; Please do not cover the RF sensor area
with hand or other objects.
(3) Measured RF field strength,/power density is shown on the digital LCD display (with dBm and auto
mw/m2,uw,/m' scale)
(4) 8 LED lights. With Red, Yellow, and Green color on the right hand side of LCD window is used for
quick RF signal level Indications. 3 Red I-EDs are used to indicate the 3 safety range. The power level
ofeachLEDcanbefoundinthetableontheEDl5SAfrontpanel. Thesafetylivelitandardofseveral
countries can be found in the end ofthis manual as a reference.
(5) Histogram of previous 32 signat level readings ue rcorded and shown as vertical moving bar graph
on the right of LCD display
(6) Analog style Bar segment display can be used for relative signal strength indication.
Toggle the 2'd push button on/off while in power meter moJe can
the reading of the l-CD
display.
(8) Most high frequency RF antenna such as Mobile phone base station is vertical polarized (in vertical
direction); therefore the ED15SA is normally used in vertical direction. Please rotaie the EDI5SA to find
(7)
'ff6m"
themaximumpowerreadingdirectiontotakecareofhighfrequencyRFwavereflections.
WiMAX)
TheEDl5SA
can also be used to find the signal source location by pointing the ED1SSA RF sensor area toward the
signal source and looking at the moving Histogram.
(9) Most of modem communication devices (\4obile phone, wireless I-A.N, wi-Fi, etc.,) use digital
communication technology with burst RF signals (Digital RF). When measuring this type of RF signals,
several LED lights will blink at the same time; this is normal and can be used as an indication of Digital
RF signals. The rapid on/off of RF signals used by Digital RF can be seen in the moving Histogram too.
For Analog RF, continues waves (AM/FM) signals, the LED light will be stable. EDl5SA measures the
peak power density of signal with very quick response time. It is more accurate than the needle style of
readout which is slow response and only shown the average value of signal power most of the time. The
Mobile phone (GSM) handset will contact the Base station every severil minutes with very short burst of
signals.ItcanbeseenintheEDl5SAHistogramandpowerlevllindications.
@2007 CORNET Misosystems lnc., 14OO Coleman Ave #C28 Santa Clara, CA 95050 USA Tet: (408)9690205
RFradiowavesignallevel
w.cornetmicro.com
changes with the environment, temperature, weather, nearby objects, and Reflections. Therefore, relative
comparison using Histogram to find the Maximum level area is suggested.
(10) EDl5SA is a broadband High frequency (RF) type of Electrical field measuring device. It is used for
applications such as Mobile phone base station antenna radiation, Microwave oven, Cellular/cordless
phone, Radio transmitters, and WiFi wireless LAN installation
It is not for low frequency magnetic
held measurement (AC power line, transformer, high voltage power transmission line, motor ...) which
should be measured with Gauss-meters, such as CORNET ED25G RF/LF meter.
aid.
3) LCD backlit auto-off conlrol and Batterv low indication
--- LCD backlit will ON when the
EDlSSA is power-up. It will auto-off after 10 seconds to save the battery power. To tum on/off the LCD
backlit manually, go to power meter mode, get into HOLD state, then toggle the l"tpush button to turn
on/off the backlit manually. If the 9V battery is below the 5V threshoid, the "BAT Low" indication will
ON in the initial LCD screen when the ED15SA is power-up. The EDl5SA continues working until the
battery dies. When the "BAT loil' is on; there will be no LCD backlit. Please replace the battery when
"BAT low" is on, to make swe the ED15SA is working properly.
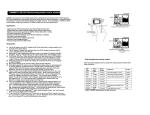
2) Spectrum Analvzer modes:
(1) There are two Spectrum Analyzer modes. Normal Spectrum mode, and PeakHold spectrum mode.
The RF signal strength and Frequency Spectrum is shown on the graphics I-CD display with level in dBm
and frequency in GHz.
(2) Two modes ofspectrumanalvzer operations
(a) Normal Speclrum mode -- the EDl5SA displays the real time frequency spectrum,
(b) PeakHold Spectrum mode the ED1SSA hold and displays the peak value of the
measured signal level for each frequency. PeakHold mode is good for monitoring fast changing RF
-
signals, such as burst RF or Digital RF signals. A PeakHold indicator {P} will be shown on the top right
corner of the LCD display in this mode. See $gf,
+ You can change the operation modes by toggling the "Mode/cursor-button" which is the first
button below the power switch. The "Mode/cursor-button" will cycle through (1) Power meter mode (2)
Normal spectrum mode (3) PeakHold spectrum mode.
(3)
Max. Siqnal Level of
the entire 2.4GHz
band--In Normal mode or PeakHold mode,
the LCD
will
display the Maximum signal level measured for the entire 2.4GHz band in the top of the display. This is
good for applications such as Radiation Safety Level measurements, maximum level detections. The
EDl5SA updates the Max. Signal I-evel (dBm) readout for every scan ofthe entire 2.4GHz
For
Radiation Safety applications, signal power level to power density conversion reference table is in the
band.
lowerlefthandsideoftheEDl5SAfrontenclosure.
SeeRFradiationsafetysectionfordetails.
+ The
ED15SA Spectrum Analyzer mode is a narrow band design. the signal indicated is for the
specific frequency. For wide bmd RF signals such as WiFi wireless LAN, each channel bandwidth is
22MHzwide, you need to integrate all the signal levels in the 22MHz bandwidth to get the total signal
power of it. The ED15SA power-meter mode is a broad band design; it shows the total power level
measured in the bandwidth.
(4)
Mode/Cursor bulton ------ The 1" push button below the Power Switch is used to change the
operation mode of the ED15SA in between RF pow€r-meter mode, Nomal Spectrum mode and PeakHold
Spectrum mode. It is also used to move the Frequency Cursor or Channel-Cursor while in "Hold" state.
(5)
Hold button ------ The 2'd push button is used to get a snapshot or to "Hold" the scanning of the
frequency spectrum. Once in the "Hold" state the spectrum scan will freeze and the LCD will display the
signal level and frequency in the Frequency-Cursor location. Push the Hold button again; it will display
the Average signal levels. Push the Hold button again; it will show the signal levels of 14 WiFi channels
in Channel-Cursor location. Push the Hold bufton again to get out of the "Hold" state, and start the
spectrum scanning again,
There are two types of RF signals used in today's wireless communication systems, i.e. Analog RF
and Digital RF signals. The traditional AM/FM Analog RF signals are continues wave signals. The
frequency spectrum of this type of signal is stable and easy to caphrre. AM/FM radio, analog cordless
phone, wireless spy camera, remote control, and Radio transceivers are some examples of Analog RF
signals. Tlpical Analog RF spectrum is shown in Fie.2. Both Normal spectrum mode and PeakHold
mode can be used for Analog RF signal.
Digital RF signal is burst tlpe signals, it is used in digital communications such as: Mobile Phone,
GSM, WiMAX, WiFi wireless I-AN, Bluetooth, Zgbee, DECT phone and most of the new wireless Home
audio/video devices. This type of signal is transmitted very fast in short bursts to shre the frequency
bandwidth between several different devices. In order to capture the frequency spectrum of Digital RF
signals, tracking of the RF bursts are necessary. If the spectrum analyzer is out of sync with Digital RF
burst signal or the burst ON time is short, only short spike of spectrum will be shown. The typical Digital
RF signal frequency spectrum in Nomal Spectrum mode is shown in
In order to show the full
spectrum of Digital RF signal, the PeakHold mode can be used. In PeakHold mode, the spectrum analyzer
will overlap the PeakHolded signals captured several times to reassemble the whole frequency spectrum
of the signal. See Fie.4 for the spectrum in PeakHold mode for the same signal. It might need several
seconds or minutes of capture time in PeakHold mode to show the whole frequency spectrum of the WiFi
WLAN, or Bluetooth signals. Fie.5 shows the Bluetooth frequency Hoping system frequency spectrum.
shows the spectrum for Microwave oven when it is ON, which has very wide frequency spread.
The 2.4GHz band WiFi wireless LAN has frequency coverage from 2.400GH2 to 2.485GH2. The
WiFi frequency band is divided into 14 channels. Each channel is 22MHz wide. There are also overlaps
in between adjacent channels. See below_for the frequency used by each WiFi channel. When ED15SA
is in the "Hold" state and in the Channel display mode, the signal level displayed is the Maximum value
within each channel. Since there re overlaps between adjacent channels, the maximum value may spread
around seveml adjacent chmnels. *Note: (Channel#l, Channel#6, and Channel#l 1 are not overlapped
with each other, and are used in tlpical WiE Access points, there are two notches in the ED1SSA LCD
display frequency axial to mark these three channels). Next to the Maximum value of each channel,
Average signal level of each channel is displayed. This can be used to see the distribution of signals in the
WiFi frequency channels.
WiFi frequency spectrum captured by ED15SA can be used for WiFi WLAN installation and usage
optimization. Try to re-assign the frequency channels used by the WiFi Access-Point to avoid the conflicts
between each other. Data traffic information for each frequency and channel can be estimated by the
frequency/channel spectrum too.
[!g.].
[!g{
*Use the Mode/Cursor button (ln push button) to move the cursors while in "Hold" state.
(6)
Cursors ---- The cursor in the "Hold" state can be used to measure the Signal level for the
specific frequency or channel in the Frequency-Cursor or Channel-Cursor location. Use the "Mode/cursor
button" (1't push button) to move the Cursor. Pushing and hold the "Mode/cursor button" a little bit longer
time will move the cursor quicker along the horizontal axial. The Cursor will wrap around when it reaches
the end of the screen.
* NOTE: the level displayed in the Channel-Cursor is the peak value within each channel. The Average
value within the 22MHz channel bandrvidth of each Channel is shown next to the Peak value. There are
overlaps in adjacent WiFi channels. The cursor is used in the "Hold" state only.
Fiq.2 Anrloq RF
Fic6 Micrcmve oven
Fis.5 Bluet@th
tr1s.6 HoLd-
chanel-@Eor
The European Comunity provided gerteral guidelines in its Council Reconunendation of
July 1999.t ICNIRP published similar guidelines in April 199E.'zTabl€ I giv€s a sampling
of the international and national lield-strength limit values for the general public and
continuous exposure
950Mhz
lntemational
EDl5SA
can be used to monitor the RF radiation level for safety purpose. Mmy 2.4GHz band
applications have high RF transmit power. For WiFi WLAN the maximum trmsmitter power output is
100mw which is 20dBm. For several WiFi device operated at the same time in the same lmation area it is
possible that the RF radiation level will exceed the maximum safety level standrd. The WiFi AccessPoint lmation is importmt since it is busy most of the time and transmits a lot of RF power. Try to move
the Access-Point to the location that is far from where the people stay most of the time. The 2.4 GHz
DECT cordless phone base mit is also could be a problem. DECT phone base unit will poll all the satellite
units (hand set) all the tim€ to make sure it can communicate to each other. It will transmit RF signal all
the time. Therefore Do Not places the DECT cordless phone base unit on the night stild next to your
bed! EDI5SA can be used to measure the RF radiation level for each frequency radiated from the device
in the 2.4GHz band. Or broadbmd in 100MHz to 3GHz mnge. Microwave oven leakage can be
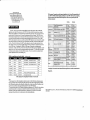
monitoredtoo. Table.lshowstheconversiontableforpowerlevel(dBm)measuredbyEDISSAtopower
density level (w/m2) which is used for maximum radiation safety standard. The Three RED color area is
the National safety standrd used by three different country. Try not to exceed these radiation levels if
possible. @elocate the device, use shielding, etc.,)
Field streneth,/Dower densitv table:
RED3
5
dBm up
Safetyreg€#3 Italystand{d (o.lvm-sq)
O.l8 w,tn2
RED2
-10 dBm
0.058
w/m'
Safety
rmg€#2
Swiss
REDI
-15 dBm
0.01E w/m2
Safety
rege#l
Russian
YELLOW3
-20 dBm
O.fi)58
YELLOW2
-25 dBm
1.8
YELLOWI
-30 dBm
O.5E
mdm2
GREEN3
-35
dBn
0. I 8
mdmz
WLeless I-AN, WiFi typically in this rangc
GREEN2
-40 dBm
0.06
mdm'
So@ sigdl source
doM
stsded (0.04ilm-sq)
smdnd (0.02vcsq)
dm2
I
Crution
I
t999t5t9rE0 :'].;:ii
kltemational
IO,MRP Guidelines;,:April 1 998
Austria
oNoRM
S1120
42vt^
59:Y/m,, :,''
.
(4:7Jwm?)
(4.xw;5
42Ylm
59-V/m ".'
,
14,75w/m?)
49 Vlm
f6 1qw/m2\
21,:V1,m
::
Belgium----
Belgisphr Staatsblad F,2001;;1365
{t:lswi#)
Gliinsny
26. Dcutsche Veiol{nung
*r4
Italy
Decreto n; 381; 1998
Ihe
14r?sw/m?l
o, Ylm'
(0;lw/#)
Nbtherlands
Y/m
iA,3tW7di
(g
l
25Wm')
6 iV,/m
20 V/m
riw#r
zl V/m:
6.til/lm
V.eidrdnwg 1999
United States
IEEE C95JT
rr
China
Draft: Natimal Quality Technology
*v v/m
'
io,naw-h
49 Vr/rn
iaw;,t
(631Wtm',).
Radio-Radiation:P,rotectibn
49 Vftn
Guidelines,1990:,
ioraiw*?1
:
30 v1m
E3iV/m
(f 8w/rn?)
Switrerlmd
Japan
^
(10W1m1
(6.92w/m?)
51
Monilorins Bureau
61 V/m
(O;lwlm'l
20Ylm
HalthComcil
(9'25W'm'z)
5gVfin
,vlgt
(1w/m?l
Caulion!
Caution
Courtcil RCco;q1,4.e4*ation
l850Mhz
(0,1Wm2)
68 VTrn
nt.w/ft2l
9l v/m
liOW;m?t
6lvlm
(Iowlml)
safe
milmz
arcud
safe
A sampling of international and national field-strength limits for mobile comunications
safe
frequencies.
sfe
safe
power
Note:
* Electromagnetic wave field strength/power density decades very fast with distance (distance squre),
keep a gmd distmce from the high frequency RF signal source can reduce the high frequency radiation
effect. Relocate the radiation source ifpossible, Alumina foil or window sun reflector film (silver color)
cm be used as an effective and cheap shielding material for most of RF radiations.
* The power density table is for RF radiation evaluation and reference only. Official RF safety radiation
measurement procedure is complicate and should be handled by trained technical person with lab
instruments. Safety range standard are listed here as a reference only. ED15SA is not a medical
instrument, Please do not use it in medical, legal or other related applications.
p2007 CORNET Miqosystero lnc., 1400 Coleman Ave #C28 Santa Clara, CA 95050 USA Tel: (408)9690205 M.@rn6tmicro.@m
v-o911a200a