1
How to use the Charts
In MetaTrader4 you can see as many real time charts as you wish, all on one screen, for any currency
pair, CFD, and for any time period. The following types of charts are available in MetaTrader4:
Line Chart
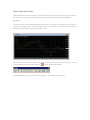
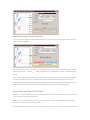
The chart's x-axis is for the different time periods (minutes, hours, days, months etc.), and the y-axis is
for the price. The point on the chart shows the close price for the period, i.e. the bid of the last quote for
this period. All the sequential points are joined by lines:
It is recommended that this chart type is used only for the short time periods (up to 5 minutes). In order
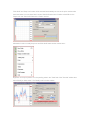
to change the chart to a line chart, press the
button on the Charts toolbar.
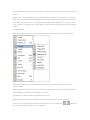
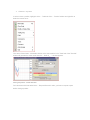
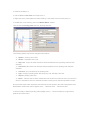
Or press the Alt+3 key combination or use the Charts -> Line Chart menu sequence.