1
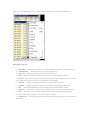
By left clicking the mouse you can drag and drop any selected currency pair or CFD into any open chart
window.
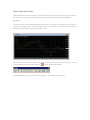
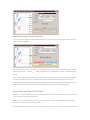
Chart period – the period displayed in one bar or candle. For example, if you create a 15 minute bar
chart, then each bar will have the price data for the relevant 15 minutes. In MetaTrader4 the following
time periods can be used: 1, 5, 15, 30 minutes (M1, M5, M15, M30 respectively), 1 hour (H1), 4 hours
(H4), 1 day (D1), 1 week (W1) and 1 month (MN). In order to change a time period, use the "Periodicity"
toolbar.
Periodicity toolbar
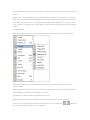
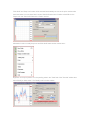
Right click anywhere on the chart to produce the context menu to get access to the chart settings:
Choose Periodicity and select a time period from the drop down menu or press the button on the
"Charts" toolbar;
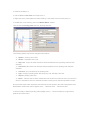
Select Refresh item if an error occurs or if there are so called "gaps" on the chart. All missing data will
be uploaded from the server and will appear on the chart;
Select Grid if you wish to hide/unhide gridlines on the chart;
Select Volumes in order to show/hide tick volume (the number of quotes of any period time);
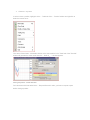
Zoom in / Zoom out will help you to modify chart measures. You can also use the
the "Charts" toolbar or press the "+" and "-" buttons;
buttons on