1
Sediment trap
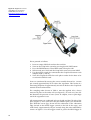
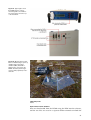
A sediment trap is set up at the main station in August 2007. The trap is
emptied during the first and last visit every year. Check that lines and
anchoring is OK.
StowAway Tidbit Temp Loggers are replaced every August (new Tidbits
should log data every 1 hour)
Vegetation
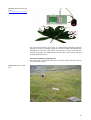
In August submerged vegetation is monitored. The method to be used
for the macrophyte studies is a transect investigation to obtain a relatively good overall description of submerged macrophyte distribution,
density and diversity.
In each lake approx 15 transects and approx 150 observation points are
included. If great spatial variability in plant cover occurs, more transects
may be needed in order to provide an adequate description.
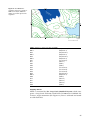
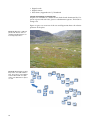
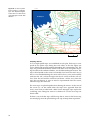
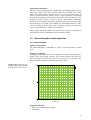
The transects must run in a straight line from one shore to the other (i.e.
including emergent and floating-leaved macrophytes). The transects
should be placed parallel at equidistant intervals to cover the whole lake
area, i.e. different degrees of exposure, sediment type, slope etc. should
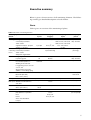
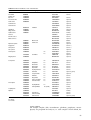
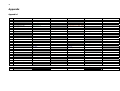
be represented. Observation points are placed with equidistant distances
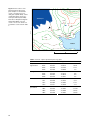
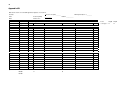
on the transects (Table 1).
The first and the last observation point should be close to the shore. It is
important to ensure that the total open water area is covered. Reference
points and terminal observation points should be determined with GPS.
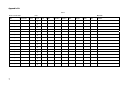
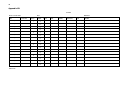
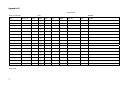
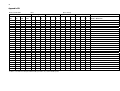
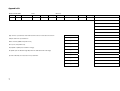
At each observation point, water depth, total macrophyte coverage (%)
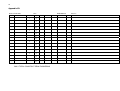
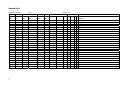
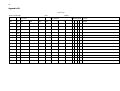
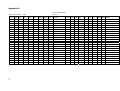
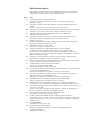
and the species/taxa are recorded (Appendix 6B). To describe the abundance of submerged macrophytes, only the total cover of all submerged
plants is measured as percentage. Macrophytes occurring in scattered or
open beds of reeds are also recorded. All observations are recorded in
the field as in Appendix 6B. A table should be filled in for each transect.
In practice, the investigation is undertaken by two persons; one conducts
all observations (degree of total coverage, dominating species, macrophyte height and water depth). The other person follows the transect, enters all observations in a standard data sheet (Appendix 6B) and saves
the co-ordinates of all observation points into a GPS unit. Observations
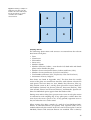
are made using a water glass, estimating coverage in a 2x2 m area or by
using the plant rake 2-3 catches in each observation point and estimating
the coverage using a 0-5 scale, where 0 = 0%; 1 = >0 -5%; 2 = >5 - 25%; 3 =
>25 – 50%; 4 = >50 – 75% and 5 = >75 – 100%.
Example of basic analyses of data from the transect investigation
The following observations were obtained in a transect investigation of a
75 ha lake: 25*0%, 32*3%, 40*15%, 19*38%, 15*63%, 11*88% and 8*98%,
i.e. a total of 150 observations.
The relative plant-covered area (RPA) is calculated as follows:
(25*0% + 32*3% + 40*15% + 19*38% +15*63% +11*88% + 8*98%) / 150 =
27%.
49