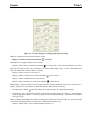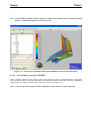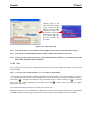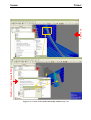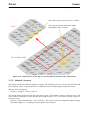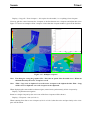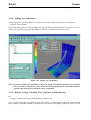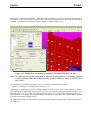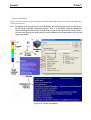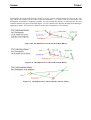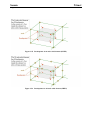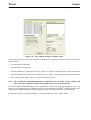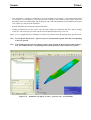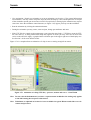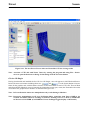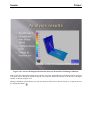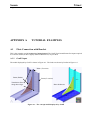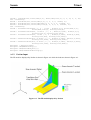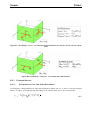
1
SESAM USER MANUAL Xtract Postprocessor for Presentation, Animation and Reporting of Results Developed by DET NORSKE VERITAS Sesam User Manual Xtract Postprocessor for Presentation, Animation and Reporting of Results February 1st, 2011 Valid from program version 3.0 Developed by Marketed by DET NORSKE VERITAS DNV Software Report No.: 00-7004 / Revision 12, February 1st, 2011 Copyright © 2011 Det Norske Veritas All rights reserved. No part of this book may be reproduced, in any form or by any means, without permission in writing from the publisher. Published by: Det Norske Veritas Veritasveien 1 N-1322 Høvik Norway Telephone: Facsimile: E-mail, sales: E-mail, support: Website: +47 67 57 99 00 +47 67 57 72 72 [email protected] [email protected] www.dnvsoftware.com If any person suffers loss or damage which is proved to have been caused by any negligent act or omission of Det Norske Veritas, then Det Norske Veritas shall pay compensation to such person for his proved direct loss or damage. However, the compensation shall not exceed an amount equal to ten times the fee charged for the service in question, provided that the maximum compensation shall never exceed USD 2 millions. In this provision “Det Norske Veritas” shall mean the Foundation Det Norske Veritas as well as all its subsidiaries, directors, officers, employees, agents and any other acting on behalf of Det Norske Veritas. Table of Contents 1 INTRODUCTION ............................................................................................................1-1 1.1 Xtract – General Purpose Postprocessor.......................................................................................... 1-1 1.1.1 Structural Analysis Results ............................................................................................... 1-1 1.1.2 Hydrodynamic Analysis Results ....................................................................................... 1-1 1.2 Xtract in the Sesam System ............................................................................................................. 1-1 1.3 How to read the Manual................................................................................................................... 1-3 1.4 Status List ........................................................................................................................................ 1-3 1.5 Program Extensions ......................................................................................................................... 1-4 2 FEATURES OF XTRACT...............................................................................................2-1 2.1 Models and Results for Presentation (Input to Xtract) .................................................................... 2-2 2.2 Result Positions, Attributes and Components.................................................................................. 2-4 2.3 Run Numbers, Result Cases and Occurrences................................................................................. 2-5 2.4 Combining and Scanning Results .................................................................................................... 2-5 2.5 Dynamic Frequency Domain Results – Complex Results............................................................... 2-6 2.6 Superelements.................................................................................................................................. 2-6 2.7 Sets................................................................................................................................................... 2-6 2.8 Graphs.............................................................................................................................................. 2-7 2.9 Animation ........................................................................................................................................ 2-7 2.10 Plotting and Printing (Tabulating) ................................................................................................... 2-7 2.11 Viewing a 3D Model with Results in Xtract Viewer....................................................................... 2-8 2.12 Viewing Two 3D Models (Global Model plus Sub-Model) in Xtract Viewer................................ 2-8 2.13 Automatic Report Generation – the Xtract Report Builder ............................................................. 2-8 2.14 Logging and Reading Commands.................................................................................................... 2-9 2.15 Transfer of Data through the Sesam Interface File System ............................................................. 2-9 2.16 Transfer of Data to Xtract through a VTF-File.............................................................................. 2-10 3 USER’S GUIDE TO XTRACT ....................................................................................... 3-1 3.1 Getting Started ................................................................................................................................. 3-1 3.1.1 Starting Xtract and Opening the Results Interface File..................................................... 3-1 3.1.2 The Graphical User Interface of Xtract ............................................................................. 3-3 3.1.3 Basic Display and Model Manipulation ............................................................................ 3-3 3.1.4 Viewing Results................................................................................................................. 3-6 3.1.5 View Nodes/DISPLACEMENT........................................................................................ 3-6 3.1.6 View Nodes/G-STRESS.................................................................................................... 3-7 3.1.7 View Elements/G-STRESS ............................................................................................... 3-7 3.1.8 View Elements/P-STRESS................................................................................................ 3-9 3.1.9 View Elements/G-FORCE .............................................................................................. 3-11 3.1.10 View Elements/B-STRESS ............................................................................................. 3-12 3.1.11 View Element average/G-STRESS ................................................................................. 3-13 3.1.12 View all Components of an Attribute.............................................................................. 3-14 3.1.13 View Resultpoints/G-FORCE ......................................................................................... 3-16 3.1.14 View Nodes/REACTION-FORCE.................................................................................. 3-18 3.1.15 Creating a Graph.............................................................................................................. 3-18 3.1.16 Selecting Result Case ...................................................................................................... 3-23 3.1.17 Combining Result Cases.................................................................................................. 3-23 3.1.18 Scanning Result Cases..................................................................................................... 3-25 3.1.19 Transforming Stresses ..................................................................................................... 3-29 3.1.20 Setting Contours .............................................................................................................. 3-31 3.1.21 Unit Conversion............................................................................................................... 3-32 3.1.22 Sets .................................................................................................................................. 3-33 3.1.23 Multiple Viewports.......................................................................................................... 3-38 3.1.24 Adding Text and Pointers................................................................................................ 3-40 3.1.25 Display Settings, Labelling, Part Attributes and Information ......................................... 3-40 3.1.26 Making Plots/Hard Copies and Adding Graphics to Reports.......................................... 3-46 3.2 Structural Analysis Results ............................................................................................................ 3-48 3.2.1 Result Positions ............................................................................................................... 3-48 3.2.2 Upper and Lower Surfaces .............................................................................................. 3-58 3.3 Hierarchical Organization of Results............................................................................................. 3-58 3.3.1 Run Number .................................................................................................................... 3-58 3.3.2 Result Cases and Occurrences......................................................................................... 3-59 3.4 Postprocessing Complex (Frequency Domain) Results................................................................. 3-59 3.4.1 Evaluating a Single Complex Resultcase ........................................................................ 3-60 3.4.2 Combining a Complex Resultcase with Static Resultcases............................................. 3-61 3.4.3 Scanning Complex Resultcases....................................................................................... 3-64 3.4.4 Scaling a Complex Resultcase......................................................................................... 3-66 3.4.5 Graphing Complex Resultcases....................................................................................... 3-67 3.5 View Sections ................................................................................................................................ 3-67 3.6 List Model and Results Data.......................................................................................................... 3-67 3.7 Animation ...................................................................................................................................... 3-70 3.7.1 3.7.2 3.7.3 Animating Mode Shapes (and Static Results)................................................................. 3-72 Animating Frequency Domain Results ........................................................................... 3-73 Animating Time Domain Results.................................................................................... 3-73 3.8 Hydrodynamic Analysis Results from Wadam or Wasim............................................................. 3-74 3.8.1 Hydrodynamic Loads, Motion and Stresses – Wadam/Wasim and Sestra Results (R+G)3-74 3.8.2 Hydrodynamic Loads and Motion – Wadam/Wasim Results only (T+L+G) ................. 3-76 3.8.3 Hydrodynamic Loads – Wadam/Wasim Results only (T+L).......................................... 3-78 3.9 Hydrodynamic Loads and Motion – Wasim Time Domain Results.............................................. 3-80 3.10 Animating Jacket Launching – Installjac Time Domain Results .................................................. 3-82 3.11 Riser and Mooring Analysis – Riflex Time Domain Results ........................................................ 3-83 3.12 Stochastic Fatigue – Stofat Results................................................................................................ 3-85 3.13 Exporting Data for Further Processing and Reporting .................................................................. 3-86 3.13.1 Exporting 3D Model with Results to VTFx-File for Viewing in Free Programs............ 3-86 3.13.2 Combined export of Two 3D Models to VTFx-File – Sub-Model plus Global Model .. 3-90 3.13.3 Automatic Report Generation by the Xtract Report Builder........................................... 3-92 3.14 Notes on Graphing, Combining and Scanning .............................................................................. 3-96 3.14.1 Graphing.......................................................................................................................... 3-96 3.14.2 Combining and Scanning ................................................................................................ 3-96 3.15 Special Features ............................................................................................................................. 3-96 3.15.1 Save Time for large Models by not Reading Beam Sections.......................................... 3-96 3.15.2 Square Root of Sum-of-Squares Combination for Elements/G-STRESS....................... 3-97 3.15.3 Ship Overall Vibration Level .......................................................................................... 3-97 3.16 Working with Line-Mode Commands and Command Input Files ................................................ 3-99 3.16.1 Reading a Command Input File from inside Xtract ...................................................... 3-100 3.16.2 Notes on Result Case Identification .............................................................................. 3-101 4 EXECUTION OF XTRACT............................................................................................4-1 4.1 Program Environment...................................................................................................................... 4-1 4.1.1 Files used by Xtract........................................................................................................... 4-1 4.1.2 Command Line Arguments ............................................................................................... 4-2 4.1.3 Registry Settings................................................................................................................ 4-2 4.2 Program Requirements .................................................................................................................... 4-3 4.2.1 Execution Time ................................................................................................................. 4-3 4.2.2 Storage Space .................................................................................................................... 4-3 4.3 Program Limitations ........................................................................................................................ 4-4 5 COMMAND DESCRIPTION .........................................................................................5-1 5.1 File Commands ................................................................................................................................ 5-5 5.1.1 Open .................................................................................................................................. 5-5 5.1.2 5.1.3 5.1.4 5.1.5 5.1.6 5.1.7 5.1.8 5.1.9 5.1.10 5.1.11 Source ................................................................................................................................ 5-5 Plot..................................................................................................................................... 5-6 Plotall................................................................................................................................. 5-6 Print ................................................................................................................................... 5-7 Exportvtfx.......................................................................................................................... 5-8 Exportcombined ................................................................................................................ 5-8 Rep..................................................................................................................................... 5-8 Log..................................................................................................................................... 5-9 Exit .................................................................................................................................... 5-9 Resetsettings ...................................................................................................................... 5-9 5.2 Display Commands........................................................................................................................ 5-10 5.2.1 Display............................................................................................................................. 5-10 5.2.2 Displaysettings ................................................................................................................ 5-11 5.2.3 Displayinfo ...................................................................................................................... 5-12 5.2.4 Label ................................................................................................................................ 5-13 5.2.5 Eye................................................................................................................................... 5-13 5.3 Model Commands.......................................................................................................................... 5-15 5.3.1 Model............................................................................................................................... 5-15 5.3.2 Section ............................................................................................................................. 5-16 5.4 Set Command................................................................................................................................. 5-17 5.4.1 Set .................................................................................................................................... 5-17 5.5 Result Commands .......................................................................................................................... 5-20 5.5.1 Result............................................................................................................................... 5-20 5.5.2 Contour ............................................................................................................................ 5-22 5.5.3 Vector .............................................................................................................................. 5-22 5.5.4 Shell................................................................................................................................. 5-23 5.5.5 Evaluation........................................................................................................................ 5-23 5.5.6 Combine .......................................................................................................................... 5-23 5.5.7 Combine add.................................................................................................................... 5-24 5.5.8 Combine all ..................................................................................................................... 5-25 5.5.9 Combine sqrt ................................................................................................................... 5-26 5.5.10 Scan ................................................................................................................................. 5-26 5.5.11 Scale ................................................................................................................................ 5-27 5.5.12 Createuservector .............................................................................................................. 5-27 5.5.13 Overallvelocity ................................................................................................................ 5-28 5.6 Graph Commands .......................................................................................................................... 5-28 5.6.1 Graph ............................................................................................................................... 5-28 5.7 Animation Commands ................................................................................................................... 5-29 5.7.1 Animation ........................................................................................................................ 5-29 APPENDIX A TUTORIAL EXAMPLES............................................................................ A-1 A1 Plate Connection with Bracket........................................................................................................ A-1 A 1.1 GeniE Input ...................................................................................................................... A-1 A.7.2 A 1.2 A 1.3 // GeniE input for creating a model of a plate connection with bracket........................... A-2 Prefem Input ..................................................................................................................... A-5 Patran-Pre Input................................................................................................................ A-8 APPENDIX B STRESSES AND OTHER RESULTS ........................................................ B-1 B1 Element Local Coordinate Systems.................................................................................................B-1 B 1.1 Membrane and Shell Elements..........................................................................................B-1 B 1.2 Solid Elements...................................................................................................................B-2 B2 Result Attributes and Components ..................................................................................................B-2 B 2.1 Result Attribute: DISPLACEMENT.................................................................................B-2 B 2.2 Result Attribute: VELOCITY ...........................................................................................B-2 B 2.3 Result Attribute: ACCELERATION.................................................................................B-2 B 2.4 Result Attribute: REACTION-FORCE.............................................................................B-3 B 2.5 Result Attribute: G-STRESS.............................................................................................B-3 B 2.6 Result Attribute: P-STRESS .............................................................................................B-3 B 2.7 Result Attribute: PM-STRESS..........................................................................................B-4 B 2.8 Result Attribute: D-STRESS.............................................................................................B-4 B 2.9 Result Attribute: R-STRESS .............................................................................................B-4 B 2.10 Result Attribute: G-FORCE ..............................................................................................B-5 B 2.11 Result Attribute: B-STRESS .............................................................................................B-5 B3 Derived Stresses for Membrane, Shell and Solid Elements ............................................................B-6 B 3.1 Decomposed Stresses ........................................................................................................B-6 B 3.2 Stress Resultants................................................................................................................B-8 B 3.3 Principal Stresses...............................................................................................................B-9 B 3.3.1 Principal Stresses for Thin Shell (2D Problem)................................................B-9 B 3.3.2 Principal Stresses for Thick Shell...................................................................B-10 B 3.3.3 Principal Stresses for Solids (3D Problem) ....................................................B-10 B 3.4 von Mises Stress..............................................................................................................B-11 B 3.5 Sequence of Computation of Stresses .............................................................................B-12 B4 Beam Stresses Derived from Beam Forces and Moments.............................................................B-13 B5 Maximum and Minimum Stress Involving Complex Result Cases...............................................B-15 B 5.1 Basic Concepts and Properties of Complex Results .......................................................B-15 B 5.1.1 Extracting Physical Response from Complex Results....................................B-15 B 5.1.2 Stress Variation through a Cycle (360 Degrees) ............................................B-16 B 5.2 Manipulations of Complex Results .................................................................................B-17 B 5.2.1 Presenting a Single Complex Result Case......................................................B-17 B 5.2.2 Scaling of a Complex Result Case..................................................................B-17 B 5.2.3 Adding Complex Result Cases of Equal Frequencies ....................................B-17 B 5.2.4 Combining Several Static and Several Complex Result Cases ......................B-18 B 5.2.5 Combining Several Static Result Cases with a Single Complex Result Case B-18 B 5.2.6 Scanning Complex Result Cases ....................................................................B-19 Sesam Program version 3.0 Xtract 1-FEB-2011 1 INTRODUCTION 1.1 Xtract – General Purpose Postprocessor 1-1 Xtract is the model and results visualisation program of Sesam. Xtract is owned and developed by Ceetron AS and marketed by DNV Software. It offers general-purpose features for selecting, further processing, displaying, tabulating and animating results from static and dynamic structural analysis as well as results from various types of hydrodynamic analysis. Its intuitive and high-performance 3D graphics enables easy and efficient interactive rotation, zooming and panning of the model while viewing and animating the results. The graphical user interface operations may optionally be logged as command equivalents. This log may be edited and used as input to a new session for automated extraction and presentation of results. 1.1.1 Structural Analysis Results Xtract presents results for truss, beam, membrane, plate, shell and solid models in alternative ways: deformed model, contour (iso-) curves, numeric data on model display, X-Y graphs and tabulated data. Based on stresses computed by the analysis program Xtract computes and presents derived stresses: stresses decomposed into membrane and bending parts, principal stresses and von Mises stress. The graphic results presentation may be printed directly or saved to various graphic file formats (Windows bitmap, GIF, etc.). A 3D model with results may even be exported and opened in a free program for interactive interrogation. Tabulated data may be exported to file for importing into spreadsheets for customised results manipulation. 1.1.2 Hydrodynamic Analysis Results In addition to its general presentation features the animation feature of Xtract is especially useful for presenting results from hydrodynamic analyses. The motion of a vessel in waves may for example be animated with the resulting stresses in the hull. 1.2 Xtract in the Sesam System Sesam is comprised of preprocessors, environmental analysis programs, structural analysis programs and postprocessors. An overview of Sesam is shown in Figure 1.1. Xtract is found in the postprocessor group. Xtract 1-2 Sesam 1-FEB-2011 1.1 Figure 1.1 Sesam overview Program version 3.0 Sesam Program version 3.0 1.3 Xtract 1-FEB-2011 1-3 How to read the Manual • Read Chapter 2 FEATURES OF XTRACT to learn about the postprocessing features of Xtract. • Read Section 3.1 Getting Started to learn the basics of using Xtract. Even though the section mostly refers to postprocessing structural analysis results the basics of other postprocessing tasks are the same. • Read Section 3.2 Structural Analysis Results and Section 3.3 Hierarchical Organization of Results to learn about the organisation of structural analysis (FE) results data in Xtract. • If you want to concentrate on presenting hydrodynamic analysis results in the frequency domain from Wadam or Wasim, possibly in combination with Sestra results, then proceed from Section 3.1 to Section 3.8 Hydrodynamic Analysis Results from Wadam or Wasim. • If you want to concentrate on presenting hydrodynamic analysis results from Wasim then proceed from Section 3.1 to Section 3.9 Hydrodynamic Loads and Motion – Wasim Time Domain Results. • If you want to concentrate on presenting hydrodynamic analysis results from Installjac then proceed from Section 3.1 to Section 3.10 Animating Jacket Launching – Installjac Time Domain Results. • If you want to concentrate on presenting riser and mooring analysis results from Riflex then proceed from Section 3.1 to Section 3.11 Riser and Mooring Analysis – Riflex Time Domain Results. • If you want to concentrate on presenting fatigue analysis results from Stofat then proceed from Section 3.1 to Section 3.12 Stochastic Fatigue – Stofat Results. • If you want to learn about alternative ways of exporting data from Xtract for further processing by additional programs (free software) as well as for results presentation and reporting then read Section 3.13 Exporting Data for Further Processing and Reporting. • Read the remaining sections of Chapter 3 USER’S GUIDE TO XTRACT to learn about more advanced ways of using Xtract. • Read Chapter 4 EXECUTION OF XTRACT for information on files associated with Xtract and about alternative ways of running the program. • Read Chapter 5 COMMAND DESCRIPTION for a full description of all line-mode commands (a command reference). • Refer to Appendix B STRESSES AND OTHER RESULTS for background information enabling you to fully interpret all stress results presented. The methods used for extrapolating and interpolating stresses, computing stress derivatives and more are described. 1.4 Status List There exists for Xtract as for all other Sesam programs a Status List providing additional information. This may be: • Reasons for update (new version) • New features Xtract 1-4 Sesam 1-FEB-2011 Program version 3.0 • Errors found and corrected • Etc. The most updated version of the Status List is found on our website www.dnvsoftware.com. Click Downloads followed by Sesam Status Lists to log into this service. Contact us for log-in information. 1.5 Program Extensions A program extension is a feature or a set of features – normally of advanced or specialised nature – that has been screened off for users of the basic version of the program. Access to a program extension is subject to agreement and a proper configuration (password) file. The basic version of Xtract only includes features for presenting a model (reading file T#.FEM), optionally with hydrodynamic loads computed by Wadam or Wasim (L#.FEM). There are three extensions in Xtract: • STRU – Features for postprocessing structural analysis results, required for reading a Results Interface File • ANIM – Animation, required for accessing the Animation menu and for reading a VTF-file1 • RPTP – Xtract Report Builder – a separate program associated with Xtract and used for automated report generation Also see Section 2.1 for an overview of data available for presentation depending on program extension. 1. VTF is together with VTFx a proprietary file format of Ceetron AS. Sesam Program version 3.0 2 Xtract 1-FEB-2011 2-1 FEATURES OF XTRACT Xtract presents model and results data of the Sesam Interface Files (see Section 2.15). Furthermore, certain results stored on a VTF-file (see Section 2.16) may be presented. The main features of Xtract include: • Quick and easy interactive rotation and zooming of model with results, during animation if relevant. • Model display and manipulation features include: — Surface, lines and outline view, with and without finite element mesh — Light sources giving shading effects or ambient light — Orthographic and perspective views — Colouring of elements according to element type, material type and shell/plate thickness — Adding model coordinate system, local element axes, labels for node and element numbers — Retrieving sets created by the preprocessor and creating new sets • Deformed and undeformed model • All basic stress components plus stresses averaged within elements and averaged in nodes • Derived stresses such as von Mises, decomposed (membrane and bending) and principal stresses • Annotated contour lines and colour contouring (filling) for displacements and stresses • Numeric values superimposed on model or only peak (maximum and minimum) values • Vector presentation of principal stresses and deformation • Transformation of stresses of shell, plate and membrane elements to a user defined coordinate system • X-Y graphing of results • Combinations of result cases and scanning for max/min over result cases • Complete handling of complex (frequency domain) results including finding phase giving max/min Xtract 2-2 Sesam 1-FEB-2011 Program version 3.0 • Unit conversion of model data and results • Splitting of the screen into one, two and four viewports and copying display between these • Colour/grey shaded plots annotated with header, footer and freely positioned text and pointers • Animation of results from structural dynamic and hydrodynamic analyses • Export of 3D model with results for interactive results interrogation in the free program Xtract Viewer • Export of two 3D models, typically a global model and a sub-model, for viewing one superimposed on the other in the free program Xtract Viewer • Export of 3D model, image, table and other results data to the separate program Xtract Report Builder for automated report generation 2.1 Models and Results for Presentation (Input to Xtract) In addition to results from a FE structural analysis Xtract may present other data. A complete list of alternative files for processing is provided below. The required program extension is also given (see Section 1.5 on program extensions). Refer to Section 2.15 for more information on Sesam Interface Files. 1 Structural Results Postprocessing – R#.SIN or R#.SIU or R#.SIF (R#.SI*) • The Results Interface File in alternative formats, # is the (top level) superelement number. • The file contains a FE model with structural analysis results. • Program extension required: STRU This kind of postprocessing is covered in Section 3.1 through Section 3.7. 2 Hydrodynamic & Structural Results Postprocessing – R#.SI* (above alternatives) + Gn.SIF • The Results Interface File plus the Hydrodynamic Results Interface File, also termed Global Response File. • The R#.SI* file contains a FE model with results from a structural analysis in frequency domain. • The Gn.SIF contains the rigid body motion of a floating object, possibly including a sea surface description. n is a positive number, normally 1. The file is created by Wadam or Wasim. • Program extension required: STRU This kind of postprocessing is covered in Section 3.8.1. 3 Model & Loads Presentation – T#.FEM + L#.FEM • The Input Interface File optionally appended by a Loads Interface File (automatically read if present). # may be a 1st level or top level superelement. • The T#.FEM file contains a FE model (no analysis results). • The optional L#.FEM contains hydrodynamic loads computed by Wadam or Wasim. • Program extension required: none This kind of postprocessing is covered in Section 3.8.3. Sesam Program version 3.0 Xtract 1-FEB-2011 2-3 4 Hydrodynamic Results Postprocessing – T#.FEM + L#.FEM + Gn.SIF • The Input Interface File appended by a Loads Interface File (automatically read) plus the Hydrodynamic Results Interface File, also termed Global Response File. # must in this case be a top level superelement. • The T#.FEM + L#.FEM files contain a FE model and hydrodynamic loads computed by Wadam or Wasim. • The Gn.SIF contains the rigid body motion of a floating object, possibly including a sea surface description. n is a positive number, normally 1. The file is created by Wadam or Wasim. • Program extension required: ANIM (to allow animation) This kind of postprocessing is covered in Section 3.8.2. 5 Animating Wasim Results – file.VTF (+ 2D-series.VTF) (+ T#.FEM) • A VTF-file produced by Wasim containing models of a vessel and a sea surface plus time domain motion results • A VTF-file containing 2D series data (component versus time) may optionally be opened • A T#.FEM file containing a FE model (extra geometry) may optionally be opened • Program extension required: ANIM This kind of postprocessing is covered in Section 3.9. 6 Animating Installjac Results – file.VTF (+ 2D-series.VTF) • A VTF-file produced by Installjac containing models of a jacket, barge and sea surface plus time domain motion results of the launching/floating stability/upending process • A VTF-file containing 2D series data (component versus time) may optionally be opened • Program extension required: ANIM This kind of postprocessing is covered in Section 3.10. 7 Animating Riflex Results – file.VTF (+ 2D-series.VTF) (+ T#.FEM) • A VTF-file produced by Riflex containing time domain results for conductors, risers and anchor lines • A VTF-file containing 2D series data (component versus time) may optionally be opened • A T#.FEM file containing a FE model (extra geometry) may optionally be opened • Program extension required: ANIM This kind of postprocessing is covered in Section 3.11. 8 Presenting Stofat Results – file.VTF • A VTF-file produced by Stofat containing a stiffened plate model with stochastic fatigue analysis results • Program extension required: ANIM This kind of postprocessing is covered in Section 3.12. Xtract 2-4 2.2 Sesam 1-FEB-2011 Program version 3.0 Result Positions, Attributes and Components The structural analysis results stored on the Results Interface File (‘results file’ or ‘R-file’ for short) are basically: • Displacement (and optionally velocity and acceleration) components in the nodes • Force and moment components for beam elements • Stress components for membrane, shell and volume elements Xtract presents these results and data based on these results in up to five positions: • Nodes – the nodes of the model • Elements – the nodes of the individual elements • Element average – the midpoint of the elements • Resultpoints – the points in which stresses and forces are found on the results file • Surface resultpoints – available for 6 and 8 node shell elements only, these elements have their result points located inside the elements in the thickness direction, extrapolation to the surfaces is therefore provided See Section 3.2.1 for more information on the result positions. The result positions contain one or more of the following result attributes (the list is not exhaustive): • DISPLACEMENT – nodal displacements • G-STRESS – general stresses (as found on the results file) • P-STRESS – principal stresses • PM-STRESS – principal membrane stresses • D-STRESS – decomposed stresses for shell elements • G-FORCE – general forces for beam elements • REACTION-FORCE – reaction forces in supported (fixed or prescribed) nodes Finally, the result attributes include result components, for example: • DISPLACEMENT includes the components X, Y, Z, RX, RY, RZ and ALL • G-STRESS includes the components SIGXX, SIGYY, TAUXY, etc. • P-STRESS includes the components P1, P2 and P3. • PM-STRESS includes the components P1 and P2. Sesam Program version 3.0 Xtract 1-FEB-2011 2-5 • D-STRESS includes the components SIGMX, SIGMY, TAUMXY, etc. • G-FORCE includes the components NXX, NXY, NXZ, MXX, etc. • REACTION-FORCE includes the components X-FORCE, Y-FORCE, Z-FORCE, RX-MOMENT, etc. A particular results value available for presentation is therefore identified by a result position, result attribute and result component (‘position/attribute/component’ for short). See Appendix B 2 for a complete list of all attributes and components. 2.3 Run Numbers, Result Cases and Occurrences The results are organised in a hierarchical manner: a run number contains a number of result cases which in turn contain a number of occurrences: • Run number – In most cases there will initially be only one run number (=1). Merging of results files (performed in Prepost) will result in a run number 2. Creating combinations in Prepost may also yield run numbers higher than 1. Combinations, scan result cases and scaled complex result cases created in Xtract will be put in a run ‘number’ termed User1. • Result case and Occurrence — For a static analysis the result cases correspond to the load cases for which the model was analysed. There will be only one occurrence per result case which means that this bottom level of the results hierarchy may be neglected. — For a dynamic analysis the results are grouped as occurrences under result cases. Typically the result cases correspond to wave directions (frequency domain analysis) or time histories (time domain analysis). The occurrences correspond to frequencies (frequency domain) or time steps (time domain). See Section 3.3 for more information on the organisation of results. 2.4 Combining and Scanning Results Any number of result cases (but only one complex result case, see Section 2.5) may be included in a combination. This new result case will comprise either only the result attribute selected for the combination or, optionally, all available result positions and attributes. In the former case, additional result positions/ attributes may be added to the combination. Read more about this in Section 3.1.17. Any number of result cases may be scaled and scanned for the (absolute) maximum or minimum of a selected result component. Read more about this in Section 3.1.18. 1. In Xtract’s database the run number 9999 is used even though it appears as ‘User’. When making combinations in Prepost the run number 9999 should therefore be avoided. Xtract Sesam 2-6 1-FEB-2011 Program version 3.0 2.5 Dynamic Frequency Domain Results – Complex Results Xtract offers specialised features for handling results from a dynamic analysis in the frequency domain. The complex results from such an analysis cannot be manipulated and presented in the same way as results from a plain static analysis. When presenting a complex result case it needs to be evaluated for a specific phase of the wave (or other harmonic loading). Furthermore, special considerations must be made when combining and scanning complex result cases. See Appendix B 5 for some basic theory on postprocessing complex results. Xtract will handle complex results as follows: • When a result component is presented the complex result case may be evaluated for the maximum (magnitude) of the component as well as for any user chosen phase of the wave. • A combination may include a single complex result case and any number of static (non-complex) result cases. The complex result case may be evaluated for the (absolute) maximum or minimum of any result component as well as for any user chosen phase of the wave. • A scanning for the (absolute) maximum or minimum value of a component may be done for any number of complex result cases and any number of static (non-complex) result cases. In this process each complex result case is evaluated. The evaluation may be done for a given phase or for the same criterion as the scanning over the result cases. The latter evaluation is normally the desired one and involves that if you want to scan a number of result cases for the highest von Mises stress then the complex result cases need to be evaluated for the highest von Mises stress also. • A complex result case may be scaled. I.e. the real and imaginary parts are simply multiplied by a given factor. Read more about this in Section 3.4. 2.6 Superelements Xtract handles large superelement hierarchies as well as single superelement models. Any kind of result may be presented in the same way for all superelements at any level. The way in which the model and results are presented may be controlled for the superelements individually (see Section 3.1.25). A browser provides an overview of the superelement hierarchy making it easy to select and display the desired superelement whether this is a first, top or intermediate level superelement. 2.7 Sets Sets defined by the preprocessors are stored on the results file and are available in Xtract. Also, new sets may be defined by various graphic means (left/right/above/below a line, rubberband, polygon) as well as by referring to existing sets, element numbers, material type, element type, beam cross section, shell thickness, coordinate ranges and result values. Read more about sets in Section 3.1.22. Sesam Program version 3.0 2.8 Xtract 1-FEB-2011 2-7 Graphs Three types of graphs may be created: • Nodes – a result component belonging to result position Nodes may be graphed over any number of selected nodes. • Beams – a result component belonging to result position Elements and attribute G-FORCE, i.e. beam forces and moments, may be graphed over any number of selected beam elements. • Occurrences – a result component belonging to result position Nodes or Elements may be graphed for any single node over any number of result cases and occurrences. This is mostly relevant for a time domain dynamic analysis for which the time history of for example a displacement component may be graphed. A graph may include curves for many components by adding new graphs on top of the existing one. Read about creating graphs in Section 3.1.15. In addition to the above there is a feature for graphing 2D series results stored on a VTF-file when this is in connection with presenting time domain results found on a VTF-file as detailed in Section 3.9, Section 3.10 and Section 3.11. 2.9 Animation Animation of results may be performed for: • Static results – Animation of a static displacement may give an improved understanding of the results. • Mode shapes – Animation is often the best way of presenting a mode shape (eigenvector). • Frequency domain results – The harmonic results may be animated through the whole cycle (360º) or parts of it. The displacements may be superimposed by colour contouring of any result component. During the animation the model with results may be rotated and zoomed and manipulated in other ways. • Time domain results – The time series results may be animated for all or selected time steps of the time history. The displacements may be superimposed by colour contouring of any result component. During the animation the model with results may be rotated and zoomed and manipulated in other ways. Animating the time domain results stored on a VTF-file by Wasim, Installjac and Riflex falls into this category. Read more about animations in Section 3.7. 2.10 Plotting and Printing (Tabulating) The display may either be printed on an on-line printer, saved in a plot file using a selection of graphic formats or simply put on the clipboard for subsequent pasting into a document. Choose between exporting the display as is, with white background and in black and white mode. Export either the active viewport only or all viewports. Read more about this in Section 3.1.26. Xtract 2-8 Sesam 1-FEB-2011 Program version 3.0 Header and footer texts may be given for plot files. These will be added to the plot file with increased font size compared with other text. (Header and footer cannot be given when exporting all viewports.) Numeric results may be tabulated on-screen and saved in a file suitable for importing into a spreadsheet. The currently selected component is tabulated initially. The table may then be extended to include all components, all result cases and corresponding coordinates. Read about tabulation in Section 3.6. 2.11 Viewing a 3D Model with Results in Xtract Viewer A 3D model with a selected result component and result case (termed a display scene) may be exported to a VTFx-file1. The display scene may be an animation of dynamic results. The VTFx-file may be opened in the free program Xtract Viewer2 for interactive 3D viewing of the model with results. By use of the free GLview 3D Plugin3 embedded into MS Word and PowerPoint interactive 3D viewing of the model with results is also available in a Word report and a PowerPoint slideshow. A Sesam user may thus prepare data and send to a non-Sesam user who may view the data in an Xtract like environment. Read more about this in Section 3.13.1. 2.12 Viewing Two 3D Models (Global Model plus Sub-Model) in Xtract Viewer Two 3D models may be exported to a common VTFx-file. The feature is general but it is particularly useful for comparing a sub-model with the global model in a sub-modelling type of analysis, i.e. involving use of the program Submod. The deformed shape of the two models may for instance be overlaid to verify that the deformations at the outer boundary of the sub-model match those of the global model. Such match of deformations is an absolute demand in a sub-modelling analysis. Read more about this in Section 3.13.2. 2.13 Automatic Report Generation – the Xtract Report Builder A report of the analysis results may be created in an automated fashion. Rather than the traditional approach of saving stress contour images in Xtract (e.g. as gif-files) and subsequently manually import these into the report (e.g. an MS Word document) the stress contour images are saved to a repository (database) which in turn is opened by the Xtract Report Builder4. This program allows for automatic generation of a report by merging the data saved to the repository with a report template. Not only 2D images but also 3D models 1. VTFx is a proprietary file format of Ceetron AS. It is an XML based and enhanced version of the VTF format. 2. Xtract Viewer is a free 3D viewer for presentation and distribution of 3D models and results. The product enables full 3D interactivity and high performance graphics. Xtract Viewer is developed and owned by Ceetron AS. 3. GLview 3D Plugin is a free 3D viewer for presentation and distribution of 3D models and results. The product is embedded into MS Word, MS PowerPoint and MS Internet Explorer and enables full 3D interactivity and high performance graphics. GLview 3D Plugin is developed and owned by Ceetron AS. 4. Xtract Report Builder is a program for easy capturing of information during postprocessing using Xtract and exporting the captured information to a report. Xtract Report Builder is developed and owned by Ceetron AS and marketed by DNV Software. Sesam Program version 3.0 Xtract 1-FEB-2011 2-9 with associated data like maximum and minimum values as well tabular data may be saved to the repository for reproduction in the report. Read more about this in Section 3.13.3. 2.14 Logging and Reading Commands The user interaction through the GUI as well as commands entered through the keyboard (line-mode commands) may be logged on a user given file name. This file name may be edited and used as a Command input file to a subsequent run. This feature allows an interactive session to be modified and re-run thereby saving time in e.g. creating load combinations and producing plots for a report. Read more about working with line-mode commands in Section 3.16. 2.15 Transfer of Data through the Sesam Interface File System Xtract reads model and results data from Sesam Interface Files. These files are comprised of the following subsets: • Input Interface Files (T#.FEM) • Loads Interface Files (L#.FEM) • Hydrodynamic Results Interface File, also termed Global Response File (Gn.SI*) • Results Interface Files (R#.SI*) The name of a Sesam Interface File may be written: prefixX#.frm where: • ‘prefix’ is an optional character string. • ‘X’ represents a single character taking the values T, L, G or R as indicated above. • ‘#’ is the superelement number, or in case of the Hydrodynamic Results Interface File a data set identifier n, normally equal to 1. • ‘frm’ is a file extension that takes different values: — FEM for T- and L-files — SIF (ASCII formatted), SIU (sequential unformatted) or SIN (database format) for G-and R-files An example of a name of an Input Interface File with prefix ‘ABC’: ABCT5.FEM An example of a name of a Structural Results Interface File in database format and with prefix ‘ABC’: ABCR5.SIN Xtract 2-10 2.16 Sesam 1-FEB-2011 Program version 3.0 Transfer of Data to Xtract through a VTF-File The following Sesam programs produce VTF formatted files containing results for presentation: Installjac, Riflex, Stofat and Wasim. Xtract may open and process such VTF-files. Sesam Program version 3.0 3 Xtract 1-FEB-2011 3-1 USER’S GUIDE TO XTRACT This chapter explains how to use the program for the most typical postprocessing tasks. Section 3.1 is a tutorial in basic use of Xtract. Section 3.2 and Section 3.3 provides details on the organisation of the structural analysis results data (from Sestra). Section 3.8 addresses presentation and animation of hydrodynamic results (from Wadam or Wasim). Section 3.9 through Section 3.12 addresses how to process results stored on a VTF-file from Wasim, Installjac, Riflex and Stofat. The other sections (Section 3.4 through Section 3.7 plus Section 3.14 through Section 3.16) provide information on how to do specific and some specialised postprocessing tasks. 3.1 Getting Started This section takes you through the basic operations of Xtract. That is, using its graphical user interface (GUI) for basic postprocessing tasks. You may want to perform these operations as an exercise using the same model as referred to here: a plate connection with stiffeners and bracket. Then you need to create the model in either GeniE, Patran-Pre or Prefem using input given in Appendix A 1 (the input may be copied from a pdf version of this manual) and run a static analysis in Sestra before proceeding with the tutorial. Even though this tutorial is not directly applicable for presenting results from Wadam, Wasim, Installjac, Riflex and Stofat (that all create VTF-files for presentation in Xtract) several of the issues discussed herein are relevant for such use also. You are therefore advised to study this tutorial before proceeding to the relevant one of Section 3.8 through Section 3.12. 3.1.1 Starting Xtract and Opening the Results Interface File Start Xtract from Sesam Manager, from Brix Explorer for Sesam, from GeniE or from HydroD. Alternatively, if you have set the SIN file type to be opened with Xtract you may double-click the SIN-file produced by the Sestra analysis. Depending on how you start Xtract some of the initial steps listed below may be performed automatically. In Xtract do the following: Xtract 3-2 Sesam 1-FEB-2011 Program version 3.0 1 Open the Results Interface File by File > Open (or click the tool button ). If you have a superelement model then select the top level file whichever format this has (SIF, SIU or SIN, see Section 2.15). 2 Having opened the results file the Database dockable window will appear and the model name being the same as the name of the results file is shown. Double-click it and the model will be displayed. To view the FE mesh do Display > Show mesh (or click the tool button ). 3 Now present the displacements of the first result case by clicking the Result Cases tab of the Database window (see Figure 3.2) and then double-click in sequence the result position Nodes (see Section 3.2.1 about result positions), the attribute DISPLACEMENT and the component ALL (see Appendix B 2 about attributes and components). The Xtract window will open and display the model with displacements for the first result case as shown in Figure 3.1. 3.1 Figure 3.1 Xtract window with initial display of the model – displacements are contoured Sesam Xtract Program version 3.0 3.1.2 1-FEB-2011 3-3 The Graphical User Interface of Xtract The Xtract window consists of various dockable windows, i.e. windows that may be docked along the edges of the Xtract window or torn loose and moved to any position on the screen. Figure 3.2 is a sketch illustrating the graphical user interface of Xtract with its dockable windows. Figure 3.31 shows an example of the Database window torn loose to increase the display area. Note that the Database window and the Command and message window may also be re-sized. The dockable windows are used as follows: • The menu bar and tool button bar for all general interactive operations • The Database window for selecting model (superelement), result case, result component and set • The Command and message window for entering commands through the keyboard (line-mode commands) and for feedback from the program 3.2 Figure 3.2 The graphical user interface of Xtract 3.1.3 Basic Display and Model Manipulation You may manipulate the model display interactively (the most important methods of manipulation is highlighted by bold text): • Rotate by either: — Pressing the right mouse button (RMB) and moving the mouse up/down/left/right, or Xtract Sesam 3-4 1-FEB-2011 Program version 3.0 — Clicking the navigation cube in the lower left corner of the display area. Figure 3.3 shows the navigation cube in various situations: 1) initially, when positioning the mouse on the 2) edge, 3) corner and 4) side (click these to view the model from that position), 5) after clicking the side ‘Neg Y’ (in this situation arrows for rotation appear), and 6) after clicking the arrow for rotating 90 degrees clockwise. 3.3 1) 2) 3) 4) 5) 6) Figure 3.3 Use of the navigation cube • Zoom by alternative means: — Shift+RMB and move the mouse up (zoom in) and down (zoom out) — Rotate the mouse wheel up (zoom in) and down (zoom out) — Zoom in and out by a factor of 1.5 by clicking the tool buttons and — Zoom with rubberband by Display > Zoom (or click the tool button with the RMB. . ) and dragging a rectangle — Zoom with rubberband by Shift+Ctrl+RMB and dragging a rectangle • Pan by Ctrl+RMB and moving the mouse. You may jump to preset view positions by: Display > View from > Global axes > … Display > View from > Isometric > … Notice that a selection of the preset view positions are available as tool buttons: . The latter two are return to initial (default) view position and overstore default view position by current position, respectively. You may also open the Viewbox dialog, see Figure 3.4, by which the model may be rotated, panned and zoomed in user-controlled increments. Clicking the Rotate and Zoom Default buttons will bring you back to the initial view position. The Viewbox dialog is opened by: Display > Viewbox Sesam Xtract Program version 3.0 1-FEB-2011 3-5 3.4 Figure 3.4 Viewbox dialog for rotating, panning and zooming Make the complete model fit into the display area by: Display > Frame (or click the tool button or Ctrl+F) Add and remove (toggle) display of the FE mesh: Display > Show mesh (or click the tool button or Ctrl+Alt+M) – only relevant with Show as surface Show the FE mesh as lines only (wireframe), as outline (model edges only), as lines with hidden lines removed and thereafter return to Show as surface: Display > Show as lines (or Ctrl+Alt+L) Display > Show as outline (or click the tool button or Ctrl+Alt+O) Display > Show as hidden lines (or Ctrl+Alt+H) Display > Show as surface (or click the tool button or Ctrl+Alt+S) When Display > Show as surface is active beam elements are shown with their sections (I or H, pipe, box, L (angle), channel, bar, un-symmetric I and double bottom). Show beams as lines by: • Clicking the tool button (this takes effect for all superelements in a superelement model) • Alternatively, for a superelement model, open the Part attributes dialog by Display > Part attributes, select the appropriate part(s) – in most cases this will be the superelement(s) – and switch off Expanded (see Figure 3.41). When not being expanded beam elements are displayed as thick lines between nodes (i.e. not showing the cross section and neglecting any eccentricities). Adjust the line thickness by: Display > Beam width > pixels (default number of pixels is 3) Xtract 3-6 Sesam 1-FEB-2011 Program version 3.0 Note: Display > Show as (hidden) lines will display beam elements with thin lines irrespective of the ‘Expanded’ and ‘Beam width’ settings. 3.1.4 Viewing Results Now we want to view some more results. Click the Result Cases tab of the Database window and see that the following five result positions are shown (Section 3.2.1 provides more information on result positions): • Nodes • Elements • Element average • Resultpoints • Surface resultpoints – only for models containing 6 and 8 node shell elements Section 3.1.5 through Section 3.1.14 deal with viewing various results. Note: Use of Sesam is based on choosing a consistent set of units: SI, Imperial, American or any other consistent set. This choice is made when creating the modelling. However, the time unit is seconds and the rotational unit is radians. Note: The results file contains no information on the chosen set of units. Results interpretation in Xtract is therefore based on knowing which set of units were chosen in the modelling stage. See Section 3.1.21 Unit Conversion. 3.1.5 View Nodes/DISPLACEMENT Notice that the result position Nodes is expanded (the attributes G-STRESS, P-STRESS, etc. are listed) while the result positions Elements, Element average, Resultpoints and Surface resultpoints are collapsed, see Figure 3.5. Furthermore, the attribute DISPLACEMENT is expanded (the components ALL, X, Y, etc. are listed). View any component (X, Y, etc.) of the total displacement (ALL) by double-clicking the component. Sesam Program version 3.0 Xtract 1-FEB-2011 3-7 3.5 Figure 3.5 Result positions shown in Database window – Nodes/DISPLACEMENT expanded 3.1.6 View Nodes/G-STRESS Expand the G-STRESS attribute of Nodes by clicking the plus sign and then double-click the VONMISES component to see the von Mises stresses averaged between coplanar adjoining elements. See section “Result Position: Nodes” on page 3-55 about nodal averaging. Note: The von Mises stress is computed as follows: Basic stress components are averaged between coplanar adjoining elements. Von Mises is then computed according to Appendix B 3.4. Display the model deformed at the same time by: Model > Deformed (or click the tool button or Ctrl+Alt+D) Increase the scaling of the deformations and add an undeformed wireframe of the model by: Model > Deformation scaling Model > Add undeformed wireframe (toggle for adding and removing wireframe) By default the results are shown for the upper plate/shell surface (as stated in the Info box in the lower right corner) which is on positive local z-axis side. See Section 3.2.2 for more information on the concept of upper and lower surfaces. 3.1.7 View Elements/G-STRESS Now, expand the result position Elements and thereafter the G-STRESS attribute and double-click the VONMISES component to see the von Mises stresses of the individual elements. I.e. stresses not averaged between adjoining elements. See Figure 3.6. Xtract 3-8 Sesam 1-FEB-2011 Program version 3.0 Note: Both expanding (clicking the plus) and collapsing (clicking the minus) of the result positions and attributes may be done by double-clicking the result position/attribute. 3.6 Figure 3.6 Result position Elements and attribute G-STRESS expanded and display of von Mises stress for deformed model Note: Shell/plate and membrane stresses refer to local element coordinate systems. See Appendix B 2 for more information on this. See Section 3.1.25 about adding local element coordinate systems to the display. If you want the exact values of the von Mises stress you may add numeric values to the display: Results > Show values (or click the tool button ) Showing result values will easily clutter the screen. Zoom in to see the values as shown in Figure 3.7. Note: Display > Labeling allows limiting the number of numeric values shown. By default maximum 10.000 values are shown. The user given number of values are distributed over the model. Setting the number to e.g. 100 prevents the screen from being cluttered. Zoom in and see more and more values, and finally all within the region, pop up. You may also select Show all. Note: Display > Labeling also allows switching off the background box of the labels. See the lower left of Figure 3.7. Sesam Program version 3.0 Xtract 1-FEB-2011 3-9 Note: Element related numeric values that refer to the nodes (e.g. Nodes G-STRESS and Elements G-STRESS) are pulled inside the elements so as not to overlap each other. See Figure 3.7. 3.7 Figure 3.7 Result values are pulled inside the elements (here 8 node shell) to avoid overlapping 3.1.8 View Elements/P-STRESS Expand the result attribute P-STRESS of position Elements and double-click the P1 component. The first (highest, most positive) principal stress is shown. Zoom in on an area of interest (ref. Figure 3.8) and show the principal stresses as vectors by: Results > Show vectors (or click the tool button ) Xtract 3-10 Sesam 1-FEB-2011 Program version 3.0 Note: Labels (result values, principal stress vectors, etc.) are lifted towards the eye in order not to be hidden by the model itself. But in certain cases labels may still be partly hidden. Labels may then be lifted more by the Lift factor in the Labeling dialog (see Figure 3.39). 3.8 Figure 3.8 Principal stress P1 (Elements/P-STRESS) contoured and vectors for P1 and P2 shown The principal stress vectors are shown as orthogonal intersecting lines. Negative (compressive) stresses are indicated by small crosslines at both ends of the lines. The three principal stresses are distinguished by colours and lengths as explained in Figure 3.9. 3.9 P1 (the highest/most positive value) is cyan (light blue) P2 is magenta and has length 60% (in space) of P1 P3 (the lowest/most negative value) is yellow and has length 60% (in space) of P2 Figure 3.9 The three principal stress vectors shown as intersecting coloured lines Sesam Program version 3.0 Xtract 1-FEB-2011 3-11 The vector lengths are by default as explained above but may be set to be proportional with value by: Results > Settings > Vectors > Scale P-stress vectors according to value Note: Principal stress vectors are by default shown for both P1 and P2 (and P3 when relevant) even though stress contours are only shown for one of them. The Info box in the lower right corner contains information about which principal stress is selected (contoured) and which principal stress vectors are shown. The 6 and 8 node shell elements have three principal stresses, the Info box will therefore list all three. However, P3 is zero on the shell surfaces and its vector is therefore not shown in Figure 3.8. (Selecting a principal stress for position Resultpoints that are found inside the shell will display also P3.) You may switch off (and on again) display of vectors for P2 by: Results > P-stress vectors > P2 Note: Principal stresses based on membrane stresses only are available through the attribute PMSTRESS. I.e. the principal stresses are based on the D-STRESS components SIGMX, SIGMY and TAUMXY and with no contribution from the bending components SIGBX, SIGBY, TAUBXY, TAUBXZ and TAUBYZ. 3.1.9 View Elements/G-FORCE The forces and moments of the beam elements may also be shown. Expand the G-FORCE attribute of the result position Elements and double-click the NXX component to present the axial force. Results are only shown for beam elements, shell elements that do not have this particular result component are grey. The positions and values of the maximum and minimum values are found by: Results > Show peaks See the model from another view point: Display > View from > Isometric > -X+Y-Z Figure 3.10 shows the axial force of the girders and stiffeners. Note: The positioning of the maximum and minimum values does not account for any eccentricities. Xtract 3-12 Sesam 1-FEB-2011 Program version 3.0 3.10 Figure 3.10 Axial force NXX (Elements/G-FORCE) contoured and peaks shown 3.1.10 View Elements/B-STRESS Xtract computes axial and shear stresses in the beam elements based on the forces and moments (G-FORCE attribute). See Appendix B 4 for details on how the beam stress components are computed. Expand the B-STRESS attribute of result position Elements and double-click the SIGBYX2 component to present the normal stress in (the most extreme fibre of) the flange of the girders and stiffeners due to the moment MXY. Figure 3.10 shows the axial force of the girders and stiffeners. Note: The whole beam section is coloured even though the B-STRESS components generally refer to the extreme fibres only. (The SIGXX component is constant over the section though.) Note: Xtract does not provide information as to where in the section (for which extreme fibres) the B-STRESS components are found. Note: See notes in Appendix B 4 about how to interpret the B-STRESS components. Sesam Program version 3.0 Xtract 1-FEB-2011 3-13 Note: The B-STRESS attribute will not appear if reading beam sectional data is switched off using Display > Read beam expansion; see Section 3.15.1. 3.11 Figure 3.11 Normal stress SIGBYX2 (Elements/B-STRESS) contoured and peaks shown 3.1.11 View Element average/G-STRESS Xtract computes element average values as the average of corner values in position Elements. Expand the result position Element average and thereafter the G-STRESS attribute and double-click the VONMISES component to see a single von Mises stress value per element. See Figure 3.12. Note: Contour type Lines cannot be used for Element average results as it has no meaning. Xtract 3-14 Sesam 1-FEB-2011 Program version 3.0 3.12 Figure 3.12 Von Mises stress in result position Element average 3.1.12 View all Components of an Attribute In the previous sections a single results component is presented at the time. This section explains how you can present numeric values for all components of an attribute at the same time. This is done by entering a mode allowing you to click (select) nodes or elements, one at the time, for which all components will be presented in a box next to the nodes/elements. The element values presented are those belonging to the result position Element average, see Section 3.1.11. Present all components of a Nodes attribute by either: • ‘Results > Show values for the following nodes’ followed by LMB clicking nodes, or • Ctrl+LMB click a node and continue LMB clicking more nodes. Present all components of an Element average attribute by either: • ‘Results > Show values for the following elements’ followed by LMB clicking elements, or • Shift+Ctrl+LMB click an element and continue LMB clicking more elements. Sesam Program version 3.0 Xtract 1-FEB-2011 3-15 Figure 3.13 shows an example of showing values for selected elements. The cursor may be positioned anywhere inside the element and the box will appear with its lower left corner in the element midpoint. To remove a box click the element once more. When showing values for nodes click anywhere inside an element and the nearest node will be selected. The box will appear with its lower left corner in the node. To remove a box click near the node once more. To remove all boxes give: Results > Clear selected elements/nodes 3.13 Figure 3.13 Boxes showing all components of an Element average attribute for selected elements Note: Showing result values for elements and nodes requires ‘Result > Show result values in labels’ to be set (the default condition). Without this setting only the element/node number is shown. Note: When showing element values: Components of an attribute of the position ‘Element average’ is presented in the box irrespective of which result position is selected, i.e. colour contoured. E.g. selecting a component of Nodes/G-STRESS or Elements/G-STRESS both result in Element average/G-STRESS components to be shown. Be aware of the possible confusion in this. Note: When showing nodal values: Components of an attribute of the position Nodes is presented in the box irrespective of which result position is selected, i.e. colour contoured. E.g. selecting a Xtract 3-16 Sesam 1-FEB-2011 Program version 3.0 component of Elements/G-STRESS or Element average/G-STRESS both result in Nodes/GSTRESS components to be shown. Be aware of the possible confusion in this. Note: For combinations and scan cases showing all components of an attribute cannot be done unless the combination/scan case includes the relevant Nodes/Element average attribute. 3.1.13 View Resultpoints/G-FORCE The values as computed by the analysis program, i.e. neither interpolated, extrapolated nor averaged, are found in the Resultpoints position. These data represent the pure and non-manipulated data and may only be shown with their numeric values. Expanding position Resultpoints and attribute G-FORCE and double-clicking NXX, see Figure 3.14, shows the numeric values of the axial force. To avoid cluttering the display the values shown may be limited to selected result point numbers. Figure 3.15 shows how Results > Settings (or click the tool button ) and selecting the Misc tab allows limiting values to selected result points: Check the ‘Show result labels for selected resultpoints only’ box, enter a result point number in the small list box and click Add to move the number to the larger list box. (See Section 3.2.1 for more information on result points and their numbering.) 3.14 Figure 3.14 Selecting Resultpoints/G-FORCE/NXX Note: Element related numeric values that refer to points positioned in the nodes (in this case Resultpoints G-FORCE) are pulled inside the elements so as not to overlap each other. Note: As an alternative to limiting values shown to selected result points be aware of the possibility to show numeric values for the result position Element average, i.e. a single value for each element. See Section 3.1.11. You may customize the display in various ways. You may for example set the background to white and increase the font size by Display > Settings. The colour of the superelement may be changed from red to white (or rather tones of grey due to light source and shading) by Display > Part attributes. You may remove the background box of the labels (the numeric values) by Display > Labeling. Read more about these settings in Section 3.1.25. When printing or saving graphics (plots) you may save (export) the graphics as appearing on screen (as is), with white background and in black & white mode. Read more about this in Section 3.1.26. Figure 3.16 illustrates such customization. Sesam Program version 3.0 Xtract 1-FEB-2011 3-17 3.15 Figure 3.15 Axial force NXX (Resultpoints/G-FORCE) values shown for result point 2 3.16 White background, increased font size, white (grey shaded) superelement Remove background box Export graphics in black & white mode Figure 3.16 Customizing the display Xtract 3-18 Sesam 1-FEB-2011 Program version 3.0 3.1.14 View Nodes/REACTION-FORCE Expand the REACTION-FORCE attribute of Nodes and double-click the X-FORCE component. As colour contour presentation is irrelevant for reaction forces (see note below) switch to numeric presentation by: Results > Show values (or click the tool button ) Note: The value zero will appear for all nodes but the fixed ones (zero value means no reaction force) as seen in Figure 3.17. These zeros are irrelevant. Note: The reaction forces are by default shown by colour contours (as for all Nodes and Elements results). This form of presentation is strictly irrelevant as the reaction forces cannot be interpolated and contoured inside the elements. The colours may be interpreted as a mere highlighting of fixed nodes. Alternatively, the colours may be switched off by Results > Show contours (or click ). 3.17 Figure 3.17 Reaction force X-FORCE (Nodes/REACTION-FORCE) values shown for fixed nodes 3.1.15 Creating a Graph First, switch off showing results by Display > Results. Sesam Program version 3.0 Xtract 1-FEB-2011 3-19 A graph may be presented for the axial force along the beam elements constituting the curved flange of the bracket. Open the Graph construction dialog by: Graph > Generate graph In the Graph construction dialog click the Item type Beams. The only attribute available for graphing for beams is G-FORCE in position Elements. Select the NXX component. Select a result case (or occurrence if relevant). Adjust the text for Curve name as desired. Select all beam elements by checking the option Expand selection in the Graph construction dialog and then click the first and last beam of the flange (see Section 3.14.1 for a note on selecting beam elements). The selected beams are labelled by their element numbers and they appear in the Selected items box of the Graph construction dialog. Verify that all beams along the flange have been picked up. If not then click Clear in the Graph construction dialog and perform a new selection this time clicking as many times along the flange as needed to pick up all beams. (The Expand selection feature attempts to find a straight as possible path between the items you click.) The graph appears in the upper right corner of the display area when Create is clicked. Adjust the appearance of the graph through: Graph > Options In the Graph options dialog you may change the title of the graph and its axes, change the background colour of the graph (when set to white the axes and text change to black), make it transparent, take control over the scaling of the axes and more. Figure 3.18 shows the Graph construction and Graph options dialogs together with the Xtract window with the graph. The view direction has been changed to another isometric view by Display > View from > Isometric > +X -Y +Z followed by zooming in a bit. Other result cases may be added to the same graph by selecting a new result case (the Occurrences box), checking the Leave old curves option and clicking Create. You may fill the entire viewport with the graph through: Graph > Draw graph in > Entire viewport Making the graph transparent (Transparent plot in Graph options dialog) and having suitable colours for the graph background (Background button in Graph options dialog) as well as the display background (in Display settings dialog) allow you to present the graph on top of the model as exemplified in Figure 3.19 where NXX is graphed for four result cases. Switch off the graph by the toggle: Graph > Show graph Xtract 3-20 Sesam 1-FEB-2011 Program version 3.0 3.18 Figure 3.18 Graph for beam force created through Graph construction and Graph options dialogs Sesam Program version 3.0 Xtract 1-FEB-2011 3-21 3.19 Figure 3.19 Transparent graph filling entire viewport You may also create a graph for various result components over selected nodes by selecting Item type Nodes in the Graph construction dialog; see Figure 3.20. Note: The Expand selection check box, see Figure 3.18 and Figure 3.20, allows selecting all beam elements or nodes on a straight line (or a line as straight as possible) between two selected items. Note: See Section 3.14.1 for more notes on graphing. Xtract 3-22 Sesam 1-FEB-2011 Program version 3.0 3.20 Figure 3.20 Graph for displacement over nodes (the figure is cropped) Finally, you may create a graph for result components in a single node over selected occurrences of a result case (see Section 3.3.2 for an explanation of occurrences) by selecting Item type Occurrences in the Graph construction dialog. This type of graph is relevant for results from frequency and time domain analyses. Note: When graphing results from frequency and time domain analyses it may be relevant to select all occurrences of a result case. Rather than selecting the occurrences one-by-one select only one, for example the first, and check the All occurrences check box as shown in Figure 3.21. 3.21 Figure 3.21 Selecting all occurrences of a result case in the Graph construction dialog Having created a graph the values of all the curves of the graph may be exported to a file by the line-mode command (include the file type txt in the file name, e.g. values.txt): Sesam Program version 3.0 Xtract 1-FEB-2011 3-23 graph export filename 3.1.16 Selecting Result Case Now we want to view results for another result case. At the bottom of the Database window (Result Cases tab) you may select a new result case in three alternative ways: (1) through the Result case combo box, (2) through the Result case slider and (3) through the Result case spin (up/down) buttons. See Figure 3.22. Note: When dragging the Result case slider the command log, see Section 3.16, may include logging of some arbitrary intermediate result cases. It may also include multiple logging of the same result selection command depending on the speed by which the slider is dragged. You may want to remove such superfluous logging when using the log as a command input file or documentation of work done. Note: The combo boxes for Run and Occurrence are inaccessible (grey) here as this analysis only contains a single Run number and each Result case contains only a single Occurrence. The text above the Result case combo box provides basic information on the result case. Click the Info button to get more information (result case properties). For a combination or scan result case all contributing result cases will be listed; see Figure 3.24 and Figure 3.27. 3.22 Figure 3.22 Result case selection in three alternative ways – Info button for result case information 3.1.17 Combining Result Cases Combining (adding with scaling factors) result cases is done through: Results > Combine (or click the tool button ) The Combine dialog, see Figure 3.23, appears in which Source result cases are transferred to the Combination result cases list box. Select result cases in the Combination result cases list box and adjust the Scaling factor (default 1), give the combination a name and click Apply. Xtract 3-24 Sesam 1-FEB-2011 Program version 3.0 3.23 Figure 3.23 Combining result cases Note: You may select and transfer two or more Source result cases at the time. Note: You may select and change Scaling factor for two or more Combination result cases at the time. Note: The combination is established for the result position and attribute (all its components) highlighted in the database window and listed to the lower right in the Combine dialog. Change result position and attribute by selecting (single-click to highlight) the appropriate one (or any component of the attribute) and return to the Combine dialog. The new result position and attribute will be listed in the Combine dialog. Note: You may want to establish the combination for all available results (all attributes of all positions). Do so by checking the All results option in the Combine dialog. Alternatively, you may add extra attributes to an existing combination by the line-mode command ‘combine add’. Note: When checking the All results option and one of the selected result cases is complex then the evaluation should be performed for a specific phase only, i.e. do not choose True/Absolute Minimum/Maximum. Combinations are put in a Run named User (see Section 3.3.1 for an explanation of the concept of Run numbers). To select the combination you therefore need to select the Run named User (see Figure 3.24), thereafter select the relevant Result case (i.e. the combination name) and finally expand to find and double-click the desired component. Click the Info button to get information on a combination. Sesam Xtract Program version 3.0 1-FEB-2011 3-25 3.24 Figure 3.24 Combinations are found in a Run named User Delete a combination by the line-mode command: result deletecase name-of-case Note: Do not delete a combination that is referred to by another combination or scan result case. Note: Deformed model is unavailable for a combination not containing displacements. Use ‘combine add combination nodes displacement’ and reselect the combination to enable deformed model. Note: For a superelement model a combination may be created for any superelement at any level. The combination will, however, only be available for the chosen superelement and lower level superelements contained in it. Square Root of Sum-of-Squares Combination for Elements/G-STRESS A specialized feature is available for combination of Elements/G-STRESS components: As an alternative to a normal linear combination a square root of sum-of-squares type of combination may be performed. See Section 3.15.2 for further explanation of this. Change Normal sum in the Combine dialog to Square root of sum-of-squares to perform this type of combination. Note: Square root of sum-of-squares combination is available only for the linear components (i.e. not von Mises) of Elements/G-STRESS and Elements/D-STRESS. Note: The square root of sum-of-squares combination cannot be used when one of the resultcases is complex (see Section 3.4.2). 3.1.18 Scanning Result Cases Scan selected (and scaled) result cases for the maximum or minimum (absolute) values of a selected result position/attribute/component by: Results > Scan (or click the tool button ) Xtract 3-26 Sesam 1-FEB-2011 Program version 3.0 The Scan dialog, Figure 3.25, appears in which Source result cases are transferred to the Selected source result cases list box. Select result cases in the Selected source result cases list box and adjust the Scaling factor (default 1).When determining the Scan criterion note that: • (True) maximum(3,5) = 3 • Absolute maximum(3,5) = 5 (the value, positive or negative, when the absolute value is maximum) • (True) minimum(3,5) = 5 • Absolute minimum(3,5) = 3 (the value, positive or negative, when the absolute value is minimum) Give the scan result case a name and click Apply. 3.25 Figure 3.25 Scanning result cases Note: You may select and transfer two or more Source result cases at the time. Note: You may select and change Scaling factor for two or more Selected source result cases at the time. Note: The scanning is performed for the result position/attribute/component highlighted in the database window and listed to the lower left in the Scan dialog. Change result position/attribute/ component by selecting (single-click to highlight) the appropriate one in the database window and return to the Scan dialog. The new result position/attribute/component will be listed in the Scan dialog. Note: Even though the scanning is performed for a specific component the scan result case will contain all components of the attribute in question. I.e. if you scan for Elements/G-STRESS/VON- Sesam Program version 3.0 Xtract 1-FEB-2011 3-27 MISES then the scan result case will also contain SIGXX, SIGYY and TAUXY (assuming four node element). These other components are normally of little interest though. Note: The scan result case created will at any point in the model contain the (absolute) maximum/ minimum of the selected component over all selected (and scaled) result cases. Note: Deformed model for a scan result case is normally unavailable and meaningless. Scan result cases are put in a Run named User (see Section 3.3.1 for an explanation of the Run numbers). To select the scan result case you therefore need to select the Run named User, thereafter select the relevant Result case (i.e. the scan result case) and finally expand to find and double-click the scanned component. In addition to the attribute with components resulting from the scanning, the scan result case will contain an attribute named MISC which in turn contains the component SCANINDEX. Selecting (double-clicking) this component gives labels (text strings) for all scanned points that identify the result cases that ‘won’ the scanning. By default this label will include the full result case identification which typically may look like: • For static (non-complex) results: Run 1, Result case 2, 2 Case 2 • For complex results: Run 2, Result case 1, 3 Excit. freq. 5 Hz, phase 170 The text string of the SCANINDEX label may be modified through Display > Labeling For static results you may want to uncheck the Run option, change the Result case prefix to ‘Result case’ (i.e. remove the comma in front since the Run number has been removed) and set the Occurrence option to ‘None’. For complex results you may want to uncheck the Run and Result case options, set the Occurrence option to ‘Show all’ and change the Occurrence prefix to for example ‘Occ’. (See Section 3.4.3 about scanning complex results.) If you also check ‘Show SCANINDEX together with result label’ the SCANINDEX will be appended to the numeric display of results as shown in Figure 3.26. There are in addition to the default setting two preset versions of the SCANINDEX string: • A ‘minimum string’ for static results, click the ‘Min. static results’ button • A ‘minimum string’ for complex results, click the ‘Min. complex results’ button Xtract Sesam 3-28 1-FEB-2011 Program version 3.0 3.26 Static results: Complex results: Figure 3.26 Showing adjusted SCANINDEX (result case identification) together with scan result Click the Info button to get information on a scan result case. Figure 3.27 shows a rather elaborate example of a scan over 24 source result cases, each being a combination a few static and a single complex result case. 3.27 Figure 3.27 Result case properties obtained by clicking Info button Delete a scan result case by the line-mode command: result deletecase name-of-case Sesam Program version 3.0 Xtract 1-FEB-2011 3-29 Note: Do not delete a scan result case that is referred to by another combination or scan result case as this may lead to inconsistency. Note: For a superelement model a scan result case may be created for any superelement at any level. The scan result case will, however, only be available for the chosen superelement and lower level superelements contained in it. 3.1.19 Transforming Stresses Shell/plate and membrane stresses refer to local element coordinate systems. See Appendix B 2 for more information on this. You may transform the stresses to a new local element coordinate system by: Results > Settings (or click the tool button ) > Transformations The transformation is limited to a rotation about the surface normal, i.e. the local z-axis remains the same. The transformation may be done in two alternative ways: • A rotation about the surface normal in terms of degrees • The projection of a vector onto the surface defines either the new local x-axis or the new local y-axis. The vector may be given in the coordinate system of the top level superelement or the 1st level superelement. Figure 3.28 shows Elements G-STRESS components for the bottom plate (set named DECK) before stress transformation, i.e. in the local element coordinate system of the analysis program Sestra. Viewport 3 (lower left) shows the local x- and y-axes. See Section 3.1.23 about adding local element coordinate systems to the display. Figure 3.29 shows the same stress components after a transformation, a 30 degree rotation about the surface normal (local z-axis). The rotation is seen in viewport 3. Notice that the SIGXX and SIGYY components change while the VONMISES component, as expected, does not change. Such a transformation will not have any effect on the principal stresses either. The transformation is performed for the current set only (if any) and is valid for all stress components in all positions and for all relevant attributes. Note: The transformation of stresses is only performed when presenting results. The underlying data are not transformed. Scanning and combining result cases will thus always be performed based on the untransformed stresses. This means that you cannot first transform stresses and then scan for the highest stress in a rotated direction. Xtract 3-30 Sesam 1-FEB-2011 3.28 Figure 3.28 Stresses before transformation 3.29 Figure 3.29 Stresses after transformation Program version 3.0 Sesam Program version 3.0 Xtract 1-FEB-2011 3-31 3.1.20 Setting Contours When presenting results Xtract will by default display 10 equidistant contours (levels) between the minimum and maximum values using filled contours. This setting may be modified through: Results > Settings (or click the tool button touring modes, see Figure 3.30 ), clicking the Contours tab and selecting among four con- 3.30 Figure 3.30 Result setting – Contours The four contouring modes are: • Datum mode for setting a certain contour value (datum) and either a step value or a number of levels below and above this datum. • Levels mode for setting number of equidistant levels. • Values mode for setting all levels explicitly. Areas with values above the maximum are violet and below the minimum are pink. • Min-max mode for setting minimum and maximum values and in between these either a step value or a number of levels. Areas with values above the maximum are violet and below the minimum are pink. If result values are shown then only labels for values within the min-max range will appear. Xtract Sesam 3-32 1-FEB-2011 Program version 3.0 In addition to the contouring modes you may select Contour type Lines in addition to the default type Filled. Lines may be the preferred alternative for creating black & white plots, see Section 3.1.26. The colour lines will in black & white mode change to black lines annotated by characters. Figure 3.31 shows an example of use Values mode. Notice that the Database dockable window has been torn loose to increase the display area. Also notice that perspective view has been switched off by Display > Perspective view (or clicking the tool button ). 3.31 Tool buttons for displaying sets Min, Max and legend values are limited to current set when selecting component Figure 3.31 Setting contours and undocking database window 3.1.21 Unit Conversion Convert from one set of length and force units to another through Model > Unit conversion The dialog shown to the left in Figure 3.32 appears. Specify the current (On file) and desired (Display) units for Length and Force and click Apply. (The current units must be specified since the results file does not contain such information.) The database then automatically closes and you must reopen the results file and reselect the model as well as the result case and component. You basically need to restart your session. The reason for this procedure is that all data are converted from the current to the desired units at the opening stage of the results file. This ensures that all data are properly converted. When presenting results after the conversion the new units are shown in the Info box as shown to the right in Figure 3.32. Sesam Program version 3.0 Xtract 1-FEB-2011 3-33 3.32 Clicking Apply in the Unit conversion dialog causes closing of the database and you must reopen the results file and reselect the model. Note that the Info boxTool buttons for displaying sets in the lower right corner now specifies the new units. Figure 3.32 Unit conversion Note: The unit of mass is a consequence of the length and force units and is therefore not given. Note: The unit of rotational displacements is always radians and cannot be converted. Note: Unit conversion cannot be done for results fetched from a VTF-file, i.e. results from programs like Wasim, Installjac, Riflex and Stofat. 3.1.22 Sets Sets stored on the results file (i.e. defined in the preprocessor) may be displayed in Xtract. New sets may also be defined. Note: A set may only contain elements. I.e. a set cannot contain nodes. Click the Sets tab of the Database window and find all sets listed. Double-click a set to display it, see Figure 3.33. Alternatively, merely click a set and hit Return. Notice that selecting a set lifts the tool button for Set > Show both ( – red/green) and depresses the tool button for Set > Show working set ( – no-colour/ green). Give Set > Show complement (or click the tool button – red/no-colour) to display the complement of the current set. Notice that a check mark indicates the current set in the browser. When selecting a set (or its complement or both) the currently selected result component is automatically reloaded so that the results range (min and max values) is limited to the displayed part of the model. Xtract 3-34 Sesam 1-FEB-2011 Program version 3.0 3.33 Figure 3.33 Double-click a set to display it – or click and hit Return Select two or more sets by clicking one set and Ctrl+clicking and/or Shift+clicking more sets and concluding the selection by hitting Return. Figure 3.34 shows an example for a superelement model. Notice that the sets are sorted alphabetically superelement by superelement. 3.34 Figure 3.34 Select multiple sets by clicking and hitting Return – sets are sorted alphabetically How to define a new set, modify it and finally revert to the complete model is done as follows: • Set > New The new set appears in the list of sets with a default name. Sesam Program version 3.0 Xtract 1-FEB-2011 3-35 • Set > Name (or right-click the new set) In the Name and description of set dialog enter the desired information and click OK. • Give the set content (fill it with elements) by Set > Union (or right-click the set) and select an alternative: — Existing set – set stored on the results file or previously defined in Xtract — Element type – elements of a given element type — Material type – elements having a given material type — Elements – single element number or range of element numbers — Beam cross section – beam elements having a given cross section — Model – all elements of a given superelement — Shell thickness – plate/shell elements with thickness within a specified range — Coordinate ranges – elements within specified coordinate ranges — Result values – elements containing result values within a specified range — Top/Bottom/Right/Left – use the left mouse button to drag a line across the model and all elements completely above/below/to the right of/to the left of the line are put into the set — Rubberband – use the left mouse button to drag a rubberband (rectangle) over the model, all elements completely inside the rubberband are put into the set — Polygon – use the left mouse button to make a polygon, close it by either clicking the first point or hitting the space key (the Delete key removes the last point while right-click and Esc aborts the operation), all elements completely inside the polygon are put into the set The upper part of Figure 3.35 illustrates how the rubberband option is used to create a set containing elements in the vicinity of the upper part of the bracket. • Modify the content of the set by: — Set > Subtract by — Set > Intersect with The lower part of Figure 3.35 is the result of the following action: Set > Subtract by > Element type. In the Select list item dialog appearing you may select item BTSS (23) (the name of the 3 node beam element) to subtract beam elements leaving only 8 node shell elements (SCQS (28)) in the set. • You may also add and remove single elements: — Set > Pick to add – the complement is shown allowing you to click elements to add to the set, when done leave the picking mode by giving Set > Pick to add once more and see the set by clicking — Set > Pick to remove – click elements to remove from the set, when done leave the picking mode by giving Set > Pick to remove once more • You may modify the way the graphical means for modifying a set (options Top, Bottom, Right, Left, Rubberband and Polygon) works by: — Set > Select outside/opposite – this allows you to select elements outside an area defined by Rubberband and Polygon (it is less relevant for Top, Bottom, Right, Left as it merely exchanges the functionalities of Top and Bottom and likewise for Right and Left) Xtract 3-36 Sesam 1-FEB-2011 Program version 3.0 — Set > Include touched by – in addition to elements completely above/below/to the right of/to the left of a line and completely inside a rubberband/polygon also elements touched by the line/rubberband/ polygon are selected The ‘Select outside/opposite’ and ‘Include touched by’ are options that are switched on and off as needed. These two options may also be used in combination. • Having created a set you may add it to, subtract it from and intersect it with a previously defined set by: — Set > Add elements shown to existing set – the current set is added to another set, i.e. the other set is modified — Set > Subtract elements shown from existing set – the current set is subtracted from another set, i.e. the other set is modified — Set > Intersect elements shown with existing set – the current set is intersected with another set, i.e. the other set is modified • See the position of the current set in the whole model by: — Set > Show rest of model as wire-frame – this adds the mesh of the whole model in dashed wireframe mode • Return to displaying the complete model by either of the following: — Set > Show both – the set is still active but both the set and its complement are shown — Set > Cancel – all sets are made inactive involving that the whole model is shown You may list the elements contained in a set or the nodes of these elements by Model > List model data. Use Set > Delete or right-click a set to delete it. Note: When viewing a set the nodal averaging of stresses (all stresses in position Nodes) will not account for elements not included in the set. Nodal stresses on the edge of a set may therefore differ from the values presented for the whole model (or another set). See Figure 3.36. Note: When using graphical means for modifying a set (options Top, Bottom, Right, Left, Rubberband, Polygon and picking one at a time by clicking) then avoid using a deformed shape of the model since the graphical selection operates on the undeformed model display. Sesam Xtract Program version 3.0 1-FEB-2011 3-37 Modify set: remove beams (BTSS) Create a set 3.35 Figure 3.35 Create (Union with) and modify (Subtract by) a set Xtract 3-38 Sesam 1-FEB-2011 Program version 3.0 3.36 The nodal average value for the set is 10.9601. A set The value in the same node for the whole model differs and is 10.8918. The whole model Figure 3.36 Nodal stresses on the edge of a set may differ from those of the whole model 3.1.23 Multiple Viewports The display area may be split into multiple viewports. The alternatives are two vertical, two horizontal and four viewports. These viewports function as independent areas for displaying the model with results. Split into four viewports by: Display > Viewports > Four (or Ctrl+4) The current display will be put into the upper left viewport. Click another viewport to make it active. The active window is framed by a green line (the lower right in Figure 3.37). Copy from a selected viewport to the active one by: Display > Copy visual attributes > From viewport i – this copies result case, component, display settings and result settings, i.e. everything except the model, from viewport i Sesam Xtract Program version 3.0 1-FEB-2011 3-39 Display > Copy all > From viewport i – this copies also the model, i.e. everything, from viewport i You may grab the corner between four viewports or the line between two viewports and adjust their sizes. Figure 3.37 shows an example of four viewports. Notice that the viewport number is given in the Info box. 3.37 Figure 3.37 Multiple viewports Note: The dialog for saving the graphics (File > Plot) has an option ‘Plot all visible views’. When not checked then only the active viewport is saved. Note: ‘Edit > Copy view to clipboard’ saves the active viewport to the clipboard while ‘Edit > Copy visible views to clipboard’ saves all viewports to the clipboard. When displaying the same model/set then navigate (rotate/zoom) synchronously all 2/4 viewports by: Display > Synchronous navigation Return to a single viewport by (the active one of the four viewports will be shown): Display > Viewports > One (or Ctrl+1) When returning from four to two viewports (Ctrl+2 or Ctrl+3) then the active and previously active viewports will be shown. Xtract Sesam 3-40 1-FEB-2011 Program version 3.0 3.1.24 Adding Text and Pointers Add text and pointers to the display (for example in connection with producing plots for a report) by: Display > Draw toolbox In the Draw dialog there are tools for adding, moving and deleting text and pointers. See Figure 3.38. Positioning, moving and deleting texts and pointers are done by clicking at the start of the item. 3.38 Figure 3.38 Adding text and pointers Note: If you have added text and pointers as shown in Figure 3.38 and when plotting you set the plot size (see Section 3.1.26) then be aware of that the text strings and pointers may shift somewhat. A pointer may then not be positioned exactly as intended. 3.1.25 Display Settings, Labelling, Part Attributes and Information By: Display > Settings (see Display settings dialog in Figure 3.39) you can change the number of significant digits to be used in result presentation, adjust the element shrink factor (Display > Shrunken elements), set the font size for all text in the display, change the colour used for Sesam Program version 3.0 Xtract 1-FEB-2011 3-41 undeformed wireframe mesh (Model > Add undeformed wireframe) as well as change the background of the viewport. (Click a colour box to change colour.) Check the Top and bottom box to make the background a smooth vertical transition from one colour to another as shown in Figure 3.39. 3.39 Figure 3.39 Adding local coordinate axes and labels, changing background and more Note: You don’t need to set the background to white for plotting purposes as exporting graphics (saving a plot file) with white background may be chosen in the save image process (see Section 3.1.26). You can add node and element numbers as well as element local coordinate systems by: Display > Labeling (see Labeling dialog in Figure 3.39) A maximum of 10.000 labels (node or element numbers as well as result values) will be shown by default. (This limit which is higher than any practical use is only to avoid Xtract hanging while cluttering the screen with labels for a very big model.) The Labeling dialog allows you to adjust this maximum number or to allow all labels to be shown. Notice that the Info box in the lower right corner tells whether there currently is a limit to the number of labels shown. The Draw background box option allows switching on/off the light background box of the numeric values. See Figure 3.7. Xtract 3-42 Sesam 1-FEB-2011 Program version 3.0 Note: Labels (result values, principal stress vectors, etc.) are lifted towards the eye in order not to be hidden by the model itself. But in certain cases labels may still be partly hidden. Labels may then be lifted more by the Lift factor in the Labeling dialog. Note: When beams are shown expanded (showing cross sections) labels along the beams will easily be hidden inside the beams. Apart from switching off the expansion (see below) you can make the labels visible by lifting them more. Check the Auto apply for Lift factor and use the spin button to increase the factor until all labels are visible. Note: Some of the settings of the Display settings and Labeling dialogs are stored in the user registry. This involves that these settings are stored when exiting Xtract and they take effect when restarting the program with the same user and PC. Briefly, these are: number of significant digits, element shrink factor, font size, background colour, label background box shown or not and SCANINDEX options. See more detailed information in Section 4.1.3. In addition to the above, nodes and elements may be labelled individually by graphic means. The element and node numbers are accompanied by result values depending on the setting of ‘Results > Show result values in labels’. See Section 3.1.12 about showing result values for selected elements and nodes. Shift+Ctrl+LMB for the first click and LMB thereafter toggles labels for element numbers Ctrl+LMB for the first click and LMB thereafter toggles labels for node numbers Note: When toggling node and element numbers you must click inside the model. E.g. to label a node on an edge you cannot click outside the model no matter how close to the node you click. To remove all element/node labels give: Results > Clear selected elements/nodes Show shell/plate thicknesses by colours as exemplified in Figure 3.40 by: Display > Show plate thickness Show material types by colours by: Display > Show materials Sesam Xtract Program version 3.0 1-FEB-2011 3-43 3.40 Figure 3.40 Showing plate thicknesses Beam elements are by default expanded (shown with their cross sections). You can switch off expansion by: Display > Part attributes – the Expanded option (see Part attributes dialog in Figure 3.41) or for all superelements (parts) by the tool button . In addition to controlling expansion of beam elements the Part attributes dialog controls several other display settings for superelements (parts) individually. For example, the various display alternatives Show as surface, Show mesh, etc. that are set for the whole model by the tool buttons, , , etc. may be set for individual superelements through the Draw style alternatives of the Part attributes dialog. Moreover, the following settings are controlled (first select superelements by click, Shift+click and Ctrl+click and then check/uncheck the options): • Visible – When unchecked the superelement (part) will not be visible. • Smooth – Shading will be smooth. • Deformed – Superelement (part) will be shown deformed. • Contours – The current results component will be contoured. • Vectors – Present deformation (DISPLACEMENT/ALL) as vectors. Xtract 3-44 Sesam 1-FEB-2011 Program version 3.0 • Mesh – Display the mesh. • Outline mesh – Outline the mesh. • Expanded – Present beam elements with their sections and in their eccentric (offset) positions. • Transparent – Display the superelement (part) transparent. Transparency Alpha value is set in the lower right corner: 0 is fully transparent (invisible), 255 is opaque. The Contours option must be switched off. An example in which one of three superelements has been made transparent (and Contours and Mesh switched off) is shown in Figure 3.41. (A superelement model is shown instead of the single superelement model of this tutorial to show how display settings are given for superelements individually.) 3.41 Figure 3.41 Part attributes The content of the Info box in the lower right corner may be modified and removed altogether. Moreover, the navigation cube in the lower left corner may be replaced by a more traditional model coordinate system, or if both are switched on the traditional model coordinate system will be in the lower left and the navigation cube in the upper right corner. Finally, the coordinate axes drawn in the origin and the legend may be added and removed. These manipulations are available through: Sesam Program version 3.0 Xtract 1-FEB-2011 3-45 Display > Information Figure 3.42 shows the options in the Display information dialog and explains all possible information provided by the Info box. Note: In addition to the Legend check box in the Display information dialog (which is equivalent to the line-mode command ‘displayinfo legend’) there is a line-mode command ‘displayinfo superelementlegend’ that switches on and off the legend for the superelement colours. This is relevant when showing the model with no results in which case the superelement colour legend appears by default. 3.42 Figure 3.42 Display information Xtract 3-46 Sesam 1-FEB-2011 Program version 3.0 3.1.26 Making Plots/Hard Copies and Adding Graphics to Reports There are alternative ways of printing/saving graphics created in Xtract: • File > Print (or click the print tool button directly to an on-line printer) or Ctrl+P) – for printing the active viewport (send it • Edit > Copy view to clipboard (or click the camera tool button viewport to the clipboard for subsequent pasting into a report or Ctrl+C) – for copying the active • Edit > Copy visible views to clipboard – for copying all viewports to the clipboard • File > Plot (or click the save tool button or Ctrl+S) – for saving to file with a chosen graphics format, only the active viewport is saved unless the ‘Plot all visible views’ option is checked, see Figure 3.43 Note: As an alternative to printing/saving graphics for manual inclusion in a report Xtract also offers automated report generation through the program Xtract Report Builder. Read more about this in Section 3.13.3. When printing directly and copying to clipboard increase the quality (resolution) by maximising the Xtract window and maybe also closing down the Database and Command and message windows; see Figure 3.2. File > Plot opens the Save image dialog, see Figure 3.43. A choice of graphics formats are available: • The GIF format which requires limited disk space (typically less than 10 percent of TIFF and BMP) and may be imported into word processors, presentation tools, HTML files (for viewing by web browsers), XML files and other. This is the best format for normal work. • The TIFF format which represents colours and colour shading better than GIF but requires more disk space (about the same as BMP). It may be imported into word processors but it is not supported by web browsers. • The Windows BMP format which gives large files (1 - 10 MB depending on the X size and Y size; see below) but after import into Word the document size does not increase correspondingly (Word compresses the file). The quality is somewhat better than GIF as there is no compression involved. • The EPS format – this format is less suitable as the pixel-based display of Xtract is unsuitable for translation into the vector based Encapsulated PostScript format. • The PPM format – this Portable Pixmap format is less suitable for normal work. • The RGB format is less suitable for normal work. Note: When the slight quality reduction of the compressed GIF-file is unacceptable consider using the Edit > Copy alternative rather than saving a BMP-file for pasting graphics into a report. The size (resolution) given in pixels of the image saved is by default equal to the display area (which may be increased by maximising the Xtract window and closing down the Database and Command and message windows; see Figure 3.2). Increase the X size (horizontal) and Y size (vertical) to increase the resolution and thereby the quality of the plot. Suitable values for X size and Y size are in the range 500 - 2000, the upper end of the range gives high quality plots. Sesam Xtract Program version 3.0 1-FEB-2011 3-47 The Save image dialog includes a field for entering a File name. By default this will be Xtract001 and after saving a plot file (clicking Apply) the name will be incremented to Xtract002, Xtract003, etc. This feature simplifies producing several plot files for reporting purposes. If you enter another name, say Bracket1, the name will be incremented to Bracket2, Bracket3, etc. A name without counter, say Abc, will after clicking Apply be ‘incremented’ to Abc001. Closing the Save image dialog resets the File name to Xtract001 (next time the dialog is opened). The Save image dialog includes Header and Footer fields for text strings to be reproduced at the top and bottom of the plot image. The font size of the header and footer is somewhat lager than other text and if the font size is increased (see Section 3.1.25) then the header and footer are increased proportionally. The header and footer may be left, centre and right adjusted. 3.43 Checking the ‘Plot all visible views’ option disables Header and Footer Figure 3.43 Plotting – Save image Note: If you have added text and pointers (see Figure 3.38) then a setting of the plot size should approximately maintain the width over height quotient of the display area or else the text and pointer positioning may not be as intended. For either of the alternatives for printing/saving graphics (File > Print, Edit > Copy view to clipboard, Edit > Copy visible views to clipboard and File > Plot) a dialog appears: Export View Mode. Hitting Return accepts the default mode: exporting colours with white background and black text. Alternatively you may choose black & white mode and ‘as is’, i.e. as appearing on the screen. See Figure 3.44. Note: The tool button offers a preview of the graphics exported in black & white mode. This is a preview only and not a working mode. I.e. when selecting a new results component colours will reappear in an imperfect manner. Click once more to return to normal colour mode. Xtract 3-48 Sesam 1-FEB-2011 Program version 3.0 3.44 Figure 3.44 Export View Mode dialog 3.2 Structural Analysis Results In the general case structural analysis results are organised as follows: • Run numbers • Each run number contains a number of result cases • And finally, each result case contains a number of occurrences The run and occurrence numbers are normally irrelevant for a plain static analysis. Such an analysis will include a number of result cases under which all results data are found. Section 3.3 explains the meaning of the run and occurrence numbers and in which cases these are relevant. The results data under each run number, result case and occurrence are organised in a hierarchical manner: • Result position (Nodes, Elements, Element average, Resultpoints and Surface resultpoints) • Result attribute (DISPLACEMENT, G-STRESS, D-STRESS, …) • Result component (DISPLACEMENT ALL, DISPLACEMENT X, G-STRESS SIGXX, GSTRESS VONMISES, …) A particular (occurrence of a) result case will contain a subset of all possible sets of result positions, attributes and components depending on the type of analysis, type of element and other factors. The complete set of result positions and attributes is presented in the following. 3.2.1 Result Positions The result positions Nodes and Elements are both located in the nodes of the model. The values in position Nodes are the averaged values of adjoining elements. More specifically, the values in position Elements as Sesam Xtract Program version 3.0 1-FEB-2011 3-49 illustrated for the 8 node shell element in Figure 3.54. The values in position Element average are the averages within each element (of the values in position Elements), i.e. a single value for each element. The Resultpoints and Surface resultpoints positions are found inside the elements as illustrated for the most common elements in Figure 3.45 through Figure 3.56. The sketches also show the Resultpoint numbering as appearing in Xtract. The Sestra user manual contains more information on the elements. 3.45 Figure 3.45 Resultpoints for 2 node beam element (BEAS) 3.46 Figure 3.46 Resultpoints for 3 node beam element (BTSS) 3.47 Figure 3.47 Resultpoints for 3 node membrane element (CSTA) Xtract 3-50 Sesam 1-FEB-2011 Program version 3.0 3.48 Figure 3.48 Resultpoints for 4 node membrane element (LQUA) 3.49 Figure 3.49 Resultpoints for 6 node membrane element (ILST) 3.50 Figure 3.50 Resultpoints for 8 node membrane element (IQQE) Sesam Xtract Program version 3.0 1-FEB-2011 3.51 Figure 3.51 Resultpoints for 3 node shell element (FTRS and FTAS) 3.52 Figure 3.52 Resultpoints for 4 node shell element (FQUS and FQAS) 3-51 Xtract 3-52 Sesam 1-FEB-2011 Program version 3.0 3.53 Figure 3.53 Resultpoints for 6 node shell element (SCTS) 3.54 Figure 3.54 Resultpoints and Surface resultpoints for 8 node shell element (SCQS) Sesam Program version 3.0 Xtract 1-FEB-2011 3.55 Figure 3.55 Resultpoints for 8 node solid element (LHEX) 3.56 Figure 3.56 Resultpoints for 20 node solid element (IHEX) 3-53 Xtract Sesam 3-54 1-FEB-2011 Program version 3.0 The result attributes contained in the various result positions are shown in Table 3.1 and briefly described below. The components contained in each result attribute are explained in Appendix B 2. Table 3.1 Result positions and attributes versus element types Attributes Element type Position Nodes DISPLACEMENT GPPMVELOC. & ACCEL. STRESS STRESS STRESS REACTION-FORCE Elements Element average Resultpoints SURFACELOADS 2 & 3 node Elements beam Element average Resultpoints Elements a Element average a Resultpoints a Nodes a Nodes a Elements a 6 & 8 node Element average a shell Resultpoints a Surface resultpoints a Nodes 3 & 4 node membrane Elements 6 & 8 node Element average membrane Resultpoints 3 node shell 4 node shell DRBSTRESS STRESS STRESS Truss Nodes GFORCE Sesam Xtract Program version 3.0 1-FEB-2011 3-55 Table 3.1 Result positions and attributes versus element types Attributes Element type Position DISPLACEMENT GPPMVELOC. & ACCEL. STRESS STRESS STRESS REACTION-FORCE Nodes b c Elements b c 6 & 8 node Element average b c layered shell Resultpoints b c DRBSTRESS STRESS STRESS Surface resultpoints b c SURFACELOADS Elements Element average Resultpoints Nodes Solid elements GFORCE a. Two tick marks imply that the attribute is available in upper and lower surfaces. b. Three tick marks imply that the attribute is available in all layers. c. Four tick marks imply that the attribute is available in upper and lower surfaces of all layers. Result Position: Nodes The attributes available in the nodes are: • Nodal displacements (DISPLACEMENT) • Nodal velocities and accelerations if relevant (VELOCITY and ACCELERATION) • Reaction forces in fixed and prescribed nodes (REACTION-FORCE) • Nodal stresses averaged between adjoining elements, these are available in the form of: — General stresses (G-STRESS) — Principal stresses (P-STRESS) — Principal membrane stresses (PM-STRESS) — Decomposed stresses (D-STRESS) – general stresses decomposed into membrane and bending parts — Stress resultants (R-STRESS) – general stresses integrated through the shell/membrane thickness Averaging of stresses between adjoining elements (i.e. coupled to a common node) is performed only for those of any number of elements for which all of the following conditions are fulfilled: Xtract 3-56 Sesam 1-FEB-2011 Program version 3.0 • The element coordinate systems do not deviate more than 5 degrees (a default value adjusted by Results > Settings, the Misc tab). • The element thicknesses do not deviate more than 10% (a default value adjusted by Result > Settings, Misc tab). • The material type is the same. This implies that: • An element with an element coordinate system deviating more than 5 degrees compared with all its neighbour elements will have nodal stresses equal to the element stresses. • For a node on the intersection line between two intersecting plates where 8 plate elements meet two average values will be computed: one value for the four coplanar elements of one of the plates and another value for the four coplanar elements of the other plate. Note: For shell elements some of the stresses are strictly not positioned in the nodes: While the nodes are located in the middle surface of the shell the stresses are available for the upper and lower surfaces (in the nodes projected onto the surfaces). Note: A change in stress from one element to the next may be caused by a concentrated force or a line/surface load acting at the border between the elements. In such cases the averaging performed by Xtract will be incorrect. Note: When viewing a set the nodal averaging will not account for elements not included in the set. Nodal stresses on the edge of a set being a cut-out of a plate/shell will thus be incorrect. Result Position: Elements The attributes available in the nodes of the individual elements are: • Beam forces and moments (G-FORCE) – more precisely the position is in the beam ends, see note below • Beam stresses (B-STRESS) – G-FORCE components divided by area and minimum section moduli • Stresses extrapolated from the result points to the element nodes and pertaining to the individual elements (i.e. no averaging between adjoining elements), these are available in the form of: — General stresses (G-STRESS) — Principal stresses (P-STRESS) — Principal membrane stresses (PM-STRESS) — Decomposed stresses (D-STRESS) – general stresses decomposed into membrane and bending parts — Stress resultants (R-STRESS) – general stresses integrated through the shell/membrane thickness • Surface loads (SURFACE-LOADS) – normal pressure loads (positive when pointing in the direction of the element z-axis for plate/shell elements, positive when pointing into volume elements) Sesam Program version 3.0 Xtract 1-FEB-2011 3-57 Note: For shell elements some of the stresses are strictly not positioned in the nodes: While the nodes are located in the middle surface of the shell the stresses are available for the upper and lower surfaces (in the nodes projected onto the surfaces). Note: The G-FORCE attribute is positioned in the beam ends rather than in the nodes. This has significance for beam elements with eccentricities. Result Position: Element average The attributes available as average values in the midpoints of the elements are: • Beam forces and moments (G-FORCE) • Beam stresses (B-STRESS) – G-FORCE components divided by area and minimum section moduli • Stresses available in the form of: — General stresses (G-STRESS) — Principal stresses (P-STRESS) — Principal membrane stresses (PM-STRESS) — Decomposed stresses (D-STRESS) – general stresses decomposed into membrane and bending parts — Stress resultants (R-STRESS) – general stresses integrated through the shell/membrane thickness Note: For shell elements some of the stresses are positioned in the upper and lower surfaces at the midpoint. Result Position: Resultpoints These are the points in which the results are found on the results file, the location of these points depends on the type of element. The attributes available are: • Beam/truss forces and moments (G-FORCE) – these are the forces computed by the analysis program • Stresses in the form of: — General stresses (G-STRESS) – these are the stress components computed by the analysis program (except for the VONMISES component which is based on the other components) — Principal stresses (P-STRESS) — Decomposed stresses (D-STRESS) – general stresses decomposed into membrane and bending parts, relevant for 3 and 4 node shell elements (for 6 and 8 node shell elements these stresses are available under Surface resultpoints). The term ‘Resultpoints’ is somewhat misleading as the D-STRESS attribute relates to a line through the shell thickness in the position of the result points rather than to the individual result points. Note: For the result points of 6 and 8 node shell elements the choice between the upper and lower surfaces (see Section 3.2.2) has a modified meaning: rather than meaning the upper and lower external shell surfaces they mean the result point closest to the given surface. Confer the section Result Position: Surface Resultpoints below. Xtract 3-58 Sesam 1-FEB-2011 Program version 3.0 Result Position: Surface Resultpoints This position is available for 6 and 8 node shell elements only. These elements have their result points located inside the elements in the thickness direction. The surface result points are therefore the result points extrapolated to the upper and lower shell surfaces. The attributes available are: • Stresses in the form of: — General stresses (G-STRESS) — Principal stresses (P-STRESS) — Decomposed stresses (D-STRESS) – general stresses decomposed into membrane and bending parts. The term ‘Surface resultpoints’ is somewhat misleading as the D-STRESS attribute relates to a line through the shell thickness in the position of the surface result points rather than to the individual surface result points. 3.2.2 Upper and Lower Surfaces For plate/shell elements there is a concept of upper and lower surfaces. When presenting for example Elements/G-STRESS/SIGXX (position/attribute/component) the upper surface is selected by default. The upper surface is the one on the positive local z-side, see Figure 3.54. Switch between the upper and lower surfaces by: Results > Shell surface and layer Which surface is currently selected is stated in the Info box. 3.3 Hierarchical Organization of Results Rather than having a plain and flat list of result cases the results are organised in a hierarchical manner: a run number contains a number of result cases which in turn contain a number of occurrences. This is a practical way of organising results, particularly results from a dynamic analysis. See Section 3.16.2 for how to refer to a result case. 3.3.1 Run Number The run number is used to separate logically independent sets of results. Combinations, scan result cases and scaled complex result cases created in Xtract are stored in a run ‘number’ termed User1. In most cases this will be the only other run number than run number 1 in which all result cases of the results file are organised. In certain cases, however, there will be additional run numbers on the results file: 1. In Xtract’s database the run number 9999 is used even though it appears as ‘User’. When making combinations in Prepost the run number 9999 should therefore be avoided. Sesam Program version 3.0 Xtract 1-FEB-2011 3-59 • Results files produced by separate analyses (runs) of (more or less) the same model may be merged into a single results file using the auxiliary program Prepost. The run number (1, 2, …) will identify the separate analyses. • In a forced dynamic analysis (frequency or time domain) using the Modal Superposition method the mode shapes (eigenvectors) may optionally be stored on the results file (i.e. they are retracked together with the dynamic forced response analysis results – see the Sestra User Manual about this). In such case the mode shapes will belong to run number 1 and the forced response results will belong to run number 2. • The auxiliary program Prepost may be used to create combinations that are stored on the results file. Such combinations may be given any run number. Note: Even when there is only one run number the command log and correspondingly the Command input file must always include the run number (which will be 1). 3.3.2 Result Cases and Occurrences The result cases and occurrences are used to logically organize the results. Logically related results are grouped as occurrences under the same result case. Here is an overview of how the result cases and occurrences are employed: • For a static analysis the result cases correspond to the load cases (load vectors) for which the model was analysed. There will be only one occurrence per result case so the occurrence may be neglected. • For a free vibration (eigenvalue) analysis the modes shapes are organised as occurrences under a single result case. • For a frequency domain analysis, whether it be a quasi-static (neglecting dynamic effects) or true dynamic analysis, the excitation frequencies belonging to the same wave heading (wave direction) will be occurrences of the same result case. The wave headings (the LOHI commands in the Sestra input) will correspond to result cases. • For a time domain dynamic analysis the time steps belonging to the same load history will be occurrences of the same result case. The load histories (the LOHI commands in the Sestra input) will correspond to result cases. Note: Even when there is only one occurrence (in which case this bottom level of the results hierarchy may be neglected when using Xtract in GUI mode) the command log and correspondingly the Command input must always include the occurrence (which will be 1). 3.4 Postprocessing Complex (Frequency Domain) Results A frequency domain analysis produces complex results, i.e. the results are comprised of a real and an imaginary part. For example, in a certain point there are two numbers expressing the stress , real and imag, and to determine the stress we need to select a phase of the incoming wave, t, (a point of time) and then compute the stress according to the formula: = real cos t – imag sin t Xtract Sesam 3-60 1-FEB-2011 Program version 3.0 Computing the value of a component for a certain phase of the wave is termed evaluating the component. If you are unfamiliar with postprocessing complex results then go to Appendix B 5 for some basic theory on this subject. 3.4.1 Evaluating a Single Complex Resultcase When presenting a complex component (by double-clicking it) Xtract will automatically evaluate it for phase zero (t=0). At the same time the Complex evaluation dialog will appear, see Figure 3.57. You may then choose to evaluate the component for any specific phase by entering the phase, or using the slider, followed by clicking Apply. In addition, the Complex evaluation dialog has the following alternatives for evaluating a component depending on whether it is harmonic or not: • For all harmonic basic components (e.g. DISPLACEMENT X, G-STRESS SIGXX, G-FORCE NXX, etc.): — Real (R), corresponding to phase = 0 — Imaginary (I), corresponding to phase = 270 (or 90) — Magnitude = SQRT(R2 + I2), the maximum value of the component through the cycle — Phase shift = ATAN(I/R), the phase lag between the wave and the component (entering the negative phase shift for phase yields a value of the component equal to the magnitude) — Give phase in degrees, the phase of the incoming wave (for wave loading produced by Wajac, Wadam and Wasim phase = 0 corresponds to the crest of the wave being in X=0, Y=0) • For non-harmonic components (VONMISES, P1, P2 and P3): — Give phase, the phase of the incoming wave — Maximum through cycle, the maximum is found by stepping through the cycle (360 degrees) at a 10 degree interval (a default value that may be modified by Results > Settings, the Misc tab) — Phase angle (in degrees) of maximum, the angle found by the stepping procedure described above 3.57 Figure 3.57 The Complex evaluation dialog The displacement (Nodes/DISPLACEMENT/ALL) deviates from the harmonic components in that the Phase shift is unavailable. This is because the displacement will always be a positive value and therefore not Sesam Program version 3.0 Xtract 1-FEB-2011 3-61 a normal harmonic component for which a phase shift may be found by atan(I/R). (The displacement forms an ellipse in space.) Note: Deformed model is available only when the evaluation is performed for a specific phase, i.e. Real, Imaginary and given phase. This is because the Magnitude and Maximum alternatives involve having a phase varying over the model. Figure 3.58 explains the information provided by the Info box for a complex result case. 3.58 Figure 3.58 The Info box content for a complex result case 3.4.2 Combining a Complex Resultcase with Static Resultcases When creating a combination involving complex results only a single complex result case is allowed. (See Appendix B 5.2 for an explanation of this limitation which is introduced to prevent the user creating meaningless combinations.) The single complex result case may be combined with any number of static (noncomplex) result cases. Combining (adding with scaling factors) result cases is done through: Results > Combine (or click the tool button ) The Combine dialog, see Figure 3.59, appears in which a single complex Source result cases is transferred to the Combination result cases list box. Subsequent to this any number of static (non-complex) Source result cases may be transferred. Select result cases in the Combination result cases list box and adjust the Scaling factor (default 1), give the combination a name and click Apply. Xtract Sesam 3-62 1-FEB-2011 Program version 3.0 3.59 Figure 3.59 The Combine dialog for complex results For the complex Source result case a method for Evaluation of complex result case must be selected. The alternatives are: • True minimum of component • True maximum of component • Absolute minimum of component (the value, positive or negative, when the absolute value is minimum) • Absolute maximum of component (the value, positive or negative, when the absolute value is maximum) • Phase, selecting this option a phase (in degrees) must also be given Note: The true/absolute minimum/maximum of component above is found for the complex and static result cases combined as illustrated in Figure 3.60. See also Section B 5.2.5. The true/absolute minimum/maximum of a component are all found by stepping through the cycle (360 degrees) at a 10 degree interval (a default value that may be modified by Results > Settings, the Misc tab). The position/attribute/component in question appears in the lower right area of the Combine dialog. For the Phase option only position/attribute is relevant and appears in the Combine dialog. Sesam Program version 3.0 Xtract 1-FEB-2011 3-63 3.60 Figure 3.60 The various minima and maxima for a combination of a complex and a static result case Note: Specify the appropriate method for Evaluation of complex result case with the complex result case highlighted in the Source result cases list box (prior to transferring it) or in the Combination result cases list box (after transferring it). You may change the evaluation method at any time until clicking Apply. Note: You may select and transfer two or more Source result cases at the time (but only one of them may be complex). Note: You may select and change Scaling factor for two or more Combination result cases at the time. Note: The combination is established for the result position and attribute (and all components of the attribute) highlighted in the database window and given in the lower right in the Combine dialog. The searching for true/absolute minimum/maximum is performed for the given component. Change result position/attribute/component by selecting (single-click to highlight) the appropriate component and return to the Combine dialog. The new result position/attribute/ component will then be given in the Combine dialog. Note: When establishing the combination for all available results (all attributes of all positions) by checking the All results option in the Combine dialog then evaluation for a specific phase only is allowed. Other choices are therefore greyed out. This is because an evaluation for maximum and minimum would give different phases for all positions/attributes/components. Note: You cannot expand a combination including a complex result case with another attribute (as you can for other combinations by the line-mode command ‘combine add’). This is essentially for the same reason as in the previous note: The combination was formed by a complex evaluation which is valid only for the selected attribute/component. Note: Deformed model is available (or meaningful) for a combination including a complex result case only when it is evaluated for a specific phase (not true/absolute minimum/maximum) and when the combination includes nodal displacements. Combinations are put in a Run named User (see Section 3.3.1 for an explanation of the concept of Run numbers). To select the combination you therefore need to select the Run named User, see Figure 3.24, thereafter select the relevant Result case (i.e. combination name) and finally double-click the desired component. Xtract 3-64 Sesam 1-FEB-2011 Program version 3.0 Click the Info button to get information on a combination. Delete a combination by the line-mode command: result deletecase name-of-case Note: Do not delete a combination that is referred to by another combination or scan result case as this may lead to inconsistency. 3.4.3 Scanning Complex Resultcases Scanning for the maximum or minimum (absolute) value of a component may be performed for any number of (scaled) complex and static (non-complex) result cases by: Results > Scan (or click the tool button ) The Scan dialog, see Figure 3.61, appears in which Source result cases are transferred to the Selected source result cases list box. Select result cases in the Selected source result cases list box and take two actions: (1) adjust the Scaling factor (default 1) and (2) select a method for Evaluation of complex result case (normally you want the same evaluation method for all result cases). The alternatives are: • Scan criterion, this involves that the complex result case is evaluated for the phase giving (absolute) maximum/minimum value of the component in question according to the Scan criterion. The evaluation is performed by stepping through the cycle (360 degrees) at a 10 degree interval (a default value that may be modified by Results > Settings, the Misc tab). Scan criterion is normally the desired option. • Phase, selecting this option a phase (in degrees) must also be given. The specification of Scan criterion (in the lower left area of the dialog) is common for all complex and static result cases to be scanned. The alternatives are: • Max (Absolute), the (absolute, see Figure 3.60) maximum value of the component over all Selected source result cases is picked. • Min (Absolute), the (absolute, see Figure 3.60) minimum value of the component over all Selected source result cases is picked. Conclude by giving the scan result case a name and click Apply. Sesam Program version 3.0 Xtract 1-FEB-2011 3-65 3.61 Figure 3.61 The Scan dialog for complex result Note: You may select and transfer two or more Source result cases at the time. Note: You may select and change Scaling factor and Evaluation of complex result case for two or more Selected source result cases at the time. Note: The Scan criterion is common for all scanned result cases whereas the method for Evaluation of complex result case may in principle vary. Note: The scanning is performed for the result position/attribute/component highlighted in the database window and listed to the lower left in the Scan dialog. Change result position/attribute/ component by selecting (single-click to highlight) the appropriate one in the database window and return to the Scan dialog. The new result position/attribute/component will be listed in the Scan dialog. Note: Even though the scanning is performed for a specific component the scan result case will contain all components of the attribute in question. I.e. if you scan for Elements/G-STRESS/VONMISES then the scan result case will also contain SIGXX, SIGYY and TAUXY (assuming four node element). These other components are normally of little interest though. Note: The scan result case created will at any point in the model contain the (absolute) maximum/ minimum of the selected component over all selected (and scaled) result cases. Note: Deformed model for a scan result case is normally unavailable and meaningless. Xtract Sesam 3-66 1-FEB-2011 Program version 3.0 Scan result cases are put in a Run named User (see Section 3.3.1 for an explanation of the concept of Run numbers). To select the scan result case you therefore need to select the Run named User, thereafter select the relevant Result case (i.e. scan result case) and finally double-click the desired component. In addition to the attribute with components resulting from the scanning, the scan result case will contain an attribute named MISC which in turn contains the component SCANINDEX. Selecting (double-clicking) this component gives labels (text strings) for all scanned points that identify the result cases that ‘won’ the scanning. By default this label will include the full result case identification which typically may look like: Run 2, Result case 1, 3 Excit. freq. 5 Hz, phase 170 The text string of the SCANINDEX label may be adjusted and appended to the numeric display of results as shown in Figure 3.26. Click the Info button to get information on a scan result case. Delete a scan result case by the line-mode command: result deletecase name-of-case Note: Do not delete a scan result case that is referred to by another combination or scan result case as this may lead to inconsistency. 3.4.4 Scaling a Complex Resultcase A complex result case may be scaled resulting in a new complex result case through: Results > Scale complex result case The Scale complex result case dialog, see Figure 3.62, appears in which a single Complex result case with Scaling factor is specified. Give the new result case a name and click Apply. 3.62 Figure 3.62 The Scale complex result case dialog Scaled complex result cases are put in a Run named User (see Section 3.3.1 for an explanation of the concept of Run numbers). To select it you therefore need to select the Run named User, thereafter select the relevant Result case (i.e. scaled complex result case) and finally double-click the desired component. This is shown for combinations in Figure 3.24. Click the Info button to get information on a scaled complex result case. Delete a scaled complex result case by the line-mode command: result deletecase name-of-case Sesam Program version 3.0 Xtract 1-FEB-2011 3-67 Note: Do not delete a scaled complex result case that is referred to by combination or scan result case as this may lead to inconsistency. 3.4.5 Graphing Complex Resultcases Creating a graph for a complex resultcase is done in the same way as for a static (non-complex) resultcase, see Section 3.1.15. The complex result case is evaluated by the current (last used) evaluation method, see Section 3.4.1. 3.5 View Sections Any number of plane sections through the model may be defined by: Model > View section The View section dialog, see Figure 3.63, appears. Clicking Add automatically creates a plane through a point (Point in the plane) in the middle of the model (in the middle between the lowest and highest of each coordinate value) and with the normal vector [0 0 1] (pointing in the Z-direction). To see the plane switch to outline display of the model by: Display > Show as outline (or click the tool button ) Or you may switch off display of the model showing only the plane by: Display > Model 3.63 Figure 3.63 The View section dialog Note: Only nodal displacements, velocities and accelerations may be presented for a section. For other results the section will be presented in grey colour. Having checked the Auto apply box the section may be dragged through the model by the appropriate slider for the Point in plane. Note that if the normal vector is [0 0 1] changing the Z-coordinate only for the Point in the plane will have effect. 3.6 List Model and Results Data Model data in terms of nodal coordinates and element data may be listed (tabulated) by: Model > List model data Xtract 3-68 Sesam 1-FEB-2011 Program version 3.0 The List model data window, see Figure 3.64, appears. Select Elements or Nodes and click Reload to switch between the two. The data is limited to the currently shown set, if any. Click Save to file to save a file that may be viewed, printed or imported into spreadsheets. 3.64 Figure 3.64 The List model data window The currently displayed component may be listed (tabulated) by: Results > List results The List results data window, see Figure 3.65, appears. The results listed is limited to the current set, if any, and the selected resultpoints (Results > Settings, Misc tab). The data may be saved to a text file. Select and present (double-click) another component or result case followed by clicking Reload to list a new component or result case. 3.65 Figure 3.65 The List results data window Sesam Program version 3.0 Xtract 1-FEB-2011 3-69 In the List results data window click all or any of the boxes ‘All result cases’, ‘All components’ and ‘Coordinates (within 1st level superelement)’ followed by Reload to add more data to the table. In Figure 3.66 is shown an example of tabulating all components of the current attribute as well as the coordinates of the points of the results. 3.66 Figure 3.66 The List results data window with all components and coordinates added Note: The element nodal values as shown in Figure 3.65 and Figure 3.66 are tabulated for each element in a sequence corresponding to the sequence in which the nodes are listed in the table created by Model > List model data. Switch on labels showing the node numbers in the Labeling dialog (Display > Labeling) to see the position of each single value. For 4 node plate elements the node sequence is anticlockwise about the element z-axis. For 8 node shell elements the sequence is also anticlockwise but with corner nodes first followed by mid-side nodes. Note: In addition to the fact that the tabulated results are limited to the currently selected set you may limit the table further by Ctrl+LMB clicking nodes and Shift+Ctrl+LMB clicking elements as described in Section 3.1.12 followed by clicking Reload in the List results data window. Note: When tabulating averaged stresses in position Nodes and limiting the selection of elements by either selecting a set or Shift+Ctrl+LMB clicking elements then the tabulated stresses are averaged based on the selection only. This corresponds to the way results are presented graphically (by colours or numerical values) as shown in Figure 3.36. Xtract Sesam 3-70 3.7 1-FEB-2011 Program version 3.0 Animation An animation is showing how a selected result component changes (over time) with the deformation. The Animation menu provides animation for: • Mode shapes (and static results) • Frequency domain results • Time domain results (Result case animation) The procedure in all cases is to set up the animation for the appropriate component and thereafter to run the animation. Setting up involves first selecting and presenting (i.e. double-clicking) a component of the desired run number, result case and occurrence and thereafter selecting the appropriate Animation menu. The alternative animation setups are described in Section 3.7.1 through Section 3.7.3. Depending on the size of the model, the number of steps (frames) in the animation and the speed of your computer the setup may require some time. Selecting a part of the complete model, e.g. a lower level superelement or a set will speed up the setup of the animation. Upon completion of the setup the animation control buttons will be accessible (no longer grey), see Figure 3.67. 3.67 Figure 3.67 The animation control buttons Note: During an animation (without pausing it) the model may be manipulated (rotated, zoomed, panned, change to shrunken view, etc.) and the result settings may be changed (contour settings, etc.). Furthermore, existing sets may be retrieved and new sets may be defined. Note: During an animation the current frame (step) number is given in the lower left corner of the viewport. Note: During an animation you may slow down and, up to a limit decided by the capacity of your hardware, speed up an animation by Animation > Max FPS. In the dialog set the maximum number of frames to show per second. The default is 25. Save an animation to either of the formats: • AVI – for running an animation using a media player (e.g. Quick Time Player, RealOne Player and Windows Media Player) • Animated GIF – for running an animation through a web browser To save an animation stop it (to save all resources for the saving process) and do: Animation > Save animation Sesam Program version 3.0 Xtract 1-FEB-2011 3-71 In the Save animation dialog, see Figure 3.68, select File format and size, Frame options, give a Filename and click OK. The Frame options are: • Frame repeat – the number of times each frame of the animation is repeated • First frame repeat – number of repeats for the first frame (the animation stands still for a while in the beginning) • Last frame repeat – number of repeats for the last frame (the animation rests a while at the end) • Framerate – the target number of frames per second when played. To which degree this setting takes effect depends on the size of the animation in relation to the resources of your computer: Your computer may not be able to process the data quickly enough to play the animation at the desired speed. Or it will be too quick. In the latter case increasing the Frame repeat may help. Besides, this setting is disregarded by some media players. • Cycle animation – choose whether the animation is set to be run back and forth Note: Whether to run the animation once or repeatedly is determined by the media player. Which data to give for the options above depend on the speed at which you want the animation to run, the resources of your computer and the animation size. You may need to do some experimenting to find the values suitable for your case. 3.68 Figure 3.68 The Save animation dialog Having clicked OK in the Save animation dialog Xtract will spend some time creating a number of bitmap files (that are deleted once the saving process is complete). The Video compression dialog, see Figure 3.69, appears in which you need to choose a video compression algorithm. Which algorithm is available to you depends on software installed on your computer. The following compression algorithms have been tested and with given result: • Cinepak Codec by Radius, Compression quality 100 – very good playback quality • Microsoft Video 1, Compression quality 75 – lower playback quality for rich graphic information Xtract Sesam 3-72 1-FEB-2011 Program version 3.0 • Microsoft MPEG-4 Video Codec V2 – good playback quality, small animation file, incompatible with Quick Time Player (and RealOne Player?) Note: The size of the animation file and its quality (resolution) will depend on the video compressor. Note: You need to use a video compressor – do not use Full Frames (Uncompressed) – as the animation file will then easily become prohibitively large. Note: The temporary consumption of disk space during the saving process may be substantial: A bitmap file of size between 1 and 4 MB (depending on the display area size) will be created for each frame of the animation. The temporary disk consumption for saving a frequency animation with 10 degree stepping will thus be about 40 MB. Increasing the display area size and reducing the step size may demand several hundred MB of temporary disk space. 3.69 Figure 3.69 The Video compression dialog Having clicked OK in the Video compression dialog Xtract will be locked while the compression of all the temporary bitmap files into the animation file is being done. 3.7.1 Animating Mode Shapes (and Static Results) Having performed a free vibration (eigenvalue) analysis the results file will contain mode shapes stored as occurrences under a common result case. Prepare an animation by: Animation > Mode shape animation The Mode shape animation setup dialog, see Figure 3.70, appears. Set the desired Number of frames, i.e. the number of steps through a cycle (360º) and click OK. The steps are equidistant in time and the deformation will be harmonic (sinusoidal). The more steps the smoother animation. 3.70 Figure 3.70 The Mode shape animation setup dialog Note: The mode shape animation may also be used for static results. The static deformation is in such case assumed to be harmonic like a mode shape. Sesam Xtract Program version 3.0 3.7.2 1-FEB-2011 3-73 Animating Frequency Domain Results Having performed a frequency domain analysis the results file will contain complex results describing the harmonic response. Typically, there will be result cases (wave directions) and several occurrences (frequencies) for each result case. The following menu will then be available: Animation > Frequency animation The Setup frequency animation dialog, see Figure 3.71, appears. Set the start and stop angles (normally these should be left as 0 and 359, respectively) and the Skip by parameter which is the step angle between start and stop. The default of 10 will give 36 steps (frames). The more steps the smoother animation. Note: If you set up an animation for a certain component, say von Mises stress, you cannot change to another component without leaving the animation and setting up a new one. 3.71 Figure 3.71 The Setup frequency animation dialog 3.7.3 Animating Time Domain Results Having performed a time domain analysis the results file will contain a result case with occurrences being the time steps of a time history. If more than one time history has been analysed there will be more result cases. Prepare an animation by: Animation > Result case animation The Setup animation over result cases dialog, see Figure 3.72, appears. In the Occurrences list box all occurrences of the current result case will be listed. You have the option to exclude certain occurrences (time steps) by putting them into the Except list box (select the occurrence and click the arrow button). (Cancel an exclusion by selecting the occurrence in the Except list box and clicking Del.) You may also use the Step by parameter to run an animation for only every second, third, etc. time step. The default values (all occurrences and Step by 1) give the smoothest animation. Note: Once the animation reaches the final time step it will automatically restart causing a discontinuity in the animation. Note: If you set up an animation for a certain component, say von Mises stress, you cannot change to another component without leaving the animation and setting up a new one. Note: The result case animation may also be performed for (quasi-)static results. I.e. results from an analysis neglecting inertia effects and in which the result cases are in reality time steps. Xtract 3-74 Sesam 1-FEB-2011 Program version 3.0 3.72 Figure 3.72 The Setup animation over result cases dialog 3.8 Hydrodynamic Analysis Results from Wadam or Wasim As outlined in Section 2.1 (list items 2, 3 and 4) results from the hydrodynamic analysis programs Wadam and Wasim may be presented, optionally in combination with FE structural analysis results. Presenting Wadam and Wasim results thus falls into three cases: • Hydrodynamic pressure loads and rigid body motion (frequency domain results) for a floating object as computed by Wadam or Wasim plus structural analysis results computed by Sestra (R+G-files). See Section 3.8.1. The next two cases represent subsets of this case with respect to presentation options. • Hydrodynamic pressure loads and rigid body motion for a floating object as computed by Wadam or Wasim (T+L+G-files). See Section 3.8.2. • Hydrodynamic pressure loads for a floating object as computed by Wadam or Wasim (T+L-files). See Section 3.8.3. The use of Xtract for presenting the above results differs to some extent from presenting FE results. The following sections describe the procedure for the most typical postprocessing task for each case. Note: You should be familiar with the basics of using Xtract as covered in Section 3.1 before presenting and animating hydrodynamic analysis results. 3.8.1 Hydrodynamic Loads, Motion and Stresses – Wadam/Wasim and Sestra Results (R+G) Floating and fixed large volume structures (barges, ships, FPSOs, semi-submersibles, gravity base structures, etc.) are analysed in Sesam by the hydrodynamic analysis programs Wadam or Wasim and the structural analysis program Sestra. These programs produce files with results that may be postprocessed by Xtract. • The hydrodynamic analysis produces frequency domain results. (Wasim performs the analysis in time domain but is capable of transforming the results to frequency domain.) Hydrodynamic pressure loads are stored on Loads Interface Files (L-files) while the rigid body motion is stored on the Hydrodynamic Results Interface File (G-file), also termed Global Response File. The total wave elevation which is the Sesam Program version 3.0 Xtract 1-FEB-2011 3-75 sum of incoming, reflected and diffracted waves may optionally have been stored as additional information on the G-file (Wadam only). • The Sestra analysis stores the structural results on the Results Interface File (R-file). The R-file will contain the loads (L-file) as well. This section presupposes basic knowledge in postprocessing complex results as covered in Section 3.4. The procedure for presenting and animating such results is: • Start Xtract and click File > Open. Open both the R-file (for the top level superelement) and the G-file by click and Ctrl+click. Both files may have any of the formats SIF, SIU and SIN. • Double-click the model name appearing in the Database window of Xtract (R*) and the model (optionally in sea) is displayed. The various parts (superelements and sea surface) are colour coded. • Click the Result Cases tab and select a result case and an occurrence and double-click a stress result component, e.g. Nodes/G-STRESS/SIGXX. • Relevant for Wadam and not for Wasim: Having double-clicked a result component other than a displacement, velocity and acceleration component the sea will turn gray. This is because the program switches Contours on (Part attributes dialog) in an attempt to display the results but when no results are found (there are no stress components for the sea) it is left gray. You must switch the Contours off. Open the Part attributes dialog (Display > Part attributes), select the Sea surface and change how to display it: — Switch off Contours. — Switch on Mesh. — Change the colour (to sea green or marine blue?) by clicking the Color button. — Make the sea Transparent, maybe also adjust the transparency Alpha value (lower right corner), 0 is fully transparent, 255 is opaque. • You may want to use the Part attributes dialog to change the display of the structure too (for example: Smooth colouring? Mesh? Beams Expanded?). See Section 3.1.25 for more details on Part attributes. • Give Display > Settings and click the colour box for the Background and change it to grey or white or another light colour of your liking. A light background is better in combination with a transparent sea. • You may want to rotate and zoom to see the structure from below. • Present the rigid body displacement of the model and the wave elevation by Model > Deformed or the corresponding tool button. Note that the structural deformation is not included. • Scale (increase) the deformations by Model > Deformation scaling. • Give Animation > Frequency animation to set up an animation (see Section 3.7 for general information on animation). Set the Skip by value and click OK. Setting up the animation may require some time depending on the size of the model and the Skip by value. Once the animation control buttons (see Figure 3.67) appear you may start the animation. Xtract 3-76 Sesam 1-FEB-2011 Program version 3.0 • Run the animation by clicking the animation buttons. • During the animation you may rotate, zoom and pan, change part attributes and more. But to change result case and occurrence you must end the current animation and set up a new one. Figure 3.73 is a snapshot from an animation of a ship. The contours show a stress component. Note: Opening a G-file (together with the R-file) involves that the rigid body motion of the model (plus the wave elevation) replaces the structural deformations as the components available under Nodes/DISPLACEMENT as well as the results presented by Model > Deformed. Structural deformations are unavailable in this case (open only the R-file only if you want to see such results). Note: The normal pressure load on a shell is positive when pointing in the direction of the element zaxis. For a hull with the z-axis pointing outwards the pressure values will thus be negative. 3.73 Figure 3.73 Animation of a ship (R+G-files) – stresses, motion and waves – from Wadam/Sestra 3.8.2 Hydrodynamic Loads and Motion – Wadam/Wasim Results only (T+L+G) Floating and fixed large volume structures are analysed in Sesam by the hydrodynamic analysis programs Wadam or Wasim. The hydrodynamic analysis produces frequency domain results. (Wasim performs the Sesam Program version 3.0 Xtract 1-FEB-2011 3-77 analysis in time domain but is capable of transforming the results to frequency domain.) Hydrodynamic pressure loads are stored on Loads Interface Files (L-files) while the rigid body motion is stored on the Hydrodynamic Results Interface File (G-file), also termed Global Response File. The total wave elevation may optionally have been stored as additional information on the G-file (Wadam only). This section presupposes basic knowledge in postprocessing complex results as covered in Section 3.4. The procedure for presenting and animating such results is: • Start Xtract and click File > Open. Open both the T-file (for the top level superelement) and the G-file by click and Ctrl+click. The G-file may have any of the formats SIF, SIU and SIN. Corresponding L-files are automatically opened. These may be either formatted or unformatted. • Double-click the model name appearing in the Database window of Xtract (T*) and the model (optionally in sea) is displayed. The various parts (superelements and sea surface) are colour coded. • Click the Result Cases tab and select a result case and an occurrence and double-click Elements/SURFACE-LOADS/NORMAL-PRESSURE. • At this stage go to Section 3.8.1 and follow the procedure from the bullet item ‘Relevant for Wadam …’. Figure 3.74 is a snapshot from an animation of a ship. The contours show the hydrodynamic pressure load. Note: Do not open L-files by File > Open as these are automatically opened when the corresponding T-files are opened. Note: The normal pressure load on a shell is positive when pointing in the direction of the element zaxis. For a hull with the z-axis pointing outwards the pressure values will thus be negative. Note: For a superelement model viewing surface pressure loads should be restricted to having selecting the top level superelement. I.e. avoid opening a top level T-file, selecting a first or lower level superelement followed by presenting surface pressure loads. Xtract 3-78 Sesam 1-FEB-2011 Program version 3.0 3.74 Figure 3.74 Animation of a ship (T+L+G-files) – pressure, motion and waves – from Wadam 3.8.3 Hydrodynamic Loads – Wadam/Wasim Results only (T+L) Floating and fixed large volume structures are analysed in Sesam by the hydrodynamic analysis programs Wadam or Wasim. The hydrodynamic analysis produces frequency domain results. (Wasim performs the analysis in time domain but is capable of transforming the results to frequency domain.) Hydrodynamic pressure loads are stored on Loads Interface Files (L-files). This section presupposes basic knowledge in postprocessing complex results as covered in Section 3.4. The procedure for presenting and animating such results is: • Start Xtract and click File > Open. Open the T-file (for the top level superelement). Corresponding Lfiles are automatically opened. These may be either formatted or unformatted. • Double-click the model name appearing in the Database window of Xtract (T*) and the model is displayed. The various parts (superelements) are colour coded. • Click the Result Cases tab and select a result case and an occurrence and double-click Elements/SURFACE-LOADS/NORMAL-PRESSURE. • You may want to rotate and zoom to see the structure from below. Sesam Xtract Program version 3.0 1-FEB-2011 3-79 • Give Animation > Frequency animation to set up an animation (see Section 3.7 for general information on animation). Set the Skip by value and click OK. Setting up the animation may require some time depending on the size of the model and the Skip by value. Once the animation control buttons (see Figure 3.67) appear you may start the animation. • Run the animation by clicking the animation buttons. • During the animation you may rotate, zoom and pan, change part attributes and more. But to change result case and occurrence you must end the current animation and set up a new one. Figure 3.75 is a snapshot from an animation of a ship. The contours show the hydrodynamic pressure load. Note: Do not open L-files by File > Open as these are automatically opened when the corresponding T-files are opened. Note: The normal pressure load on a shell is positive when pointing in the direction of the element zaxis. For a hull with the z-axis pointing outwards the pressure values will thus be negative. 3.75 Figure 3.75 Animation of a ship (T+L-files) – pressure only – from Wadam Xtract 3-80 3.9 Sesam 1-FEB-2011 Program version 3.0 Hydrodynamic Loads and Motion – Wasim Time Domain Results Ships and ship-like structures with forward speed are analysed in Sesam by the hydrodynamic analysis program Wasim. The analysis is performed in the time domain. The analysis model, the hydrodynamic pressure loads, the rigid body motion and the wave elevation (split into incoming and radiated waves) are stored in a VTF-file. Optionally, the VTF-file may also contain result components versus time or this data may be found in a separate VTF-file. In addition to this VTF-file you may for illustration purposes have a (superelement) model, a so-called ‘extra geometry’, in the form of a (set of) T-file(s) representing the superstructure. This superstructure will in an animation rigidly follow the motion of the Wasim analysis model (which normally is limited to ship hull). Note: You should be familiar with the basics of using Xtract as covered in Section 3.1. The procedure for presenting and animating such results is: • Start Xtract and click File > Open and open the VTF-file. If relevant open also the (set of) T-file(s) representing the superstructure by Ctrl+clicking the (top level) T-file. • Double-click the model name appearing in the Database window of Xtract and the model in sea is displayed. The various parts (of the ship model and sea surface) are colour coded. • If relevant and needed you may position and scale the superstructure using the line-mode command ‘model extramodeltransformation’. Preferably, though, the superstructure is modelled in the proper coordinate system and with proper scaling making this command superfluous. • Click the Result Cases tab, let the Result case be ‘Total wave elevation/Displacement’ and double-click a component of Elements/SCALARS, e.g. Radiation Pressure. • Open the Part attributes dialog (Display > Part attributes), select the parts representing the Sea surface by click and Ctrl+click (if these parts do not have meaningful names they tend to be parts 1 and 3, uncheck the Visible option for these parts and click Apply to confirm this, then check the Visible option and click Apply) and change how to display the sea: — Switch off Contours (you may want to keep the Contours but this cannot be combined with transparent sea) and click Apply. — Switch on Mesh and click Apply. — Change the colour (to sea green or marine blue?) by clicking the Color button. — Make the sea Transparent, maybe also adjust the transparency Alpha value (lower right corner), 0 is fully transparent, 255 is opaque. Click Apply and Close. • You may want to use the Part attributes dialog to change the display of the wet and dry parts of the hull as well as the superstructure too (for example: Smooth colouring? Mesh? Contours off and change colour for dry part and superstructure?). See Section 3.1.25 for more details on Part attributes. • Give Display > Settings and click the colour box for the Background and change it to grey or white or another light colour of your liking. A light background is better in combination with a transparent sea. • You probably need to zoom in to see the ship model properly. • Present the rigid body displacement of the model and the wave elevation by Model > Deformed or the corresponding tool button. Sesam Program version 3.0 Xtract 1-FEB-2011 3-81 • Give Animation > Result case animation to set up an animation (see Section 3.7 for general information on animation). You may want to skip time steps (increase the Step by value) and skip the first or last part of the simulation period (put Occurrences into the Except list box). Setting up the animation may require some time. Once the animation control buttons (see Figure 3.67) appear you may start the animation. • Run the animation by clicking the animation buttons. • During the animation you may rotate, zoom and pan, change part attributes and more. • If the VTF-file also contain result components versus time then use Graph > VTF-Plot to open the VTFfile once more(!). A dialog named Plot Setup then appears in which you may select one or more time series results and click Apply. A graph window will then open in the upper right area of the display area. See Section 3.10 for more details on this. Figure 3.76 is a snapshot from an animation of a ship in waves coming at angle from astern. 3.76 Figure 3.76 Animation of a ship (VTF-file) – pressure, motion and waves – from Wasim Note: Do not scale the deformation if you have a superstructure included as the scaling only applies to the hull causing the two parts to disconnect. Note: Tabulation as explained in Section 3.6 is not available for typical Wasim results like wave elevations and pressures. Xtract 3-82 Sesam 1-FEB-2011 Program version 3.0 Note: Unit conversion as explained in Section 3.1.21 is not available for typical Wasim results like wave elevations and pressures. 3.10 Animating Jacket Launching – Installjac Time Domain Results A jacket launched from a barge is analysed in Sesam by Installjac. The analysis is performed in time domain. The analysis model and the rigid body motions of the jacket and the barge are stored in a VTF-file. Optionally, the VTF-file may contain time series results or this data may be found in a separate VTF-file. Note: You should be familiar with the basics of using Xtract as covered in Section 3.1. The procedure for presenting and animating such results is: • Start Xtract and click File > Open and open the VTF-file. • Double-click the model name appearing in the Database window of Xtract and the model in sea is displayed. The various parts (of the ship model and sea surface) are colour coded. • Open the Part attributes dialog (Display > Part attributes), select the sea surface and change how to display the sea: — Change the colour (to sea green or marine blue?) by clicking the Color button. — Make the sea Transparent, maybe also adjust the transparency Alpha value (lower right corner), 0 is fully transparent, 255 is opaque. Click Apply and Close. • You may want to use the Part attributes dialog to change the display of the structure too, for example changing colours. See Section 3.1.25 for more details on Part attributes. • Give Display > Settings and click the colour box for the Background and change it to grey or white or another light colour of your liking. A light background is better in combination with a transparent sea. • Give Animation > Result case animation to set up an animation (see Section 3.7 for general information on animation). You may want to skip time steps (increase the Step by value) and skip the first or last part of the simulation period (put Occurrences into the Except list box). Setting up the animation may require some time. Once the animation control buttons (see Figure 3.67) appear you may start the animation. • Run the animation by clicking the animation buttons. • During the animation you may rotate, zoom and pan, change part attributes and more. Figure 3.77 is a snapshot from an animation of a jacket launching just after the jacket is free from the barge. The barge rocks back while the jacket sinks into the water. An Installjac run may have created 2D series data, i.e. results component versus time, stored in the VTF-file containing the model or in a separate VTF-file. The 2D series data may be graphed in Xtract. Open the VTF-file (which may be the same as the one containing the model) by: Graph > VTF-Plot Having opened the VTF-file with time series data you should select one or more of the series available: Select in the Available series list box, add them to the Selected series list box and click Apply (and Close but Sesam Xtract Program version 3.0 1-FEB-2011 3-83 not Close File). Use the Graph options dialog to modify the graph. You may for instance want to rename the curves by the Edit Legend button. See Section 3.1.15 for help on the graph feature. During an animation a vertical line will move through the graph in parallel with the model animation. See Figure 3.77. 3.77 Figure 3.77 Animation of a jacket launching (VTF-file) – from Installjac 3.11 Riser and Mooring Analysis – Riflex Time Domain Results Riser and mooring analysis is in Sesam performed by Riflex. The analysis is performed in the time domain. The analysis model and rigid body motion of the riser, mooring system and floater are stored in a VTF-file. Optionally, the VTF-file may also contain result components versus time or this data may be found in a separate VTF-file. In addition to the VTF-file you may for illustration purposes have a (superelement) model, a so-called ‘extra geometry’, in the form of a (set of) T-file(s) representing some additional structure. This additional structure will in an animation rigidly follow the motion of the Riflex analysis model. Note: You should be familiar with the basics of using Xtract as covered in Section 3.1. The procedure for presenting and animating such results is: • Start Xtract and click File > Open and open the VTF-file. If relevant open also the (set of) T-file(s) representing the additional structure by Ctrl+clicking the (top level) T-file. • Double-click the model name appearing in the Database window of Xtract and the model is displayed. The various parts are colour coded. • However, as the risers and mooring lines are displayed with their true dimension they may hardly be visible (the lines are very thin compared with the whole system). Therefore, open the Part attributes dialog (Display > Part attributes), click Select all parts, uncheck the Expanded option and click Apply. Xtract 3-84 Sesam 1-FEB-2011 Program version 3.0 • Click the Result Cases tab and select a component of Elements SCALARS, e.g. Efficient axial force. • Present the rigid body displacement of the model by Model > Deformed or the corresponding tool button. • Give Animation > Result case animation to set up an animation (see Section 3.7 for general information on animation). You may want to skip time steps (increase the Step by value) and skip the first or last part of the simulation period (put Occurrences into the Except list box). Setting up the animation may require some time. Once the animation control buttons (see Figure 3.67) appear you may start the animation. • Run the animation by clicking the animation buttons. • During the animation you may rotate, zoom and pan, change part attributes and more. • If the VTF-file also contain result components versus time then use Graph > VTF-Plot to open the VTFfile once more(!). A dialog named Plot Setup then appears in which you may select one or more time series results and click Apply. A graph window will then open in the upper right area of the display area. See Section 3.10 for more details on this. Figure 3.78 is a snapshot from an animation of a riser and mooring system. 3.78 Figure 3.78 Animation of risers (VTF-file) – from Riflex Sesam Program version 3.0 Xtract 1-FEB-2011 3-85 Note: Do not scale the deformation if your VTF-file includes a floater (having rigid body motion) as the scaling only applies to the risers/mooring lines (having nodal deformations) causing them to part from the floater. 3.12 Stochastic Fatigue – Stofat Results Stochastic fatigue analysis of stiffened plate structures are preformed in Sesam by Stofat. The analysis model and fatigue lives are stored in a VTF-file. Note: You should be familiar with the basics of using Xtract as covered in Section 3.1. The procedure for presenting and animating such results is: • Start Xtract and click File > Open and open the VTF-file. • Double-click the model name appearing in the Database window of Xtract and the model is displayed. • The VTF-file may contain results for more than one fatigue analysis. The various analyses will appear as colour coded sub-models of the top level model. Select one of the sub-models by double-clicking it. • Click the Result Cases tab and double-click a component of Elements/SCALARS, e.g. a usage factor. • You may want to add the mesh and rotate the model to see the areas of highest interest. Note: Tabulation as explained in Section 3.6 is not available for typical Stofat results like usage factors and fatigue lives. Xtract 3-86 Sesam 1-FEB-2011 Program version 3.0 3.79 Figure 3.79 Presenting stochastic fatigue results (VTF-file) – fatigue lives – from Stofat 3.13 Exporting Data for Further Processing and Reporting In the following are presented some features for exporting model with results to files for further processing by other software as well as for report generation. These features are: • Exporting 3D model with results to a VTFx-file that in turn is opened in the free program Xtract Viewer for interactive 3D viewing. Alternatively, the VTFx-file may be opened in MS Word and PowerPoint through installation of the free GLview 3D Plugin. Read about this in Section 3.13.1. • Exporting two 3D models to a common VTFx-file for viewing a sub-model on top of the global model in Xtract Viewer. Read about this in Section 3.13.2. • Exporting data like 3D models with results, images, tables and single result values to a repository (database) belonging to the program Xtract Report Builder. This program is used for automatic generation of reports in for example MS Word and PowerPoint. Read about this in Section 3.13.3. 3.13.1 Exporting 3D Model with Results to VTFx-File for Viewing in Free Programs Export a 3D model with a selected result component and result case (a display scene) to a VTFx-file by: • File > Export to VTFx (or Ctrl+E) Sesam Program version 3.0 Xtract 1-FEB-2011 3-87 This opens the Export to VTFx file dialog, see Figure 3.80, in which a Case name and a Case description may be entered. The exported VTFx-file may be opened in the free Xtract Viewer for interactive 3D viewing of the model with results. By use of the free GLview 3D Plugin embedded into MS Word and PowerPoint interactive 3D viewing of the model with results is also available in a Word report and a PowerPoint slideshow. The Save button saves the VTFx-file as a new file while the Append button adds the display scene to an existing VTFx-file. 3.80 Figure 3.80 Exporting to VTFx-file for viewing Checking ‘Save preview image’ is relevant only for PowerPoint and involves that an image of the model, of specified Image size if desired, is displayed initially before starting the slideshow. Checking ‘Start animation when the file is opened’ is also relevant for PowerPoint only and only when the display scene is an animation. I.e. an animation has been set up as described in Section 3.7 prior to exporting the VTFx-file. Export of results to a VTFx-file allows a Sesam user to send a model with results to anyone, who after installing the free programs Xtract Viewer and/or the GLview 3D Plugin, can view the model with results in an interactive and Xtract-like user interface. Xtract Viewer Open the VTFx-file in Xtract Viewer, see Figure 3.81. Choose among the models saved by double-clicking in the Table of Cases pane to the left. In addition to rotating, panning and zooming in an Xtract-like graphical user interface the Xtract Viewer has several useful features like toggling display information (these buttons: ), one to four viewports (this button: ), showing detailed information about nodes and elements (press this button to open a pane and then use this button to select Element or Node followed by clicking elements/nodes), running an animation, and finally measuring distances (press this button: and click two nodes). Read more about these and other features through the Help (F1). (In this help documentation read ‘GLview Express’ as ‘Xtract Viewer’.) Xtract 3-88 Sesam 1-FEB-2011 Program version 3.0 3.81 Figure 3.81 The free Xtract Viewer offers an Xtract-like GUI for viewing results Note: Associate a VTFx-file with Xtract Viewer by starting the program and using File > Preferences to open the Preferences dialog. In this dialog click the Associate button. GLview 3D Plugin Having downloaded and installed the free GLview 3D Plugin a new tab appears in MS Word and PowerPoint with some new buttons including these two: and . Use the former button to insert a frame for the graphics and, with this frame selected, use the latter button to load a VTFx-file. Then in Word and a PowerPoint slideshow you may interactively manipulate (rotate, pan, zoom) the 3D model with results in an Xtract-like graphical user interface as illustrated in Figure 3.82. Note: In PowerPoint the interactive manipulation only works during a slideshow. Note: Interactive manipulation in GLview 3D Plugin differs somewhat from Xtract. RMB is for rotation and mouse wheel for zooming as in Xtract. Panning, however, is done by LMB while in Xtract it is Ctrl+RMB. (Ctrl+RMB in GLview 3D Plugin toggles display of the model.) Sesam Program version 3.0 Xtract 1-FEB-2011 3-89 3.82 Figure 3.82 GLview 3D Plugin in PowerPoint offers an Xtract-like GUI during a slideshow If the VTFx-file contains more than one model (by use of the Append button in the dialog shown in Figure 3.80) then choose among the models using the case selection field at the bottom of the GLview 3D Plugin window as shown in Figure 3.83. During a slideshow in PowerPoint you may also open the VTFx-file in Xtract Viewer as a separate process by clicking the button: . Xtract 3-90 Sesam 1-FEB-2011 Program version 3.0 3.83 Figure 3.83 Select among cases in the GLview 3D Plugin window in the PowerPoint slideshow 3.13.2 Combined export of Two 3D Models to VTFx-File – Sub-Model plus Global Model Sub-modelling analysis is a technique for refined and quick analysis of a detail of a ‘global’ analysis. It involves creating a model of the detail, a sub-model, and imposing prescribed (forced) displacement on the sub-model boundaries. These displacements are taken from the global analysis at positions corresponding to the sub-model boundaries. In Sesam the program Submod is used to extract such displacements from the global analysis and impose them on the sub-model boundaries. It is a crucial quality assurance measure of a sub-modelling analysis to verify that the prescribed displacements of the sub-model boundaries are correct. This may be verified by comparing the deformations of the sub-model and global model. Xtract allows such comparison by overlaying the two deformed 3D models. This is done by exporting the two 3D models to a common VTFx-file which in turn is opened by the Xtract Viewer. In this free program the sub-model is superimposed on the global model thus allowing interactive inspection of the overlaid deformed 3D models. Do this by following the procedure outlined below. Open the global model results file in Xtract and select a result case. Switch on deformed model by Model > Deformed (or Ctrl+Alt+D). Use Model > Deformation scaling to select a suitable scaling factor, e.g. round up the program chosen factor. See the dialog to the left in Figure 3.84. Then export the deformed global to a VTFx-file by: • File > Combined export This opens the dialog shown to the right in Figure 3.84. Notice that when selecting Model type = Global model the model is by default drawn in surface mode using a blue colour. Note: Any currently shown colour contour presentation of a result component will not be exported. Note: At this stage do not check the Launch Sesam Xtract Viewer box. Give a file name and click Export. Sesam Xtract Program version 3.0 1-FEB-2011 3-91 3.84 Figure 3.84 Combined export of global model to VTFx-file Then open the sub-model results file (you don’t have to exit Xtract) and select the same result case as the one selected for the global model. Switch on deformed model by Model > Deformed (or Ctrl+Alt+D) and use Model > Deformation scaling to select the same scaling factor as the one chosen for the global model. See the dialog to the left in Figure 3.85. Then export the deformed sub-model to the same VTFx-file as the one of the global model by: • File > Combined export This opens the dialog shown to the right in Figure 3.85. Notice that when selecting Model type = Submodel the model is by default drawn in wireframe mode using a marron colour. This is to enable distinguishing the two models when overlaid. At this stage check the Launch Sesam Xtract Viewer box. Make sure the file name is the one given for the global model and click Export. 3.85 Figure 3.85 Combined export of sub-model to VTFx-file The Xtract Viewer will now open, see Figure 3.86. Superimpose the sub-model on the global model (and not the other way around as this may produce a distorted perspective) by right-clicking it as shown in the figure. Xtract 3-92 Sesam 1-FEB-2011 Program version 3.0 3.86 Figure 3.86 Xtract Viewer allows viewing sub-model superimposed on global model Note: Associate a VTFx-file with Xtract Viewer by starting the program and using File > Preferences to open the Preferences dialog. In this dialog click the Associate button. 3.13.3 Automatic Report Generation by the Xtract Report Builder The purpose of the Xtract Report Builder is to facilitate the creation of a report for an analysis performed in Sesam. The Xtract Report Builder is especially useful for creating standardised reports and report revisions. A new version or revision of a report may be created in mere seconds. The delay between introducing a change in the model and presenting a completely new report is practically no longer than what it takes to run the analysis anew plus doing the postprocessing in Xtract by reading the log of commands from the previous session. The Xtract Report Builder is a separate program accompanying Xtract and is subject to a separate license, see Section 1.5. The use of the Xtract Report Builder requires MS Office 2007 or later. You also need to install the software component GLview 3D Plugin that will integrate with MS Word and PowerPoint. The process of using the Xtract Report Builder is illustrated in Figure 3.87 and works like this: • The postprocessing of analysis results is performed as normal in Xtract. Sesam Program version 3.0 Xtract 1-FEB-2011 3-93 • Graphics, graphs, tables and other data to include in the report are during the Xtract postprocessing saved (captured) to a repository (database). This repository belongs to the Xtract Report Builder which is automatically opened when such capturing is performed. • The graphics, graphs and tables that are captured in Xtract are termed situations. A situation may optionally include a complete 3D representation of the model with results and not merely a static 2D picture. This allows interactive manipulation of the model in an Xtract-like GUI in the final report. • Accompanying each situation are a title, a text and some parameters (termed field values). Examples of field values are name of the current result case, names of the current result position/attribute/component, maximum and minimum values of the current result component and upper/lower surface. • Any number of situations may be captured in Xtract and all will appear in the Xtract Report Builder. • In the Xtract Report Builder the situations may be deleted, reordered, made inactive and even edited to some extent. • The final step is to create the report in e.g. MS Word or PowerPoint. The creation is based on a template that decides where all the graphics, graphs and tables – the situations – with their accompanying titles, texts and field values should go in the final report. • The template determining the appearance of the final report is itself a Word/PowerPoint document. A previous report may thus with some editing be used as such a template. 3.87 Figure 3.87 Xtract Report Builder process Xtract Sesam 3-94 1-FEB-2011 Program version 3.0 Save a situation in Xtract to an Xtract Report Builder repository – a repx-file – by: • File > Capture situation (or F4) Or by: • File > Quick Capture situation (or F5) The former opens the dialog shown in Figure 3.88 for determining the contents of the situation to capture while the latter captures a situation based on the settings of the previous capture (no dialog will open). 3.88 Figure 3.88 Capturing a situation for a report by F4 Capturing a situation involves storing the current display as either a 2D image or a 3D model according to the choice made in the Capture situation dialog to a repository (repx-file) and at the same time starting (if not already running) the program Xtract Report Builder shown in Figure 3.89. The figure shows a case where several situations have already been captured. Situation number 3 is the one currently selected. This situation is a 3D model as can be seen from the active tab with text ‘3D view’. For a situation containing an image the ‘Image’ tab will be active. Figure 3.89 also shows the Xtract Report Builder when selecting the tab ‘Field values’. These are parameters captured together with the 3D model or image. As can be seen these are name of the results file (database), i.e. the SIN-file, and when this was created, which run number and result case are shown, which position, attribute and component are shown, minimum and maximum values of the selected component and more. Sesam Program version 3.0 Xtract 1-FEB-2011 3-95 In the Xtract Report Builder you may select any of the situations and inspect the model and the field values. If the situation is a 3D model you may also rotate and zoom it. The Title and Description that were given in the capturing process in Xtract may be modified. You may even use the bold, italic and underline buttons to highlight text in the Description. You may right-click a situation as shown to the left in Figure 3.89 to move it up or down, to deactivate it (meaning it will not be exported to the report) and remove (delete) it. 3.89 Figure 3.89 Xtract Report Builder Provided you already have a suitable template you may then create the report by clicking either of the buttons , from left to right: PowerPoint, Word, Text and Html. Read more about how to create automated reports in the Xtract Report Builder User Manual. Xtract 3-96 3.14 Sesam 1-FEB-2011 Program version 3.0 Notes on Graphing, Combining and Scanning 3.14.1 Graphing Note: When graphing Item types Nodes (in Graph construction dialog, see Figure 3.18) care should be taken when selecting attributes other than displacements, velocities and accelerations (which are the only true nodal results data). If, for instance, Nodes/G-STRESS/SIGXX is graphed along an intersection between two plates where the values differ for the two plates due to difference in local (element) coordinate system then Xtract will choose the values belonging to the lowest element number. Note: When graphing item types Beams (in Graph construction dialog, see Figure 3.18) beams on a line should be selected in the direction of their element x-axis or else the graphs of the individual beams will be flipped (individual beam graphs always follow the direction of the x-axis). 3.14.2 Combining and Scanning Note: Both a combination and a scan result case are established for all components of the chosen attribute and for that attribute only. Note: Unless a combination has been created for all available results by the All results option in the Combine dialog it may be extended with additional attributes (and all components of these) by the line-mode command ‘combine add’. (There is no GUI equivalence to this command.) A combination including a complex result case cannot be extended. Note: Combinations and a scan result cases are put in a run named User. The occurrence will always be 1. 3.15 Special Features This section includes some special features. 3.15.1 Save Time for large Models by not Reading Beam Sections Large models with a number of different beam sections, typically ship models with many different stiffeners, may demand quite some time reading the sectional data. Save time by skipping reading sectional data as follows: • Start Xtract and open the results file by File > Open. • Use Display > Read beam expansion to switch off reading beam sections, this is by default set to on. • Select the model by double-clicking it in the browser. Then when displaying the model the beams will be drawn as thick lines only (adjust the line thickness by Display > Beam width). Furthermore, the B-STRESS attribute will not be available. Sesam Xtract Program version 3.0 1-FEB-2011 3-97 Note: Display > Read beam expansion must be done after opening the results file and before selecting the model. To revert to displaying the model with beam sections (and having the B-STRESS attribute available) you need to reopen the results file (the Read beam expansion will then automatically be switched back on) and then select the model. 3.15.2 Square Root of Sum-of-Squares Combination for Elements/G-STRESS A specialized feature is available for combination of Elements/G-STRESS and Elements/D-STRESS components: As an alternative to a normal linear combination a square root of sum-of-squares (SRSS) type of combination may be performed. That is, the following combination is performed for each of the components: Combination = 2 2 2 f1 1 + f2 2 + f3 3 + where f is the factor, is the stress component (axial and shear) and 1, 2, 3, … are the result cases included in the combination. Change Normal sum in the Combine dialog, see Figure 3.23, to Square root of sum-of-squares to perform this type of combination. Note: Square root of sum-of-squares (SRSS) combination is available only for the linear components (i.e. not von Mises) of Elements/G-STRESS and Elements/D-STRESS. Note: The stress components of an SRSS combination cannot be interpreted as true stresses. E.g. a result cases with SIGXX = 100 ‘SRSS-combined’ with a result case with SIGXX = 100 yields a SIGXX = 141 (100 times square root of 2) whereas the true stress produced by a normal combination would be zero (100 100). For this reason the von Mises stresses are not calculated for an SRSS combination. Note: The square root of sum-of-squares combination cannot be used when one of the resultcases is complex (see Section 3.4.2). 3.15.3 Ship Overall Vibration Level This section explains how Xtract computes the overall vibration level of a ship (or any other structure for which you may want to use this feature) as a sort of a norm of velocities taken from a dynamic forced response analysis. How to use this feature is also explained. The computation is based on velocities computed in a dynamic forced response analysis in the frequency domain. The velocity results are thus complex. The results file will contain a certain number of (normally two or three) result cases. Each result case includes a number of frequencies (occurrences). The frequencies typically constitute a range around, e.g. ±10%, a resonance frequency of the structure. The procedure is as follows. 1 Scan each of the (2 or more) result cases as follows: Xtract 3-98 Sesam 1-FEB-2011 Program version 3.0 — Evaluate each occurrence (frequency) for the maximum absolute value (largest value no matter which sign) of each of the translational (X, Y and Z) components of the nodal velocities. — Scan over all frequencies (or limited to a specified frequency range) of the result case for the maximum absolute value of each of the translational (X, Y and Z) components of the nodal velocities. — The above two steps create three scan result cases (for X, Y and Z). (Each scan result case contains all components but only the component scanned for is of interest.) — Scale each scan result case with a factor depending on the result case. This factor is user specified. — Let the scaled scan result cases be termed vscan_x_i, vscan_y_i and vscan_z_i where ‘i’ is the result case. 2 Compute the norms: 1 2 2 2 v norm_x = ------- v scan_x_1 + v scan_x_2 + v scan_x_3 + 2 1 2 2 2 v norm_y = ------- v scan_y_1 + v scan_y_2 + v scan_y_3 + 2 1 2 2 2 v norm_z = ------- v scan_z_1 + v scan_z_2 + v scan_z_3 + 2 3 Add user specified constants to the norms: (3.1) (3.2) (3.3) The constants – one for each component X, Y and Z – are specified for previously defined sets. I.e. for one set the three constants vtip_x, vtip_y and vtip_z are given. For another set three new constants are given and so on. Add these constants to the norms to find the overall vibration levels: v overall_x = v norm_x + v tip_x (3.4) v overall_y = v norm_y + v tip_y (3.5) v overall_z = v norm_z + v tip_z (3.6) An example input is presented below. It is based on a frequency domain analysis with two result cases found under run number 2. Each of the result cases has a number of frequencies. The frequency range of the first result case is 290 - 310 Hz and the frequency range of the second result case is 320 - 340 Hz. The scaling factors for the scan result cases are 1.1 for result case 1 and 1.2 for result case 2. The constant vtip_z has value 1.12 for a set named SetA and 1.18 for a set named SetB. We assume that the sets SetA and SetB have already been created. Furthermore, we want to limit the frequency ranges to be considered for the two result cases to 300 - 308 Hz and 322 - 335 Hz, respectively. The input for computing the overall vibration level will be: createuservector \ "tip_v" \ "SetA" 0 0 1.12 \ "SetB" 0 0 1.18 overallvelocity \ "v_overall" \ "tip_v" \ 300 308 "2" "1" 1.1 \ 322 335 "2" "2" 1.2 Sesam Program version 3.0 Xtract 1-FEB-2011 3-99 As seen the constants vtip_x, vtip_y and vtip_z to be added to the norms are stored in the new result case tip_v created by the command createuservector. The result case tip_v is referred to in the subsequent command overallvelocity that computes the overall vibration levels and stores the data in the new result case v_overall. Both tip_v and v_overall will be found under run ‘number’ User. The tip_v result case contains the attribute VELOCITY under position Nodes with components X, Y and Z as entered (1.12 and 1.18 for sets SetA and SetB, respectively). The v_overall result case will contain the attribute VELOCITY under position Nodes. The attribute will include the components X, Y, Z, RX, RY and RZ being the main result of this feature. In addition, the following result cases will be created by the command overallvelocity: v_overall_SCAN_X_1, v_overall_SCAN_Y_1, v_overall_SCAN_Z_1, v_overall_SCAN_X_2, v_overall_SCAN_Y_2 and v_overall_SCAN_Z_2. These correspond to the terms vscan_x_i, vscan_y_i and vscan_z_i above (i = 1 and 2). Also the result case v_overall_NORM containing vnorm_x, vnorm_y and vnorm_z above will be created. 3.16 Working with Line-Mode Commands and Command Input Files If you want to enter commands through the keyboard (line-mode commands) then click anywhere in the Command and message window (see Figure 3.2) and start typing. Pressing Enter will execute a complete command (the backslash character before Enter allows an incomplete command to be continued). A command reference is found in Chapter 5. See the beginning of Chapter 5 (page 5-1) for details on how to enter commands. There are certain features that are only available through line-mode commands (e.g. the ‘result deletecase name-of-case’ command). Whether you use the graphical user interface or enter line-mode commands your actions will be logged in a file. Depending on how Xtract is started the name of the log file will be Xtract.jnl or Xtract#.jnl where # is the (top level) superelement number. You may stop logging by: File > Stop logging commands You may start logging in a new file (and stop logging to the current file, if any) by: File > Start logging commands The appearance of a log may be: open sin "<path of file>R1.SIN" model select R1 display mesh result select "Elements" "G-STRESS" "VONMISES" eye isometric + - + plot GIF "Plot-stress-case1.GIF" 656 576 white "<header text>" 2 "<footer text>" 0 result selectcase "1" "3" "1" plot GIF "Plot-stress-case3.GIF" 656 576 white "<header text>" 2 "<footer text>" 0 The first couple of lines above opens the results file and displays the (top level) superelement. The 3rd line adds the FE mesh to the display. The 4th line presents the component Elements/G-STRESS/VONMISES. Thereafter, a new view direction is set and a plot is produced. Then result case 3 (run 1, result case 3, occurrence 1) is selected and another plot is produced. Xtract Sesam 3-100 1-FEB-2011 Program version 3.0 If you want to create an input file to rerun the above session this can be done in two ways as described in the subsequent sections. Note: Xtract always logs result positions, attributes and components as well as result case identifications plus all text strings in double-quotes. In a Command input file the double-quotes may be skipped unless the word/string includes spaces. 3.16.1 Reading a Command Input File from inside Xtract The above interactive session may be repeated by creating a file, named for example Input.jnl, with the following content: model select R1 display mesh result select Elements G-STRESS VONMISES eye isometric + - + plot GIF Plot-stress-case1 1000 1000 white "<header text>" 2 "<footer text>" 0 result selectcase 1 3 1 plot GIF Plot-stress-case3 1000 1000 white "<header text>" 2 "<footer text>" 0 See notes on result case identification in Section 3.16.2 and details on how to enter line-mode commands in Chapter 5, page 5-1. The plot commands have been revised somewhat by increasing the plot file size to 1000 by 1000 pixels thereby creating plots of higher resolution. Run Xtract using the input file by starting Xtract, opening the results file (the command for opening the results file could very well have been part of the input file) and giving: File > Open (or click the tool button ) The Open dialog, see Figure 3.90, appears. In the Files of type box select Xtract Journal Files (*.jnl) and see that all files in the folder of type .jnl are listed. Select the file Input.jnl and click Open. The file will then be read into Xtract and processed. Note: If a Command input file contains an error then Xtract stops the processing of commands and points to the erroneous line-mode command. Note: You may also use cut and paste to drop several commands from a text editor into Xtract. Sesam Xtract Program version 3.0 1-FEB-2011 3-101 3.90 Figure 3.90 The Open dialog for reading a Command input file 3.16.2 Notes on Result Case Identification Note: Even in cases where there is only one run number and one occurrence (e.g. a static analysis) a result case is always referred to by the full identification: Run number, result case and occurrence. This concerns the log as well as a Command input file. Note: The run number, result case and occurrence are strings that in general are enclosed by doublequotes: "2" "4" "3: Excit. freq. 5.3 Hz". But if a string does not include blanks the doublequotes may be skipped: 2 4 "3: Excit. freq. 5.3 Hz". Note: Sub-string matching is performed for strings. The occurrence "3: Excit. freq. 5.3 Hz" may be referred to as "3:" (or 3: since there are no blanks) or "5.3 Hz". Note: The colon in the sub-string "3:" is normally required to match uniquely an occurrence of frequency domain results as "3" alone will easily match a number of occurrences (it may occur in the frequency value). The full identification "2" "4" "3: Excit. freq. 5.3 Hz" is therefore normally best referred to as 2 4 3:. Xtract 3-102 Sesam 1-FEB-2011 Program version 3.0 Sesam Program version 3.0 Xtract 1-FEB-2011 4 EXECUTION OF XTRACT 4.1 Program Environment 4-1 Note: Xtract is available on Windows only. Go to Section 3.1 for information on how to start Xtract. Xtract may be started with some command line arguments that will control the execution, see Section 4.1.2. This is mostly relevant when starting Xtract from another program. 4.1.1 Files used by Xtract Xtract may open and read several files as described in Section 2.1. Xtract does not modify these files. Xtract will open its own database (model file) named Xtract#.mod and a corresponding index file named Xtract#.idx where # is the (top level) superelement number. Combinations, scan result cases and scaled complex result cases will be stored on this database. Sets defined in Xtract (as opposed to sets read from files) are also stored on the Xtract database. When opening a new results file within the same Xtract execution then the current database will be closed and a new opened on the directory of the new results file. Commands (both actions through the GUI and line-mode commands) may be logged to a user given file name. See File > Start logging commands, the equivalent line-mode command ‘log on file-name’ and the command line argument /log. Line-mode commands may be read from a Command input file. See File > Open, the line-mode command ‘open jnl filename’ and the command line argument /command-file. Files containing tabulated data may be saved (see ‘Model > List model data’ and ‘Results > List results’) and plots may be saved to various formats. 3D models may be saved to a VTFx-file by the commands File > Export to VTFx and File > Combined export. These features are described in Section 3.13.1 and Section 3.13.2, respectively. Xtract 4-2 Sesam 1-FEB-2011 4.1.2 Program version 3.0 Command Line Arguments The command line arguments are: /eye-x=value X-coordinate of an initial viewpoint /eye-y=value Y-coordinate of an initial viewpoint /eye-z=value Z-coordinate of an initial viewpoint /software Do not use graphics accelerator /hardware Use graphics accelerator installed, if any /command-file=filename Read the specified Command input file. /log=filename Log commands to the specified file. /nolog Disable logging from start. (By default logging is performed to the file Xtract#.jnl.) /pixelformat=value Force Xtract to use a certain pixel format rather than the default format. This command line argument should only be used when there are problems with the graphics driver as the pixel format value is highly dependent on the graphics driver. Therefore, use only after consulting with the Sesam support. Command line arguments should be preceded either by a slash (as shown above) or by a minus sign. The argument name, which may be abbreviated as long as it is unique, should follow immediately after the slash (or minus). The equal sign and qualifier should follow immediately after the argument. One or more spaces are used to separate the individual arguments. 4.1.3 Registry Settings Xtract saves certain settings in the user registry: • In HKEY_CURRENT_USER\Software\DNVS\Xtract\Layout are stored: — Position and size of the Xtract window — Maximize/Minimize/Restore status • In HKEY_CURRENT_USER\Software\DNVS\Xtract\ResultListing parameters related to tabulation of results as described in Section 3.6 are stored. • In HKEY_CURRENT_USER\Software\DNVS\Xtract\Settings are stored: — Number of significant digits (Display settings dialog) — Element shrink factor (Display settings dialog) — Font size (Display settings dialog) — Undeformed wireframe colour (Display settings dialog) — Background colour (top/bottom/gradient) (Display settings dialog) Sesam Program version 3.0 Xtract 1-FEB-2011 4-3 — Label filtering (show all or a maximum number of labels) (Labeling dialog) — Label background box shown or not (Labeling dialog) — SCANINDEX options (Labeling dialog) • In HKEY_CURRENT_USER\Software\DNVS\Xtract\Recent File List are stored: — Recently opened files • In HKEY_CURRENT_USER\Software\DNVS\Xtract\CaptureSituation are stored: — Settings of the Capture situation dialog, see Figure 3.88. Note: The settings in HKEY_CURRENT_USER\Software\DNVS\Xtract\Settings are set back to default by File > Reset settings. Note: The settings in HKEY_CURRENT_USER\Software\DNVS\Xtract\Layout can only be reset to default by deleting these registry settings: Start > Run, type ‘regedit’ and hit Return, expand the branch and delete the parameters named ‘WindowBottom’, ‘WindowLeft’, etc. This involves that all these settings are stored when exiting Xtract and they take effect when restarting the program with the same user and PC. 4.2 Program Requirements 4.2.1 Execution Time Xtract utilises the graphics accelerator OpenGL if such is installed. The speed of graphical manipulation (e.g. animation) will improve with this hardware. Utilisation of the graphics accelerator may be switched off by the command line argument /software, see Section 4.1.2. Execution time is for most commands limited to a few seconds. Depending on the hardware and the model size creating combinations and scan result cases may require some time though. The progress bar in the lower right corner of the Xtract window indicates the progress of the combine and scan commands. Also notice that the Command and message window displays execution time of various operations. Setting up and running animations may also be slow on computers with modest performance. Note: Reading large models with many beam stiffeners, e.g. a ship model, may require some time due to the amount of beam sectional data. It is selecting the model (reading data and displaying the model) and not opening the results file that takes time. To reduce this time reading the beam sectional data may be skipped, see Section 3.15.1. This involves that beam sections cannot be displayed. Moreover, the B-STRESS attribute will not appear as data for computing this result type is unavailable. 4.2.2 Storage Space The database (model file) and index file of Xtract are initially empty. When combinations, sets, etc. are created the size of the model file will increase. Except for large models for which many combinations, sets, etc. are created the size will be modest. Xtract 4-4 Sesam 1-FEB-2011 4.3 Program version 3.0 Program Limitations Xtract employs the general high-performance graphics software OpenGL for presenting results with filled contours. This has a couple of consequences as explained below that may for the keen observer be somewhat confusing. One should bear in mind, however, that the accuracy of an analysis normally does not allow an interpretation at a very detailed level (like gradients within an element) anyway. Consequently, the matters discussed in the notes may in certain cases cause some bewilderment but it should have no practical significance. Note: To facilitate support for large result variations in an element the positioning of the filled contours may deviate from the exact position when the user manually enters the contours, e.g. by the Values mode in Result settings. This is due to the limitation of texture size supported by the graphics board as well as the linear interpolation scheme for texture coordinates of OpenGL. Note: OpenGL handles the task of linear interpolation between the four corner values of quadrilateral elements. As a bi-linear field cannot be established between four corner values (for the same reason as a plane through four arbitrary points cannot be found) an assumption must be made. In other words, there is not one definite way of interpolating the result values (e.g. a stress component) inside a quadrilateral element. This has the consequence that the exact position of the contour lines inside an element may depend on the view position. In certain situations this gives an abrupt change of contours when the model is slightly zoomed or rotated. Note: Opening a database (model file) with a newer version of Xtract than the one creating it will in most cases work. But in certain cases the data will be inconsistent. As a general rule it is therefore best to save the command log (journal) file from a session and use this as input in a later session using a new program version. Note: There is a limitation to how many combinations, sets, etc. that can be defined in Xtract. This limitation is related to the size of the model as explained below. NSET + NCOMBNSEL 500,000 where: NSET is number of sets defined NCOMB is number of combinations, ‘combine add’s’, scan result cases and scaled complex result cases NSEL is number of first level superelements for which the combinations, etc. have been created for Note: A maximum of 3125 result cases on the results file may be handled. Note: Names of sets, result combinations, scan result cases and scaled complex result cases are limited to 80 characters. Note: Avoid shrinking elements (Display > Shrunken mesh) while showing results with Contour type Lines (selected through Results > Settings) as these contour lines will not be shrunken (they will not follow the elements). Contour type Filled is, however, properly shrunken. See the Status List for possible other program limitations. Sesam Program version 3.0 5 Xtract 1-FEB-2011 5-1 COMMAND DESCRIPTION This chapter describes the Xtract line-mode commands, i.e. commands entered by the keyboard through the Command and message window; see Figure 3.2. Commands deemed relevant only through the GUI are excluded, e.g. window docking/undocking, print preview, making annotations etc. See Section 3.16 for information on command logging and command input files. Details on the command syntax and how to enter commands: • Keywords: All commands consist of one or two keywords. Examples of one-keyword commands are plot, scan, combine and evaluation. Examples of two-keyword commands are ‘display mesh’, ‘model deformed’ and ‘result select’. • Parameters: The one or two keywords are followed by one or more parameters that may be words, names (character strings) or numeric values. Examples in which the parameters are underlined are ‘plot gif plot1’, ‘scan maxvonm max Elements G-STRESS VONMISES …’, ‘model select R1’, ‘result selectcase 1 3 1’, ‘result select Nodes DISPLACEMENT ALL’. • The keywords and parameters are separated by one or more blanks. • Backslash continuation: A command may be continued by the backslash character. For example: scan scan1 max Elements G-FORCE NXX 1 1 1_1: criterion 1 1 1 1_2: criterion 1 1 1 1_3: criterion 1 may be split into several lines: scan \ scan1 \ max \ Elements G-FORCE NXX \ 1 1 1_1: criterion 1 \ 1 1 1_2: criterion 1 \ 1 1 1_3: criterion 1 Note that comments are not allowed in between lines belonging to the same command. Xtract 5-2 Sesam 1-FEB-2011 Program version 3.0 • Truncate keywords: The keywords may be truncated as long as they are unique. Truncate for example ‘plot gif plot1’ to ‘pl gif plot1’. A two-keyword command is seen as a whole meaning that only the latter keyword may be truncated. Truncate for example ‘result selectcase "2" "4" "3: Excit. freq. 5Hz"’ to ‘result selectc 2 4 3:’ (see items on skipping double-quotes and sub-string matching below). • Tab-completion: Having typed one or more characters of a keyword pressing the Tab-key fills in the remainder of the keyword or all characters until the string branches off into alternative keywords. For example: type ‘d’, press the Tab-key and the program fills in characters so that it reads ‘display’. This is, however, not a unique keyword. Typing ‘s’ and pressing the Tab-key gives ‘displaysettings’ which is unique. Or typing ‘i’ and pressing the Tab-key which gives ‘displayinfo’. • Guidance in Status bar: Once the keyword(s) of a command are unique the Status bar at the bottom of the Xtract window will provide guidance on the parameters to enter. Note that while this manual uses italic font for parameters (parameter) the Status bar encloses parameters in ‘greater/less-than-brackets’ like this: <parameter>. • Double-quotes when spaces: Character strings entered for parameters, e.g. names of sets, result cases and occurrences, must be enclosed by double-quotes if they include spaces. Examples: The set name "Upper web", the combination "Combination North A" and the occurrence "3: Excit. freq. 5Hz". The command log will always enclose words as well as strings in double-quotes even when there are no spaces. • Sub-string matching: Sub-string matching is performed for command words (Nodes, Elements, GSTRESS, SIGXX) and name strings (names of sets, result cases, occurrences). Examples: ‘Elements GSTRESS SIGXX’ may be referred to as ‘El G-STRE XX’. The occurrence "3: Excit. freq. 5 Hz" may be referred to as "3:" (or 3: since there are no blanks) or "5 Hz". • Exact match vs. sub-string match: An exact match of a string will take priority over a sub-string match. An example: There are two result cases: ‘combine’ and ‘comb’ sorted in this order. Alt. 1: The string ‘comb’ is given. This is a sub-string of the first result case ‘combine’ but it matches the second result case ‘comb’ exactly. The second result case ‘comb’ is therefore selected. Alt. 2: The string ‘com’ is given. This is a sub-string of both result cases ‘combine’ and ‘comb’. The first result case ‘combine’ is therefore selected. • Comments in input: Comments may be entered by preceding the text with either of the following: exclamation mark (!), hash symbol (#) and percentage sign (%). Commands are described in Section 5.1 through Section 5.7 as follows: • The commands are described in a logic rather than alphabetic order: They are described in sub-sections named after the GUI menu commands to which they belong. • Commands (keywords and parameter words) are in the command description written in normal font while parameters that can take different values are written in italic font. • Braces and a vertical bar are used for alternatives of which one must be selected: {nodes | elements} • Brackets are used for optional input: [text] • Brackets and a vertical bar are used for alternatives of which none or one can be selected: [on | off] Sesam Xtract Program version 3.0 1-FEB-2011 5-3 There are seven categories of commands: (1) File, (2) Display, (3) Model, (4) Set, (5) Result, (6) Graph and (7) Animation. These are tabulated with their subcommands in Table 5.1 and explained in detail in Section 5.1 through Section 5.7. Table 5.1 Overview of line-mode commands Display Commands File Commands Command category Model Commands Set Command Subcommand (click link) Explanation Open Open file(s) of specific type. In the case of JNL process the file. Source Open and process a Command input file (.JNL). Use Open instead. Plot Plot current view. Plotall Plot all (2 or 4) viewports. Print Print current view. Exportvtfx Export display scene to a VTFx-file. Exportcombined Export a global model or a sub-model to a common VTFx-file. Rep Capture a situation and store in a Xtract Report Builder database. Log Start or stop logging of commands to file. Exit Exit from Xtract. Resetsettings Resets settings in the registry to default. Display Display model and results in alternative ways. Displaysettings Set display settings such as colours, significant digits and fonts. Displayinfo Set display information such as content of Info box and legends. Label Enable/disable labelling of nodes, elements and materials. Eye Zoom, rotate and pan the model. Model Change how the model is displayed. Section Make a section (cut) through the model. Set Make new, show existing and change sets. Xtract Sesam 5-4 1-FEB-2011 Program version 3.0 Table 5.1 Overview of line-mode commands Subcommand (click link) Explanation Result Select result case, position/attribute/component sets display modes. Contour Set contour settings such as datum, levels, values and min/max. Vector Set vector settings such as scaling and arrow heads. Shell Select shell surface or layer for results presentation. Evaluation Set evaluation method for complex result cases. Combine Combine result cases into new result case for one attribute/component. Combine add Add an attribute to a previously created combination. Combine all Combine result cases into new case for all attributes/components. Combine sqrt Create a square root of sum-of-squares type of combination. Scan Scan result cases for max or min of a result component. Scale Scale a complex result case. Createuservector Create a vector result with given values in given sets. Overallvelocity Create a result case containing the overall velocity level. Graph Commands Graph Draw graph and modify graph settings. Animation Commands Animation Set up, play and save an animation. Result Commands Command category Sesam Xtract Program version 3.0 5.1 1-FEB-2011 5-5 File Commands These commands access and produce files. Also resetting registry settings is found in this section. 5.1.1 Open Open file(s) of specific type. In the case of JNL (Command input file) the file is also processed. Syntax: open file-type-code filename [global-response-file] Explanation of parameters: Command input file JNL Note: ‘open JNL filename’ is equivalent to ‘source filename’. file-type-code FEM Input Interface File – T-file (prefixT#.FEM) SIF Sequential formatted (ASCII) Results Interface File – R-file (prefixR#.SIF) SIU Sequential unformatted Results Interface File – R-file (prefixR#.SIU) SIN Database (NORSAM) format of Results Interface File – R-file (prefixR#.SIN) VTF VTF-file (produced by Wasim, Riflex, Stofat or Installjac) The full name of the file to open including the file type and if necessary also the directory/folder path. file-type-code pertains to filename. filename Optionally a Hydrodynamic Results Interface File (also termed ‘Global Response [global-response-file] File’) may be opened together with an Input Interface File or a Results Interface File. See Section 2.1 for more details on postprocessing of various file types. 5.1.2 Source Open and process a Command input file (.JNL). Syntax: source filename filename should be the full name of the file including the file type (preferably .jnl) and if necessary also the directory/folder path. Xtract Sesam 5-6 5.1.3 1-FEB-2011 Program version 3.0 Plot Plot active viewport to a file of specific type with optionally specified size. Choose between colour plot with white background, black and white plot and plot as shown on screen. Optionally add header and footer texts. Syntax: plot file-type-code filename [x-size] [y-size] [normal | white | bw] [header h-align] [footer f-align] Explanation of parameters: BMP file-type-code Windows bitmap EPS Encapsulated PostScript GIF Graphics Interchange Format TIF Tag Image File Format (TIFF) PPM Portable Pixelmap bitmap RGB Silicon Graphics RGB filename Name of the plot file. It need not include the file type as this will be added according to the chosen file-type-code. [x-size y-size] Plot file size given in pixels. x-size is horizontal and y-size is vertical. If the size is not given the plot size will be equal to the current size of the display area. Unless you have resized the display area this size is about 600 by 600. 400 by 400 will be a low quality (low resolution) plot, 1000 by 1000 and higher will be a high quality (high resolution) plot. The plot will be: - normal (‘Export As Is’ in GUI) which means as appearing on the screen - white (‘Export With White Background’ in GUI) which means exporting colours [normal | white | bw] with white background and black text - bw (‘Export in Black&White Mode’ in GUI) which means exporting in black & white mode [header h-align] Header text (within double-quotes when spaces) that may be aligned (adjusted) centre, left and right by setting h-align to 0, 1 and 2 respectively, e.g. "Main deck" 0 [footer f-align] Footer text (within double-quotes when spaces) that may be aligned (adjusted) centre, left and right by setting f-align to 0, 1 and 2 respectively, e.g. "Main deck" 1 5.1.4 Plotall Plot all viewports to a file of specific type with optionally specified size. Choose between colour plot with white background, black and white plot and plot as shown on screen. Syntax: plotall file-type-code filename [x-size] [y-size] [normal | white | bw] Sesam Xtract Program version 3.0 1-FEB-2011 Explanation of parameters: BMP file-type-code 5-7 Windows bitmap EPS Encapsulated PostScript GIF Graphics Interchange Format TIF Tag Image File Format (TIFF) PPM Portable Pixelmap bitmap RGB Silicon Graphics RGB filename Name of the plot file. It need not include the file type as this will be added according to the chosen file-type-code. [x-size y-size] Plot file size given in pixels. x-size is horizontal and y-size is vertical. If the size is not given the plot size will be equal to the current size of the display area. Unless you have resized the display area this size is about 600 by 600. 400 by 400 will be a low quality (low resolution) plot, 1000 by 1000 and higher will be a high quality (high resolution) plot. The plot will be: - normal (‘Export As Is’ in GUI) which means as appearing on the screen - white (‘Export With White Background’ in GUI) which means exporting colours [normal | white | bw] with white background and black text - bw (‘Export in Black&White Mode’ in GUI) which means exporting in black & white mode 5.1.5 Print Print active view. Syntax: print [normal | white | bw] Explanation of parameters: The print will be: - normal (‘Export As Is’ in GUI) which means as appearing on the screen - white (‘Export With White Background’ in GUI) which means exporting colours [normal | white | bw] with white background and black text - bw (‘Export in Black&White Mode’ in GUI) which means exporting in black & white mode Xtract Sesam 5-8 5.1.6 1-FEB-2011 Program version 3.0 Exportvtfx Export the 3D model with results (the current display scene) to a VTFx-file. See Section 3.13.1 about this feature. Syntax: exportvtfx filename [startanim] [append] [previewimage x-size y-size] filename may include the file type in which case it should be given as vtfx. The optional command ‘startanim’ starts an animation when the file is opened (in Xtract Viewer or in MS Word or PowerPoint through GLview 3D Plugin). ‘append’ appends the VTFx-file to an existing VTFx-file. Otherwise any existing VTFx-file will be overwritten. ‘previewimage’ displays a preview picture with the given pixel size when the file is opened. 5.1.7 Exportcombined Export the 3D model to a VTFx-file. This feature is designed for viewing a global model and a sub-model in superimposed mode, read more about this feature in Section 3.13.2. Syntax: exportcombined global | sub filename red green blue [surface | wireframe] [launchviewer] filename should include the file type which should be given as vtfx. When selecting command ‘global’ then a new filename should be entered. When selecting command ‘sub’ then an existing filename should be entered. The colour of the exported 3D model is specified by red, green and blue in range 0-255. Select draw model as ‘surface’ or ‘wireframe’. The program default is to use ‘surface’ for the global model and ‘wireframe’ for the sub-model. The optional command ‘launchviewer’ starts the program Xtract Viewer. 5.1.8 Rep Capture a situation to the Xtract Report Builder. See Section 3.13.3 about this feature. Syntax: rep subcommand Alternatives for subcommand: add3d title description [background red green blue] [mesh red green blue] [text red green blue] [navigationcube] [colorlegend] [infobox] addgraph title description [capturesize x-size y-size] Capture a 3D model situation Capture a graph situation addimage title description [capturesize x-size y-size] [background red green blue] Capture an image situa[mesh red green blue] [text red green blue] [navigationcube] [colorlegend] tion [infobox] addtable title description Capture a table situation Sesam Program version 3.0 Explanation of parameters: title Xtract 1-FEB-2011 5-9 Title of situation description Description of situation [capturesize x-size y-size] Size in pixels of the captured image. x-size is horizontal and y-size is vertical. If the size is not given the image size will be equal to the current size of the display area. Unless you have resized the display area this size is about 600 by 600. 400 by 400 will be a low quality (low resolution) image, 1000 by 1000 and higher will be a high quality (high resolution) image. [background red green blue] Set colour of background, red, green and blue are in range 0-255. [mesh red green blue] Set colour of mesh, red, green and blue are in range 0-255. [text red green blue] Set colour of text, red, green and blue are in range 0-255. [navigationcube] Optionally include the navigation cube in the capture. [colorlegend] Optionally include the colour legend in the capture. [infobox] Optionally include the Info box in the capture. 5.1.9 Log Start logging of commands to file or stop logging. If no file name is given then the default log file name is used. When starting Xtract logging is by default set on. Syntax: log {on | off} [filename] filename should include the file type which for general consistency should be .jnl. 5.1.10 Exit Exit from Xtract. Syntax: exit 5.1.11 Resetsettings Resets settings in the registry to default. See Section 4.1.3 for which registry settings are defined. Syntax: resetsettings Xtract 5-10 5.2 Sesam 1-FEB-2011 Program version 3.0 Display Commands These commands display model and results as well as set various display modes for such. 5.2.1 Display Display model and results. Some of the commands work both as a toggle and as an explicit command. For example: ‘display model’ will display the model (switch model display on) if the model is not displayed and remove the model (switch model display off) if the model is displayed. Syntax: display subcommand Alternatives for subcommand: model [on | off [from_part to_part]] results [on | off] perspective [on | off] surfaces [from_part to_part] lines [from_part to_part] points [from_part to_part] outline [from_part to_part] hidden [from_part to_part] mesh [on | off [from_part to_part]] meshcolor red green blue outlinemesh [on | off [from_part to_part]] expanded [on | off [from_part to_part]] smooth [on | off [from_part to_part]] transparent [on | off [from_part to_part]] alpha alpha [from_part to_part] color red green blue [from_part to_part] elementcolors [on | off] shellthickness [on | off] materials [on | off] shrunken [on | off] labellift factor viewports {1 | 2h | 2v | 4} Toggle or set display of selected parts. Toggle or set display of results. Toggle between perspective and orthographic view, or set view mode (on: perspective, off: orthographic). Display model as surfaces for selected parts. Display model as lines for selected parts. Display model as points for selected parts. Display model as outline for selected parts. Display model as hidden lines for selected parts. Toggle or set display of mesh for selected parts. Set mesh colour. red, green and blue are in range 0-255. Toggle or set display of outline mesh for selected parts. Toggle or set display of expanded (fully drawn) cross sections for selected parts. Toggle or set smooth shading for selected parts. Toggle or set transparent display for selected parts. Set transparency alpha value in range 0-255 (invisibleopaque) for selected parts. Set colours in range 0-255 for selected parts (when no results). Toggle or set element type colouring. Toggle or set display of plate/shell thickness. Toggle or set display of materials. Toggle or set shrunken mesh display mode. Lifts (moves towards you) labels (result values shown on model), local coordinate systems and principal stress vectors. By default these are lifted somewhat so as not to be hidden by the surface to which they belong. The factor allows you to scale the default (=1) lifting. Show one, two horizontal, two vertical or four viewports. Sesam Xtract Program version 3.0 1-FEB-2011 5-11 Set active viewport (when four: 1 is upper left, 2 is upper right, 3 is lower left and 4 is lower right). Copy visual attributes and model/set from one viewport to copyall {1 | 2 | 3 | 4} {1 | 2 | 3 | 4} another. copyattributes {1 | 2 | 3 | 4} {1 | 2 | 3 | 4} Copy visual attributes from one viewport to another. lighting [on | off] Toggle or set lighting. Turn each of 6 light sources on (1) or off (0). The sources are in the sequence: front, back, lower left, lower right, upper lights {1 | 0}{1 | 0}{1 | 0}{1 | 0}{1 | 0}{1 | 0} right and upper left. The default setting is ‘1 0 0 0 0 0’, i.e. front on and other light sources off. setviewport {1 | 2 | 3 | 4} Explanation of parameters: The command is valid only for parts of the model (a 1st level superelement is a part) identified by their sequence numbers according to the hierarchy of the Database winfrom_part to_part dow. No specification of parts or 0 (zero) for both parameters means all parts. See Section 3.1.25 on parts. 5.2.2 Displaysettings Set display settings. Syntax: displaysettings subcommand Alternatives for subcommand: Set number of significant digits in the range 1-17 (results are stored on the results file as 32 bit words that can represent about 7 digits only). shrinkfactor factor Set element shrink factor in range 0-1. fontsize size Set font size in the range 2-126. Default is 10. scaleeccentricity factor Set eccentricity scaling factor Use a single background colour or interpolate between top and bottom colbgcolor {single | topbottom} ours. topcolor red green blue Set top colour of background, red, green and blue are in range 0-255. bottomcolor red green blue Set bottom colour of background, red, green and blue are in range 0-255. Set colour of undeformed wireframe, red, green and blue are in range 0wireframecolor red green blue 255. beamwidth pixels Set line thickness for beam elements in range 1-10. 3 is default. numdigits number Xtract Sesam 5-12 1-FEB-2011 blacktext [on | off] readbeamexpansion [on | off] 5.2.3 Program version 3.0 Toggle or set text, numbers and pointers to black and display to black & white (grey-shading). This command corresponds to the Color / Black and White tool button and is a preview mode only and not a working mode. I.e. when selecting a new results component colours will reappear in an imperfect manner. Toggle or set reading of beam expansions when loading model. Give this command after opening the results file and before selecting the model. Note: A large model with many beams (stiffeners) may take some time to read due to the amount of sectional data. Use this command to skip this data. This involves that beam sections cannot be displayed (beam expansion is disabled). Moreover, the B-STRESS attribute will not appear as data for computing this result type is unavailable. Displayinfo Set display information. See Figure 3.42 for explanations of the various information items. Syntax: displayinfo subcommand Alternatives for subcommand: text {on | off} [text] Set user-defined text or switch it off. name [on | off] Toggle or set display of name. creationdate [on | off] Toggle or set display of creation date. datetime [on | off] Toggle or set display of current date and time. displaytype [on | off] Toggle or set display of type of display resultcase [on | off] Toggle or set display of result case name. attribute [on | off] Toggle or set display of attribute name. viewportnumber [on | off] Toggle or set display of viewport number. lengthandforceunits [on | off] Toggle or set display of length and force units. infobox [on | off] Toggle or set display of Info box in lower right corner. Toggle or set display of legend. (Both superelement legend and result leglegend [on | off] end.) Toggle or set display of superelement legend. Legend must also be on for the superelementlegend [on | off] superelement legend to be shown. modelaxes [on | off] Toggle or set display of model (superelement) coordinate axes. originaxes [on | off] Toggle or set display of origin axes. Sesam Program version 3.0 5.2.4 Xtract 1-FEB-2011 5-13 Label Enable/disable labelling of nodes, elements and materials. Syntax: label subcommand Alternatives for subcommand: nodes [on | off] elements [on | off] materials [on | off] filter [on | off] [max-to-draw] Toggle or set labelling of nodes. Toggle or set labelling of elements. Toggle or set labelling of materials. Toggle or set filtering of labels limited to max-to-draw number of labels. Draw element coordinate systems with given axes or turn off display of the coordsyst [X] [Y] [Z] [on | off] given axes. The coordinate system is drawn for the nodes of the elements. backgroundbox [on | off] Toggle or set drawing background box for labels Set the label marker (the violet dot to which labels are attached) size in the markersize size range 1-10. Default is 3. resandscanindex [on | off] Toggle or set showing SCANINDEX together with results label. scanindexformat format Set format for the SCANINDEX, i.e. the result case identification. Explanation of parameters: {1 | 0} run-prefix {1 | 0} resultcase-prefix {a | p | n} occurrence-prefix {1 | 0} phase-prefix Give 1 for showing and 0 for hiding the run and result case numbers. Give prefixes for each. format Give a, p or n for Show all, Show partial and None occurrence, respectively (see Figure 3.26). Give a prefix for the occurrence. Give 1 for showing and 0 for hiding the phase (complex results only). Give a prefix for the phase. 5.2.5 Eye Zoom, rotate and pan the model. Some of the commands expect viewport coordinates. These span the pixel part of a given window defined by coordinates (0,0) in the upper left corner, the first value is horizontal. Syntax: eye subcommand Alternatives for subcommand: Set viewpoint and view direction. This command is for logging interactive setview eye vrp vup rot zoom actions and less suitable for direct use. The parameters are explained below. rotleft degrees Rotate model to the left. rotright degrees Rotate model to the right. rotup degrees Rotate model up. rotdown degrees Rotate model down. spinleft degrees Spin model to the left. Xtract 5-14 spinright degrees rotto deg deg deg isometric {+|-} {+|-} {+|-} rotdefault panleft pixels panright pixels panup pixels pandown pixels panto xpixesl ypixels pandefault syncnav [on | off] zoomin fac zoomout fac zoomto fac zoomdefault frame storedefault [x y z] Sesam 1-FEB-2011 Program version 3.0 Spin model to the right. From position with model X-axis pointing right and Y-axis pointing up rotate about screen axes in sequence: horizontal, vertical, in/out. Rotate eye to isometric view from +/- of each model axis Rotate to default angles. Pan model to the left. Pan model to the right. Pan model up. Pan model down. Pan to position relative to the default position in the centre. Pan to default position (centre). Toggle or set synchronous navigation of the viewports. Zoom in by given factor. Zoom out by given factor. Zoom to specified factor. Zoom to default factor (which is 1). Make the model fit inside the viewport. Set default eye position vector. Stores current eye position if no arguments. Explanation of parameters: eye X-, Y- and Z-coordinates of the eye position vrp X-, Y- and Z-coordinates of a ‘view reference point’, the view direction is from eye toward vrp vup X-, Y- and Z-coordinates of a ‘view up vector’, a point defining what is up (on screen) X-, Y- and Z-coordinates of a ‘rotation point’, a point around which interactive rotations will be perrot formed zoom Zoom factor Sesam Xtract Program version 3.0 5.3 1-FEB-2011 5-15 Model Commands These commands select model and whether to display it with deformations. Also, they list model data and save model data to file. 5.3.1 Model Change display of the model. Syntax: model subcommand Alternatives for subcommand: select model-name deformed [from_part to_part] undeformed [from_part to_part] Select model. Show deformed model for selected parts. Show undeformed model for selected parts. Set deformation scale to given factor or auto-scale to a scaledeformations factor [auto] fraction of maximum model extent. addundeformedwireframe {on | off} Show or hide an undeformed wireframe model. list {nodes | elements} List model data (nodes or elements). save {nodes | elements} filename Save model data (nodes or elements) to a file. Set transformation matrix from the main geometry to ‘extra geometry’. Such ‘extra geometry’ is geometry opened as a secondary file together with a VTF-file extramodeltransformation t11 t12 t13 t14 t21 … t44 created by Wasim or Installjac. The ‘extra geometry’ may be fixed or it may follow the animation of the main geometry. In both cases its position relative to the main geometry is defined by this command. unitconversion {on|off} file-length-unit display-length-unit Set unit conversion for length and force. file-force-unit display-force-unit Explanation of parameters: from_part to_part The command is valid only for parts of the model (a 1st level superelement is a part) identified by their sequence numbers according to the hierarchy of the Database window. No specification of parts or 0 (zero) for both parameters means all parts. See Section 3.1.25 on parts. Xtract Sesam 5-16 1-FEB-2011 Program version 3.0 t11 t21 t31 t41 - The upper left 3 by 3 matrix (t11 t12 t13 t21 t22 t23 t31 t32 t34) is the cosine transformation matrix. t12 t22 t32 t42 - t14 t24 t34 are entered as 0 (zero) t11 t12 t13 t14 t21 … t44 t13 t23 t33 t43 - t41 t42 t43 are the translations in X, Y and Z in the main geometry coordinate system t14 t24 t34 t44 - t44 is the inverse scaling factor for the ‘extra geometry’, i.e. it is scaled by 1/t44 file-length-unit display-length-unit Specify the length unit of the file opened and the desired (display) length unit. Legal values are: m, mm, cm, in and ft. file-force-unit display-force-unit Specify the force unit of the file opened and the desired (display) force unit. Legal values are: N, kN, MN, kgf, lbf and kipf. 5.3.2 Section Create a section through the model. Syntax: section subcommand Alternatives for subcommand: define ID xp yp zp xn yn zn Define section through model by position and normal vector. add ID Add a section with the given ID. delete {ID | all} Delete the section with the given ID, or delete all. show ID Show the section with the given ID. hide ID Hide the section with the given ID. Sesam Program version 3.0 5.4 Set Command 5.4.1 Set Xtract 1-FEB-2011 5-17 The command manipulates sets. Sets read from file (e.g. the results file) are available for selection in the same way as sets defined within Xtract. Note: Sets read from file should not be modified by Xtract. Note: A set name is always accompanied by a number, a counter over all sets. This counter forms a part of the full set name. For example, the full name of a set named Myset may be "8: Myset". When referring to a set the counter may be skipped (sub-string matching) unless there is more than one set with the same name. This will happen in a superelement model where a 1st level superelement with sets defined by the preprocessor has been included more than once. To distinguish between sets with the same name (in for example the ‘set select’ or ‘set addexisting’ commands) use the full name within quotes. Syntax: set subcommand Alternatives for subcommand: select {setname | none} show {workingset | complement | both} new [setname] name newname [description] clear delete setname rubberbandselectionmode enclosedby | outside [touched] Select a set by its name or select no set. Show the working set, its complement or both. Create a new set, optionally giving it a name. Change name of current set, optionally giving it a description. Clear the content of the current set. Delete a set. Set rubberband/polygon/line selection mode. Specify id the rest of the model shall be shown as wire-frame when using sets. addbybeamcrosssections sections Add beam elements with given cross sections to the current set. Subtract beam elements with given cross sections from the current subtractbybeamcrosssections sections set. Intersect the current set with beam elements having the given intersectbybeamcrosssections sections cross sections. addbycoordinates minX maxX minY Add all elements located within the given coordinate ranges to the maxY minZ maxZ current set. subtractbycoordinates minX maxX minY Subtract all elements located within the given coordinate ranges maxY minZ maxZ from the current set. showcomplementmesh [on | off] Xtract 5-18 intersectbycoordinates minX maxX minY maxY minZ maxZ addbyplanes numplanes planes subtractbyplanes numplanes planes intersectbyplanes numplanes planes addbypolypartitioners numtris numedges partitioner-planes subtractbypolypartitioners numtris numedges partitioner-planes intersectbypolypartitioners numtris numedges partitioner-planes addbyresultvalues min max | {above | below} value subtractbyresultvalues min max | {above | below} value intersectbyresultvalues min max | {above | below} value addbyshellthickness min max subtractbyshellthickness min max intersectbyshellthickness min max addelement model element subtractelement model element Sesam 1-FEB-2011 Program version 3.0 Intersect all elements located within the given coordinate ranges with the current set. Add elements within the region specified by the given planes to the current set. The parameters are explained below. This command is for logging of Set > Union with > Top/Bottom/Right/Left/ Rubberband. The command is less suitable for user specification. Subtract elements within the region specified by the given planes from the current set. The parameters are explained below. This command is for logging of Set > Subtract by > Top/Bottom/Right/ Left/Rubberband. The command is less suitable for user specification. Intersect the current set with elements within the region specified by the given planes. The parameters are explained below. This command is for logging of Set > Intersect with > Top/Bottom/ Right/Left/Rubberband. The command is less suitable for user specification. Add elements within the regions specified by the given planes to the current set. This command is for logging of Set > Union with > Polygon. The command is less suitable for user specification. Subtract elements within the regions specified by the given planes from the current set. This command is for logging of Set > Subtract by > Polygon. The command is less suitable for user specification. Intersect the current set with elements within the regions specified by the given planes. This command is for logging of Set > Intersect with > Polygon. The command is less suitable for user specification. Add elements with result values within the given range to the current set. Subtract elements with result values within the given range from the current set. Intersect elements with result values within the given range with the current set. Add shell elements having thickness within the given range to the current set. Subtract shell elements having thickness within the given range from the current set. Intersect shell elements having thickness within the given range with the current set. Add element to the current set. Compared with command ‘set addelements’ the current command adds a single element. It corresponds to Set > Pick to add. Remove element from the current set. Compared with command ‘set subtractelements’ the current command subtracts a single element. It corresponds to Set > Remove to add. Sesam Xtract Program version 3.0 addelements model elements subtractelements model elements intersectelements model elements addelementtypes element-types subtractelementtypes element-types intersectelementtypes element-types addexisting setname subtractexisting setname intersectexisting setname addmaterials material-types subtractmaterials material-types intersectmaterials material-types addmodel model-name subtractmodel model-name intersectmodel model-name addvisibleelements setname subtractvisibleelements setname intersectvisibleelements setname 1-FEB-2011 5-19 Add elements of the given model to the current set. elements is a list of ranges, e.g. ‘11 7 40-55 57 60-70’. Subtract elements of the given model from the current set. Intersect the current set with elements of the given model. Add elements of given list of types to the current set. Subtract elements of given list of types from the current set. Intersect the current set with elements of given list of types. Add set with given name to the current set. Subtract set with given name from the current set. Intersect the current set with set with given name. Add elements of given list of materials to the current set. Subtract elements of given list of materials from the current set. Intersect the current set with elements of given list of materials. Add all elements of a given model to the current set. Subtract all elements of a given model from the current set. Intersect all elements of a given model with the current set. Add all visible elements to the current set. Subtract all visible elements from the current set. Intersect all visible elements with the current set. Explanation of parameters: numplanes Number of planes used in this command planes For each of the numplanes planes: four floating point (real) numbers followed by three flags. The four floating point numbers are: - A, B, C and D. These define a plane by the equation Ax + By + Cz + D = 0. - The three flags are front, on and back. Each has value 1 = yes or 0 = no to whether an element with this position relative to the plane will be selected. Xtract 5-20 5.5 Sesam 1-FEB-2011 Program version 3.0 Result Commands These commands select and manipulate results and how to present them. The latter two categories ‘createuservector’ and ‘overallvelocity’ are for a specialised feature for computing the overall vibration level for a ship. See Section 3.15.3. 5.5.1 Result Select a result case and a position/attribute/component. The selected component is automatically displayed. The command also sets display modes and parameters as well as lists and saves results data. Syntax: result subcommand Alternatives for subcommand: selectcase run case occ select pos attr comp reload peaks [on | off] values [on | off] startlabelnodes selectnode model node startlabelelements selectelement model element showresultinlabel [on | off] clearlabels contours [on | off [from_part to_part]] vectors [on | off [from_part to_part]] pstressvectors [P1] [P2] [P3] [on | off] rotangle rot-angle Select result case by giving run number, result case and occurrence. See below for explanations of parameters. Select and display result position/attribute/component. See below for explanations of parameters. Reload current result. Relevant e.g. after selecting a new set. Toggle or set display of peaks. Toggle or set display of values. A label (box) with the Nodes values of all components of the selected attribute will be added for the subsequently selected or picked nodes. See Section 3.1.12. Select a node for which a label (box) will be shown. A label (box) with the Element average values of all components of the selected attribute will be added for the subsequently selected or picked elements. See Section 3.1.12. Select an element for which a label (box) will be shown. Show or hide the result in picking labels. Clear (remove) all node and element labels (boxes). Toggle or set display of contours for selected parts. Toggle or set display of vectors for selected parts. See explanation for subcommand pstressvectors below. Turn on/off vectors for principal stress components. Note: This command does not display vectors. It is used for choosing which vectors to show when ‘result vectors on’ (or Results > Show vectors) is given. Rotate the element axis system around the surface normal the given number of degrees. Sesam Program version 3.0 Xtract 1-FEB-2011 5-21 rotclear Remove any user-defined element axis system. Specify a vector that projected onto the surface defines the new rotsetxaxis element-x-definition-vector element x-axis of the rotated element coordinate system. Specify a vector that projected onto the surface defines the new rotsetyaxis element-y-definition-vector element y-axis of the rotated element coordinate system. List result data, optionally including coordinates, all compolist [coords] [components] [resultcases] nents and all result cases. save filename [coords] [components] Save result data to a file, optionally including coordinates, all [resultcases] components and all result cases. Set maximum angular deviation (in degrees) between coordimaxcoorddev max-angular-deviation nate systems of adjacent elements for nodal averaging of stresses to be allowed. Default is 5. Set maximum thickness deviation (in percent) between adjacent maxthicknessdev max-thickness-deviation elements for nodal averaging of stresses to be allowed. Default is 10. Set step angle (in degrees) used for all cases where stepping scanstepangle scan-step-angle through complex results is performed (evaluation, combining and scanning). Default is 10. Show result point labels for all or selected result points. resultresultpoints {all | resultpoints} points is a list of ranges, e.g. ‘1-3 5’. info Show information about current result case. Delete a user defined result case, i.e. a combination, scan result deletecase name case or scaled complex case all created in Xtract Explanation of parameters: run case occ The run, resultcase and occurrence numbers, see Section 3.3 pos The result position, allowable values: Nodes, Elements, Element average, Resultpoints and Surface resultpoints. The result positions are explained in Section 3.2.1. attr The result attribute, see Section 3.2.1 and Appendix B 2 comp The result component, see Appendix B 2 from_part to_part The command is valid only for parts of the model (a 1st level superelement is a part) identified by their sequence numbers according to the hierarchy of the Database window. No specification of parts or 0 (zero) for both parameters means all parts. See Section 3.1.25 on parts. Note: Xtract always logs result positions, attributes and components as well as result case identifications in double-quotes. In a Command input file the double-quotes may be skipped unless the string includes spaces. Xtract 5-22 5.5.2 Sesam 1-FEB-2011 Program version 3.0 Contour Set contour settings. The following contour modes are available: • Datum sets a value (datum) for one contour. The other contours are set relative to this one. — The step option sets the contour increment (stepsize) above and below datum bounded by the result range. datum may be outside the result range. — The levels option determines the contour increment above and below datum bounded by the result range based on the given number of levels. • Levels sets the number of levels (contours) between the maximum and minimum result value. • Values sets any number of values. Each value will correspond to a contour. • Minmax sets values for the minimum contour (min) and maximum contour (max). Inside this range either a step size or the number of levels is given. Areas with values above the maximum are violet and below the minimum are pink. Syntax: contour subcommand Alternatives for subcommand: datum datum {step stepsize | levels number-of-levels} levels number-of-levels values value [value, …] minmax min max {step stepsize | levels number-of-levels} type [filled | lines] default 5.5.3 Set contour mode to Datum. Set contour mode to Levels. Set contour mode to Values. Set contour mode to Minmax. Toggle or set contour type to filled or lines. Use default contour settings which is Levels mode with 10 levels. Vector Set vector settings. Syntax: vector subcommand Alternatives for subcommand: Set vector scale to given factor or auto-scale to a fraction of max model extent. scale factor [auto] Default is auto-scale 0.05. scalepstress [on | off] Toggle or set scaling of principal stress vectors according to value. color red green blue Set colour of displacement vectors, red, green and blue are in range 0-255. Toggle or set display of arrow heads (crosslines for compressive principal stress vecarrows [on | off] tors and heads for displacement vectors). Set size of arrow heads relative to the default size (=1). Relevant for vectors displayed arrowsize size by command vector arrows (see above) and not for local coordinate (element) axes. Sesam Xtract Program version 3.0 5.5.4 1-FEB-2011 5-23 Shell Select shell surface or layer for results presentation. By default results for the upper surface (of layer 1 for layered element) is shown. Syntax: shell [upper | lower] [layer-number] Explanation of subcommands and parameters: [upper | lower] The upper surface is the one on positive local z-side. Skip this parameter for non-layered (normal) shell elements. The layers are numbered [layer-number] consecutively from 1 and up according to their definition. 5.5.5 Evaluation Set evaluation method for complex result cases. This setting is valid for subsequent presentations of complex results. See Section 3.4.1 for more information and Appendix B 5 for some basic theory on complex results. Note: Depending on whether the subsequently selected component is linear (harmonic) or not only certain evaluation methods are relevant as explained below. Non-linear (non-harmonic) components are typically von Mises stress and principal stress. Syntax: evaluation real | imaginary | magnitude | phaseshift | phase angle | maximum | phaseofmax Explanation of subcommands and parameters: The real part of the result (corresponding to phase angle 0), for linear (harmonic) comporeal nents only The imaginary part of the result (corresponding to phase angle 270 or 90), for linear (harimaginary monic) components only magnitude phaseshift phase angle maximum phaseofmax 5.5.6 The magnitude (amplitude) of the result (sqrt(R2+I2)), for linear (harmonic) components only The phase shift (in degrees) of the result (atan(I/R)). I.e. the shift between the phase of the load and the phase of the result. For linear (harmonic) components only. The phase angle (in degrees) for evaluation is given explicitly. For all components. The maximum through the cycle (360 degrees) of a non-linear (non-harmonic) component, i.e. a principal stress or von Mises stress. Also used for Nodes/DISPLACEMENT/ALL. The phase (in degrees) giving maximum through the cycle (360 degrees) of a non-linear (non-harmonic) component. Also used for Nodes/DISPLACEMENT/ALL. Combine Combine selected result cases with factors into a new result case. The new result case will contain the given result position/attribute only (and all components of this). Xtract Sesam 5-24 1-FEB-2011 Program version 3.0 • Extend an already created and incomplete combination (i.e. ‘combine all’ has not been used) with new attributes by the ‘combine add’ command; see Section 5.5.7. • For creating a complete combination including all result positions/attributes use the ‘combine all’ command; see Section 5.5.8. • Create a square root of sum-of-squares type of combination (see subsection Square Root of Sum-ofSquares Combination for Elements/G-STRESS of Section 3.1.17) by the ‘combine sqrt’ command; see Section 5.5.9. Note: Not more than one complex result case may contribute to a combination. See Appendix B 5 for some basic theory on postprocessing complex results. Syntax: combine name [[abs] {max | min} | angle] … run case occ factor … … run case occ factor … pos attr [comp] … … continue for all result cases to be combined. Explanation of subcommands and parameters: Name of the combination to create. If the name includes blanks use doublename quotes: "Combination A". The combination is put in a run named User. The occurrence will be 1. Evaluate the optional single complex result cases for the (absolute) maximum or minimum value of pos/attr/comp. Alternatively, evaluate for a given phase angle. Note that this evaluation is irrelevant and should be skipped when no [[abs] {max | min} | angle] complex result cases contribute to the combination. See Figure 3.60 for an illustration of the meaning of absolute maximum/minimum. Omitting ‘abs’ corresponds to true in the figure. Give the result position/attribute/component for which the combination will be created. Example: Elements G-STRESS SIGXX. Note that ‘comp’ is irrelpos attr [comp] evant and should be skipped when no complex result cases contribute to the combination. Each result case to include in the combination is identified by run number, result case and occurrence. Each may be enclosed by double-quotes. Doublerun case occ quotes are required only if blanks are contained. Example: 1 3 "2: Excit. freq. 2 Hz". Occurrence may be abbreviated as long as it is unique: 1 3 2: is equivalent to the above. Each result case is multiplied (scaled) by ‘factor’ before being added to the factor combination. 5.5.7 Combine add Add an attribute to a previously created combination. This is irrelevant for combinations including a complex result case. Sesam Xtract Program version 3.0 Syntax: combine add 1-FEB-2011 name pos 5-25 attr Explanation of parameters: Name of the combination to extend. If the name includes blanks use double-quotes: "Comname bination A". This must previously have been created. Give the result position/attribute with which the combination will be extended. Example: pos attr Elements G-STRESS. 5.5.8 Combine all Combine selected result cases with factors into a new result case. The new result case will contain all result positions/attributes available in all selected result cases. (Use Combine in Section 5.5.6 to combine a single result position/attribute.) Note: A specific phase angle must be given if one of the result cases is complex. I.e. the optional single complex result cases cannot be evaluated for the (absolute) maximum or minimum value of all its attributes/components at the same time. An attempt at violating this restriction by entering for example the command ‘combine all Comb1 max …’ will result in phase angle zero being used. Syntax: combine all name {angle | nocomplex} … … run case occ factor … … run case occ factor … … continue for all result cases to be combined. Explanation of subcommands and parameters: Name of the combination to create. If the name includes blanks use double-quotes: name "Combination A". The combination is put in a run named User. The occurrence will be 1. Evaluate the optional single complex result cases for the given phase angle. If no {angle | nocomplex} complex result case is included give the command nocomplex. Each result case to include in the combination is identified by run number, result case and occurrence. Each may be enclosed by double-quotes. Double-quotes are required run case occ only if blanks are contained. Example: 1 3 "2: Excit. freq. 2 Hz". Occurrence may be abbreviated as long as it is unique: 1 3 2: is equivalent to the above. Each result case is multiplied (scaled) by ‘factor’ before being added to the combinafactor tion. Xtract Sesam 5-26 5.5.9 1-FEB-2011 Program version 3.0 Combine sqrt Create a square root of sum-of-squares type of combination of selected result cases with factors. The combination can only be created for Elements/G-STRESS and Elements/D-STRESS components. The square root of sum-of-squares type of combination is explained in Section 3.15.2. Note: The square root of sum-of-squares combination cannot be used when one of the resultcases is complex. Syntax: combine sqrt name pos attr … run case occ factor … … run case occ factor … … … continue for all result cases to be combined. Explanation of subcommands and parameters: Name of the combination to create. If the name includes blanks use doublename quotes: "Combination A". The combination is put in a run named User. The occurrence will be 1. Give the result position/attribute for which the combination will be created. pos attr Currently only position Elements and attribute G-STRESS are allowed. Each result case to include in the combination is identified by run number, result case and occurrence. Each may be enclosed by double-quotes. Doublerun case occ quotes are required only if blanks are contained. Example: 1 3 "2: Excit. freq. 2 Hz". Occurrence may be abbreviated as long as it is unique: 1 3 2: is equivalent to the above. Each result case is multiplied (scaled) by ‘factor’ before being added to the factor combination. 5.5.10 Scan Scan selected result cases for the (absolute) maximum or minimum value of a given result position/attribute/ component. A new result case will be created. This scan result case will contain all components of the given result position/attribute. Syntax: scan name [abs] {max | min} pos attr comp … run case occ criterion | phase factor … … run case occ criterion | phase factor … … continue for all result cases to be scanned. … Sesam Xtract Program version 3.0 1-FEB-2011 5-27 Explanation of subcommands and parameters: Name of the scan result case to create. If the name includes blanks use doublename quotes: "Scan A". The scan result case is put in a run named User. The occurrence will be 1. [abs] {max | min} Scan the result cases for the (absolute) maximum or minimum value. Give the result position/attribute/component for which scanning will be performed. pos attr comp Example: Elements G-STRESS SIGXX Each result case to scan is identified by run number, result case and occurrence. Each may be enclosed by double-quotes. Double-quotes are required only if blanks run case occ are contained. Example: 1 3 "2: Excit. freq. 2 Hz". Occurrence may be abbreviated as long as it is unique: 1 3 2: is equivalent to the above. This is irrelevant for non-complex (e.g. static) result cases, for such cases enter a dummy value 0 for ‘phase’. Complex result cases, however, need to be evaluated (see 5.5.5 Evaluation). Subcommand ‘criterion’ involves that the evaluation is percriterion | phase formed in accordance with the scan criterion itself. I.e. for [abs] {max | min} of pos/ attr/comp. This is normally what you want to do. Alternatively, entering a value for ‘phase’ allows evaluation to be performed for a specific phase angle. factor Each result case is multiplied by ‘factor’ prior to scanning. 5.5.11 Scale Scale a complex result case. This is typically relevant for scaling results corresponding to the unit wave heights of a frequency domain analysis up to actual wave heights. A new result case will be created. Syntax: scale run case occ name factor Explanation of parameters: run name factor case occ The result case to scale is identified by run number, result case and occurrence. Each may be enclosed by double-quotes. Double-quotes are required only if blanks are contained. Example: 1 3 "2: Excit. freq. 2 Hz". Occurrence may be abbreviated as long as it is unique: 1 3 2: is equivalent to the above. Name of the new complex result case. If the name includes blanks use doublequotes: "Scaled A". The scaled complex result case is put in a run named User. The occurrence will be 1. Scaling factor 5.5.12 Createuservector Create a vector result with given values in given sets. This command is used in connection with the specialised feature for computing overall vibration level for a ship. See Section 3.15.3. Syntax: createuservector name setname x-value y-value z-value [setname x-value y-value z-value […]] Xtract Sesam 5-28 1-FEB-2011 Program version 3.0 Explanation of parameters: name Name of the new vector result setname Name of an existing set for which the subsequent values are defined x-value y-value z-value Values of the new vector result for the given set 5.5.13 Overallvelocity Create a result case containing the overall velocity level. This command is used in connection with the specialised feature for computing overall vibration level for a ship. See Section 3.15.3. Syntax: overallvelocity name tipvortexcase minfreq maxfreq run case factor … … [minfreq maxfreq run case factor […]] Explanation of parameters: name Name of the new result case containing the overall velocity level tipvortexcase Name of a vector result case created by the createuservector command minfreq maxfreq Frequency range contributing to the overall velocity level run case factor Result case with factor contributing to overall velocity level 5.6 Graph Commands 5.6.1 Graph Draw graph or modify graph settings. Syntax: graph subcommand Alternatives for subcommand: Draw a graph of the values of the previously selected nodes. nodes [add] name run case occ pos attr comp name is the name of the curve. The curve is optionally added to a graph containing previously created curves. Draw a graph of the values of the previously selected beams. beams [add] name run case occ pos attr comp name is the name of the curve. The curve is optionally added to a graph containing previously created curves. Draw a graph of the values of the selected node over occuroccurrences [add] name pos attr comp occurr rences. See explanation of parameter occurr below. xscale min max unit Set X-axis scaling. yscale min max unit Set Y-axis scaling. title title Set graph title. xtitle title Set X-axis title. ytitle title Set Y-axis title. Sesam Program version 3.0 Xtract 1-FEB-2011 5-29 legend [on | off] transparent [on | off] stippled [on | off] grid [on | off] Toggle or set display of graph legend. Toggle or set transparency of graph. Toggle or set drawing of stippled lines. Toggle or set drawing of grid lines. Toggle or set display of minimum and maximum values on minmax [on | off] the axes. Set background colour of graph, red, green and blue are in color red green blue range 0-255. Draw graph in upper right corner, entire viewport or not at show {upperright | entire | none} all. Add a node identified by model name and node number to the current selection. The exclusive option involves replacing the current selection. The expand option involves adding selectnode [exclusive | expand] model node to the current selection all nodes on a line (a straight as possible path) between the last selected node (in a previous command) and the selected node. Add a beam element identified by model name and beam (element) number to the current selection. The exclusive option involves replacing the current selection. The expand selectbeam [exclusive | expand] model beam option involves adding to the current selection all beams on a line (a straight as possible path) between the last selected beam (in a previous command) and the selected beam. clearselection Clear selected items. clearitem item-number Remove a specific item. itemlabels [on | off] Toggle or set node/element numbers along curves Export the curves to a text file (specify file extension, e.g. export filename txt). Open VTF-file with 2D series data. This file is inextricably openfile filename tied to a VTF-file opened with File > Open. Draw a graph of selected data taken from a VTF-file with filecurve [add] series-ID curve-ID 2D series data, see the openfile command above. Explanation of parameters: A list of all occurrences. Each occurrence is identified by run number, result case and occurrence occurr as follows: run1 case1 occ1 [run2 case2 occ2 […]] 5.7 Animation Commands 5.7.1 Animation An animation sequence is set up and played for the selected result case(s) and position/attribute/component. While the animation is played the model with results may be rotated and zoomed and settings such as defor- Xtract Sesam 5-30 1-FEB-2011 Program version 3.0 mation scaling and result settings may be modified. However, the animation is only available until another result case or position/attribute/component is selected. Syntax: animation subcommand Alternatives for subcommand: Setup frequency domain (complex) animation. Setup animation over all occurrences (for cases all [except list-of-case-indices] [skip number] time domain results). Setup mode shape animation, can also be modeshape num-steps used for static results. maxfps number Set maximum number of frames per second. start Start current animation. stop Stop current animation. backward Play current animation backward. step Step forward. stepbackward Step backward. pause Pause animation. end End animation and return to static display. Save animation to AVI-file using current setsaveavi filename tings. Save animation to GIF-file using current setsavegif filename tings. Set image size for animation to save (give 1 savesize x-size y-size to use current view size). Toggle or set cycling (back and forth) for anisavecycle [on | off] mation to save. Set number of loops for saved animated GIF saveloops [forever | loops] sequence. Set frame repeat (number of times each frame is stored) for animation to save. saveframerepeat repeats [firstframerepeat] [lastframerepeat] Optionally also number of repeats for first and last frames. Set target frame rate for animation to save saveframerate max-frames-per-second (give 1 to use current maxfps). Toggle or set transparent background for savetransparent [on | off] saved animated GIF sequence. frequency start-angle stop-angle skip-by Sesam Program version 3.0 APPENDIX A A1 Xtract 1-FEB-2011 A-1 TUTORIAL EXAMPLES Plate Connection with Bracket This is the example used in Section 3.1 Getting Started. The GeniE, Prefem and Patran-Pre inputs required to create the model (in three slightly different alternatives) are provided. A 1.1 GeniE Input The model displayed by GeniE is shown in Figure A.1. The loads are shown by Prefem in Figure A.3. A.1 Beam (T-section) Beam (flatbar) Beam (L-section) Translations fixed along these adges - 15 - Plate thicknesses - 10 - - 20 - Figure A.1 The concept model displayed by GeniE Xtract A-2 Sesam 1-FEB-2011 Program version 3.0 The GeniE input: A.7.2 // GeniE input for creating a model of a plate connection with bracket GenieRules.Units.setDatabaseUnits("mm", "N", "delC"); GenieRules.Units.setInputUnit(Length, "mm"); GenieRules.Units.setInputUnit(Force, "N"); GenieRules.Units.setInputUnit(TempDiff, "delC"); GenieRules.Tolerances.useTolerantModelling = true; // Define sections, material and plate thicknesses Flatbar = BarSection(6,60); Girder = UnsymISection(180,10,11,5.5,10,80,40,20); Stiff = LSection(90,40,8,20); Steel = Material(0,7.85e-9,2.1e5,0.3,0,0); Th10 = Thickness(10); Th15 = Thickness(15); Th20 = Thickness(20); // Set defaults for subsequent modelling Stiff.setDefault(); Steel.setDefault(); Th20.setDefault(); // Create horizontal plate Bm1 = Beam(Point(0,0,0),Point(1800,0,0)); Bm2 = Bm1.copyTranslate(Vector3d(0,480,0)); Bm3 = Bm1.copyTranslate(Vector3d(0,1150,0)); Bm2.section = Girder; Pl1 = Plate(Point(0,0,0),Point(1800,0,0),Point(1800,1150,0),Point(0,1150,0)); Bm1.setBeamOffset(Vector3d(0,0,-61.47058824)); Bm2.setBeamOffset(Vector3d(0,0,-124.6261682)); Bm3.setBeamOffset(Vector3d(0,0,-61.47058824)); // Create vertical plate by copying and moving Bm4 = Bm1.copyRotate(Point(0,0,0),Vector3d(0,1150,0),90); Bm5 = Bm2.copyRotate(Point(0,0,0),Vector3d(0,1150,0),90); Bm6 = Bm3.copyRotate(Point(0,0,0),Vector3d(0,1150,0),90); Pl2 = Pl1.copyRotate(Point(0,0,0),Vector3d(0,1150,0),90); Pl2.thickness = Th15; autoMSet = Set(); autoMSet.clear(); autoMSet.add(Pl2); autoMSet.add(Bm4); autoMSet.add(Bm5); autoMSet.add(Bm6); autoMSet.moveTranslate(Vector3d(0,0,1800),geUNCONNECTED); Delete(autoMSet); // Further modelling FEdge1a = FeatureEdge(Point(600,0,0),Point(600,480,0)); FEdge1b = FeatureEdge(Point(600,480,0),Point(600,1150,0)); FEdge2a = FeatureEdge(Point(1000,0,0),Point(1000,480,0)); FEdge2b = FeatureEdge(Point(1000,480,0),Point(1000,1150,0)); FEdge3a = FeatureEdge(Point(1200,0,0),Point(1200,480,0)); FEdge3b = FeatureEdge(Point(1200,480,0),Point(1200,1150,0)); FEdge4a = FeatureEdge(Point(1800,0,0),Point(1800,480,0)); Sesam Program version 3.0 Xtract 1-FEB-2011 A-3 FEdge4b = FeatureEdge(Point(1800,480,0),Point(1800,1150,0)); FEdge5a = FeatureEdge(Point(0,0,0),Point(0,480,0)); FEdge5b = FeatureEdge(Point(0,480,0),Point(0,1150,0)); FEdge6a = FeatureEdge(Point(0,0,600),Point(0,480,600)); FEdge6b = FeatureEdge(Point(0,480,600),Point(0,1150,600)); FEdge7a = FeatureEdge(Point(0,0,1000),Point(0,480,1000)); FEdge7b = FeatureEdge(Point(0,480,1000),Point(0,1150,1000)); FEdge8a = FeatureEdge(Point(0,0,1200),Point(0,480,1200)); FEdge8b = FeatureEdge(Point(0,480,1200),Point(0,1150,1200)); FEdge9a = FeatureEdge(Point(0,0,1800),Point(0,480,1800)); FEdge9b = FeatureEdge(Point(0,480,1800),Point(0,1150,1800)); Pl3 = Plate(Point(0,480,0),Point(1200,480,0),Point(1200,480,1200), Point(0,480,1200)); Pl3.thickness = Th10; Point1 = Point(1800,480,1800); Curve1 = GuideCircle(Point(1800,480,1800), Point(0,480,1800),Point(1800,480,0)); Pl3.explode(IndexedNameMask(4)); Pl3.explode(IndexedNameMask(4)); FEdge10 = FeatureEdge(Curve1); Pl3.explode(IndexedNameMask(4)); Delete(Pl5); Flatbar.setDefault(); Bm7 = CurvedBeam(ModelCurve(Point(1200,480,102.9437252), Point(527.2077939,480,527.2077939), Point(102.9437252,480,1200))); FEdge11 = FeatureEdge(Point(1200,480,0),Point(1200,480,102.9437252)); FEdge12 = FeatureEdge(Point(0,480,1200),Point(102.9437252,480,1200)); FEdge13 = FeatureEdge(Point(0,480,0),Point(1800,480,1800)); Bm3.explode(IndexedNameMask(8)); Bm1.explode(IndexedNameMask(12)); Bm2.explode(IndexedNameMask(16)); Bm4.explode(IndexedNameMask(20)); Bm5.explode(IndexedNameMask(24)); Bm6.explode(IndexedNameMask(28)); Bm7.explode(IndexedNameMask(32)); // Set mesh densities Me1 = NumberOfElements(1); Me3 = NumberOfElements(3); Me4 = NumberOfElements(4); Mex = NumberOfElements(11); FEdge1a.numberOfElements = Me3; FEdge1b.numberOfElements = Me3; FEdge2a.numberOfElements = Me3; FEdge2b.numberOfElements = Me3; FEdge3a.numberOfElements = Me3; FEdge3b.numberOfElements = Me3; FEdge4a.numberOfElements = Me3; FEdge4b.numberOfElements = Me3; FEdge5a.numberOfElements = Me3; FEdge5b.numberOfElements = Me3; FEdge6a.numberOfElements = Me3; FEdge6b.numberOfElements = Me3; Xtract A-4 Sesam 1-FEB-2011 Program version 3.0 FEdge7a.numberOfElements = Me3; FEdge7b.numberOfElements = Me3; FEdge8a.numberOfElements = Me3; FEdge8b.numberOfElements = Me3; FEdge9a.numberOfElements = Me3; FEdge9b.numberOfElements = Me3; FEdge11.numberOfElements = Me1; FEdge12.numberOfElements = Me1; FEdge13.numberOfElements = Me4; Bm8.numberOfElements = Me4; Bm9.numberOfElements = Me4; Bm10.numberOfElements = Me4; Bm11.numberOfElements = Me4; Bm12.numberOfElements = Me4; Bm13.numberOfElements = Me4; Bm14.numberOfElements = Me4; Bm15.numberOfElements = Me4; Bm16.numberOfElements = Me4; Bm17.numberOfElements = Me4; Bm18.numberOfElements = Me4; Bm19.numberOfElements = Me4; Bm20.numberOfElements = Me4; Bm21.numberOfElements = Me4; Bm22.numberOfElements = Me4; Bm23.numberOfElements = Me4; Bm24.numberOfElements = Me4; Bm25.numberOfElements = Me4; Bm26.numberOfElements = Me4; Bm27.numberOfElements = Me4; Bm28.numberOfElements = Me4; Bm29.numberOfElements = Me4; Bm30.numberOfElements = Me4; Bm31.numberOfElements = Me4; Bm32.numberOfElements = Mex; Bm33.numberOfElements = Mex; // Make sets Deck = Set(); Deck.add(Pl1); Bulkhead = Set(); Bulkhead.add(Pl2); Bracket = Set(); Bracket.add(Pl4); // Boundary conditions Sc1 = SupportCurve(ModelCurve(Point(0,0,0),Point(0,575,0),Point(0,1150,0))); Sc2 = SupportCurve(ModelCurve(Point(0,0,1800),Point(0,575,1800), Point(0,1150,1800))); Sc1.boundary = BoundaryCondition(Fixed, Fixed, Fixed, Free, Free, Free); Sc2.boundary = BoundaryCondition(Fixed, Fixed, Free, Free, Free, Free); // Loads LC1 = LoadCase(); LLoad1 = LineLoad(LC1, Point(1800,0,0), Point(1800,1150,0), 200, 0, 0, 200, 0, 0); LC2 = LoadCase(); Sesam Program version 3.0 Xtract 1-FEB-2011 A-5 LLoad2 = LineLoad(LC2, Point(1800,0,0), Point(1800,1150,0), 0, 0, 10, 0, 0, 10); LC3 = LoadCase(); PLoad1 = PointLoad(LC3, Point(1800,0,0), 0, 0, 0, 0, 720000, 0); PLoad2 = PointLoad(LC3, Point(1800,480,0), 0, 0, 0, 0, 1725000, 0); PLoad3 = PointLoad(LC3, Point(1800,1150,0), 0, 0, 0, 0, 1005000, 0); LC4 = LoadCase(); SLoad1 = FlatSurfaceLoad(LC4, 0 , 0 , -0.015 , Point(0,0,0), Point(1800,0,0), Point(1800,1150,0), Point(0,1150,0)); SLoad2 = FlatSurfaceLoad(LC4, -0.01275 , 0 , 0 , Point(0,0,600), Point(0,0,0), Point(0,1150,0), Point(0,1150,600)); SLoad3 = FlatSurfaceLoad(LC4, -0.009 , 0 , 0 , Point(0,0,1000), Point(0,0,600), Point(0,1150,600), Point(0,1150,1000)); SLoad4 = FlatSurfaceLoad(LC4, -0.00675 , 0 , 0 , Point(0,0,1200), Point(0,0,1000), Point(0,1150,1000), Point(0,1150,1200)); SLoad5 = FlatSurfaceLoad(LC4, -0.00375 , 0 , 0 , Point(0,0,1800), Point(0,0,1200), Point(0,1150,1200), Point(0,1150,1800)); Analysis1 = Analysis(true); Analysis1.add(MeshActivity()); Analysis1.add(LinearAnalysis()); Analysis1.add(LoadResultsActivity()); A 1.2 Prefem Input The FE model as displayed by Prefem is shown in Figure A.2 while the loads are shown in Figure A.3. A.2 Figure A.2 The FE model displayed by Prefem Xtract A-6 Sesam 1-FEB-2011 Program version 3.0 A.3 Figure A.3 The loads displayed by Prefem The Prefem input: % Prefem input for creating a model of a plate connection with bracket % GENERATE SURFACE A 1 3 1 12 1 3 1 3 1 3 1 12 CARTESIAN 0 0 0 1200 0 0 600 0 0 END 0 480 0 0 670 0 END 0 0 1200 0 0 600 END % DEFINE SET DECK UNION-WITH SURFACES AU&&1 END END BULKHEAD UNION-WITH SURFACES AS1&& END END .. % Sesam Program version 3.0 Xtract 1-FEB-2011 DELETE GEOMETRY ( ALL-SURFACES-INCLUDED EXCLUDE DECK BULKHEAD ) .. % CUT AI122 PREDEFINED-PLANE YZ-PLANE 80 CUT AK221 PREDEFINED-PLANE XY-PLANE 80 % DEFINE ARC ARC1 PO0 PO1 AP323 22 END SURFACE SU0 AI121 AK221 ARC1 AI122 AK121 .. DEFINE LINE CUTLINE AP323 AP121 1 .. CUT SU0 CUTLINE DEFINE SET BRACKET UNION-WITH SURFACES ( SU1 SU2 ) END END .. % DELETE GEOMETRY ( ALL-LINES-INCLUDED ALL-POINTS-INCLUDED EXCLUDE AP323 ) .. % PROPERTY THICKNESS DECK 20 BULKHEAD 15 BRACKET 10 .. % PROPERTY SECTION FLATBAR BAR 6 60 60 1 1 GIRDER I 180 11 10 10 80 20 1 1 STIFF L 90 8 40 20 1 1 NEGATIVE .. CONNECT SECTION FLATBAR ( ARC1 LI2 ) SECTION GIRDER ( AI&21 AK12& ) SECTION STIFF ( AI&11 AI&31 AK11& AK13& ) .. % PROPERTY LOCAL-COORDINATE-BEAM ZX-PLANE +X-GLOBAL-INFINITY AK1* .. % PROPERTY ECCENTRICITY-BEAM ( AI&21 AK12& AI&11 AI&31 AK11& AK13& ) CALCULATED-NEGATIVE-Z-OFFSET .. % PROPERTY MATERIAL STEEL ELASTIC 2.1E5 0.3 7.85E-9 0.0 0 .. CONNECT MATERIAL STEEL ( ALL-SURFACES-INCLUDED ALL-LINES-INCLUDED ) .. % SET ELEMENT-TYPE SURFACE ALL-SURFACES-INCLUDED SHELL-8NODES LINE ( ARC1 LI2 AI&21 AK12& AI&11 AI&31 AK11& AK13& ) BEAM-3NODES .. % SET NUMBEROF-ELEMENTS AI2&1 4 AK1&2 4 .. A-7 Xtract A-8 Sesam 1-FEB-2011 Program version 3.0 % SET ELEMENT-LENGTH-RATIO AI1&1 LI2 AI2&1 AK1&1 ARC1 AK1&2 .. ARITHMETRIC-SEQUENCE ARITHMETRIC-SEQUENCE ARITHMETRIC-SEQUENCE ARITHMETRIC-SEQUENCE ARITHMETRIC-SEQUENCE ARITHMETRIC-SEQUENCE 4 1.0 PO2 4 1 1 4 4 1 PO2 4 1 1 4 % PROPERTY BOUNDARY-CONDITION AJ1&1 FIX FIX FIX FREE FREE FREE GLOBAL .. PROPERTY BOUNDARY-CONDITION AJ1&3 FIX FIX FREE FREE FREE FREE GLOBAL .. % PROPERTY LOAD 1 LINE-LOAD AJ3&1 GLOBAL 200 0 0 END MIDDLE-SURFACE-SHELL-ELEMENT .. PROPERTY LOAD 2 LINE-LOAD AJ3&1 GLOBAL 0 0 10 END MIDDLE-SURFACE-SHELL-ELEMENT .. PROPERTY LOAD 3 LINE-MOMENT AJ3&1 GLOBAL 0 3000 0 END MIDDLE-SURFACE-SHELL-ELEMENT .. PROPERTY LOAD 4 NORMAL-PRESSURE ( AS* AU* ) LINEAR-2POINTS-VARYING AP111 0.015 AP113 0.003 END MIDDLE-SURFACE .. % MESH ALL A 1.3 Patran-Pre Input The FE model created by the following Patran-Pre input is more or less the same as the one displayed by Prefem in Figure A.2 and Figure A.3. Note that after reading the input into Patran-Pre you should interactively write the Input Interface File (T#.FEM) by the following operation in Patran-Pre: Application: Analysis: Analyze - Selected Model - Interface file The Patran-Pre input: $ Patran-Pre input for creating a model of a plate connection with a bracket $ db_set_pref( 303, 3, 0, FALSE, 0.60000002, "" ) ga_view_aa_set( -67., 0., -34. ) point_size( 9 ) $ $ Define geometry $ STRING asm_create_line_xyz_created_ids[VIRTUAL] Sesam Program version 3.0 Xtract 1-FEB-2011 A-9 asm_const_line_xyz( "1", "<0 480 0>", "[0 0 0]", "Coord 0", @ asm_create_line_xyz_created_ids ) $ asm_const_line_xyz( "2", "<0 670 0>", "Point 2", "Coord 0", @ asm_create_line_xyz_created_ids ) $ STRING sgm_sweep_surface_e_created_ids[VIRTUAL] sgm_const_surface_extrude( "1", "<1200 0 0>", 1., 0., "[0 0 0]", "Coord 0", @ "Curve 1 2", sgm_sweep_surface_e_created_ids ) $ sgm_const_surface_extrude( "3", "<600 0 0>", 1., 0., "[0 0 0]", "Coord 0", @ "Surface 1.2 2.2", sgm_sweep_surface_e_created_ids ) $ sgm_const_surface_extrude( "5", "<0 0 1200>", 1., 0., "[0 0 0]", "Coord 0", @ "Curve 1 2", sgm_sweep_surface_e_created_ids ) $ sgm_const_surface_extrude( "7", "<0 0 600>", 1., 0., "[0 0 0]", "Coord 0", @ "Surface 5.2 6.2", sgm_sweep_surface_e_created_ids ) $ STRING sgm_transform_point_created_ids[VIRTUAL] asm_transform_grid_translate( "16", "< 0 0 80>", "Coord 0", 1, FALSE, FALSE, @ "Point 5", sgm_transform_point_created_ids ) $ asm_transform_grid_translate( "17", "< 80 0 0>", "Coord 0", 1, FALSE, FALSE, @ "Point 11", sgm_transform_point_created_ids ) $ asm_transform_grid_translate( "18", "< 1800 0 0>", "Coord 0", 1, FALSE, @ FALSE, "Point 14", sgm_transform_point_created_ids ) $ STRING sgm_create_curve_2d_created_ids[VIRTUAL] sgm_const_curve_2d_arc2point_v2( "3", 1, 0., FALSE, FALSE, 1, "Coord 0.2", @ "Point 18", "Point 16", "Point 17", FALSE, sgm_create_curve_2d_created_ids ) $ STRING sgm_curve_break_par_created_ids[VIRTUAL] sgm_edit_curve_break_parametric( "4", 0.5, "Curve 3", TRUE, @ sgm_curve_break_par_created_ids ) $# Question from application SGM $# Do you wish to delete the original curves? $? YES 38000217 $ STRING sgm_surface_2curve_created_ids[VIRTUAL] sgm_const_surface_2curve( "9", "Surface 1.3", "Curve 4", @ sgm_surface_2curve_created_ids ) $ sgm_const_surface_2curve( "10", "Surface 5.3", "Curve 5", @ sgm_surface_2curve_created_ids ) $ $ Geomodel finished $ $ Define mesh seed $ ui_exec_function( "mesh_seed_display_mgr", "init" ) Xtract A-10 Sesam 1-FEB-2011 Program version 3.0 mesh_seed_create( "Curve 1 2", 1, 3, 0., 0., 0. ) mesh_seed_create( "Surface 1.1 5.1", 3, 12, 0.25, 0., 0. ) mesh_seed_create( "Surface 3.1 7.1", 3, 4, 4., 0., 0. ) mesh_seed_create( "Curve 4", 3, 11, 4., 0., 0. ) mesh_seed_create( "Curve 5", 3, 11, 0.25, 0., 0. ) mesh_seed_create( "Surface 9.3", 1, 1, 0., 0., 0. ) mesh_seed_create( "Surface 10.3", 1, 1, 0., 0., 0. ) mesh_seed_create( "Surface 9.1", 1, 4, 0., 0., 0. ) $ $ Define mesh $ INTEGER fem_create_mesh_surfa_num_nodes INTEGER fem_create_mesh_surfa_num_elems STRING fem_create_mesh_s_nodes_created[VIRTUAL] STRING fem_create_mesh_s_elems_created[VIRTUAL] fem_create_mesh_surf_4( "IsoMesh", 49152, "Surface 1:10", 1, ["100.0"], @ "Quad8", "#", "#", "Coord 0", "Coord 0", fem_create_mesh_surfa_num_nodes, @ fem_create_mesh_surfa_num_elems, fem_create_mesh_s_nodes_created, @ fem_create_mesh_s_elems_created ) $ mesh_seed_display_mgr.erase( ) INTEGER fem_create_mesh_curve_num_nodes INTEGER fem_create_mesh_curve_num_elems STRING fem_create_mesh_c_nodes_created[VIRTUAL] STRING fem_create_mesh_c_elems_created[VIRTUAL] fem_create_mesh_curv_1( "Surface 1.1 3.1 1.3 3.3 2.3 4.3 5.1 7.1 5.3 7.3 6" // @ ".3 8.3 Curve 4 5", 16384, 100., "Bar3", "#", "#", "Coord 0", "Coord 0", @ fem_create_mesh_curve_num_nodes, fem_create_mesh_curve_num_elems, @ fem_create_mesh_c_nodes_created, fem_create_mesh_c_elems_created ) $ REAL fem_equiv_all_x_equivtol INTEGER fem_equiv_all_x_segment fem_equiv_all_group3( [" "], 0, "", 1, 0.60000002, FALSE, @ fem_equiv_all_x_equivtol, fem_equiv_all_x_segment ) $ $ Material and properties $ material.create( "Analysis code ID", 32, "Analysis type ID", 1, "steel", 0, @ "Date: 09-Aug-04 Time: 14:08:06", "Isotropic", 1, "Directionality", @ 1, "Linearity", 1, "Homogeneous", 0, "Linear Elastic", 1, @ "Model Options & IDs", ["None", "", "", "", ""], [30, 0, 0, 0, 0], @ "Active Flag", 1, "Create", 10, "External Flag", FALSE, "Property IDs", [ @ "Elastic Modulus", "Poisson Ratio", "Density", "Structural Damping Coeff", @ "Thermal Expansion Coeff"], [2, 5, 16, 30, 24, 0], "Property Values", ["2.1E5" @ , "0.3", "7.85E-9", "0", "0", ""] ) $ elementprops_create( "bracket10", 51, 25, 35, 1, 1, 20, [13, 1080, 1071, 20], @ [5, 1, 3, 9], ["m:steel", "10", "", ""], "Surface 9 10" ) $ elementprops_create( "plate15", 51, 25, 35, 1, 1, 20, [13, 1080, 1071, 20], [ @ 5, 1, 3, 9], ["m:steel", "15", "", ""], "Surface 5:8" ) $ Sesam Program version 3.0 Xtract 1-FEB-2011 A-11 elementprops_create( "plate20", 51, 25, 35, 1, 1, 20, [13, 1080, 1071, 20], [ @ 5, 1, 3, 9], ["m:steel", "20", "", ""], "Surface 1:4" ) $ $ Define beam cross sections $ beam_section_create( "bar6_60", "BAR", ["60", "6"] ) $ elementprops_create( "flatbar", 13, 30, 42, 1, 1, 20, [13, 39, 6, 2097, 2098, @ 2081, 7613, 2082, 7614], [5, 11, 2, 1, 1, 2, 2, 2, 4], ["m:steel", "bar6_60", @ "<1 0 0>", "", "", "", "", "", ""], "Curve 4 5" ) $ beam_section_create( "T_180_80", "T", ["80", "180", "10", "10"] ) $ elementprops_create( "girder", 13, 20, 42, 1, 1, 20, [13, 39, 6, 7602, 7603, @ 2097, 2098, 7608, 7609, 2081, 7613, 2082, 7614], [5, 11, 2, 1, 1, 1, 1, 1, 1, @ 2, 2, 2, 4], ["m:steel", "T_180_80", "<-1 0 -1>", " ", "", " ", "", "", "", "" @ , "", "", ""], "Surface 1:7:2.3" ) $ beam_section_create( "L_90_40", "L", ["40", "90", "20", "8"] ) $ elementprops_create( "stiffener", 13, 23, 42, 1, 1, 20, [13, 39, 6, 2097, 2098, @ 7601, 7607, 2081, 7613, 2082, 7614], [5, 11, 2, 1, 1, 4, 1, 2, 2, 2, 4], [ @ "m:steel", "L_90_40", "<1 0 1>", " ", " ", " Negative", " ", "", "", "", " "], @ "Surface 1:7:2.1 2:8:2.3" ) $ $ Flush beams with plates: Tools - Sesam - AutoCalculate Beam Offsets $ sesam_offset_rules.set( ["Flush Top", "Flush Bottom", "Flush Left", @ "Flush Right", "Centroid"], ["Surface 1:7:2.1 2:8:2.3", "Surface 1:7:2.3", "", @ "", ""] ) sesam_beam_offset.calculate( 2, ["girder", "stiffener"] ) $ uil_toolbar.wireframe( ) $ $ Loads/boundary conditions $ loadcase_create2( "lc1", "Static", "", 1., [""], [0], [0.], "", 0., FALSE ) loadcase_create2( "lc2", "Static", "", 1., [""], [0], [0.], "", 0., FALSE ) loadcase_create2( "lc3", "Static", "", 1., [""], [0], [0.], "", 0., FALSE ) loadcase_create2( "lc4", "Static", "", 1., [""], [0], [0.], "", 0., FALSE ) $ loadcase_current_set( "lc1" ) loadsbcs_create2( "fix1", "Displacement", "Nodal", "", "Static", ["Curve 1 2"] @ , "Geometry", "Coord 0", "1.", ["<0 0 0 >", "< >"], ["", ""] ) $ loadsbcs_create2( "fix2", "Displacement", "Nodal", "", "Static", [ @ "Surface 7:8.2"], "Geometry", "Coord 0", "1.", ["<0 0 >", "< >"], ["" @ , ""] ) $ loadsbcs_create2( "lineload_x", "Element Force[2 node Line]", "Element Uniform", @ "2D", "Static", ["Surface 3:4.2"], "Geometry", "Coord 0", "1.", ["< 200 >" @ , "< >", " "], ["", "", ""] ) Xtract A-12 Sesam 1-FEB-2011 Program version 3.0 $ loadcase_current_set( "lc2" ) loadsbcs_create2( "lineload_z", "Element Force[2 node Line]", @ "Element Uniform", "2D", "Static", ["Surface 3:4.2"], "Geometry", "Coord 0", @ "1.", ["< 0 0 10 >", "< >", " "], ["", "", ""] ) $ loadcase_current_set( "lc3" ) loadsbcs_create2( "linemoment", "Element Force[2 node Line]", @ "Element Uniform", "2D", "Static", ["Surface 3:4.2"], "Geometry", "Coord 0", @ "1.", ["< >", "<0 3000 0 >", ""], ["", "", ""] ) $ $ Field for variation of pressure load $ fields_create( "varz", "Spatial", 1, "Scalar", "Real", "Coord 0", "", "Table", @ 1, "", "", "Z", "", "", "", FALSE, [0., 1800.], [0.], [0.], [[[0.015]][[ @ 0.003]]] ) $ loadcase_current_set( "lc4" ) loadsbcs_create2( "pressure", "Pressure", "Element Uniform", "2D", "Static", [ @ "Surface 1:8"], "Geometry", "", "1.", [" ", "f:varz", " "], ["", "", ""] ) $ $ Define groups (sets) $ sys_poll_option( 2 ) ga_group_create( "deck" ) ga_group_entity_add( "deck", "Point 1:9 Curve 1 2 Surface 1:4" ) ga_viewport_group_post( "", "deck" ) $ sys_poll_option( 0 ) sys_poll_option( 2 ) ga_group_create( "bulkhead" ) ga_group_entity_add( "bulkhead", "Point 1:3 10:15 Curve 1 2 Surface 5:8" ) ga_viewport_group_post( "", "bulkhead" ) $ sys_poll_option( 0 ) sys_poll_option( 2 ) ga_group_create( "bracket" ) ga_group_entity_add( "bracket", "Point 16 17 19 Curve 4 5 Surface 9 10" ) ga_viewport_group_post( "", "bracket" ) $ sys_poll_option( 0 ) $ $ Group reorganize $ bv_group_reorganize( 4, ["default_group", "deck", "bulkhead", "bracket"], [0, @ 0, 0, 0, 0, 0, 0], [1, 1, 1, 1] ) $ $ FEM finished $ $ Write T#.fem file $ Must be executed manually $ Application: Analysis: Analyze - Selected Model - Interface file Sesam Xtract Program version 3.0 APPENDIX B 1-FEB-2011 B-1 STRESSES AND OTHER RESULTS This appendix provides information on and definition of the various stress components. Also, an overview of all result attributes and components is given. B1 Element Local Coordinate Systems B 1.1 Membrane and Shell Elements The local z-axis for membrane and shell elements is normal to the element and is determined by the preprocessor. The local x-axis is for a linear analysis using Sestra determined as the projection of the X-axis of the superelement onto the membrane/shell surface (the LOCS command of Sestra may, however, specify otherwise). The local y-axis completes a right-handed cartesian coordinate system. However, if the superelement’s X-axis has no projection (the element is parallel with the YZ-plane) then the local x-axis will be parallel with the superelement’s Y-axis instead. Figure B.1 illustrates this. B.1 Figure B.1 Local coordinate system for membrane and shell elements Xtract B-2 B 1.2 Sesam 1-FEB-2011 Program version 3.0 Solid Elements The local coordinate system of solid elements is parallel with the coordinate system of the superelement. B2 Result Attributes and Components As explained in Section 3.2.1 there are five result positions: Nodes, Elements, Element average, Resultpoints and Surface resultpoints. Each of these contain a selection of result attributes which in turn contain result components. This section explains the attributes and their components. B 2.1 Result Attribute: DISPLACEMENT The displacements are available in the form of the three translational components X, Y, Z and the three rotational components RX, RY, RZ. (The unit of rotations is always in radians.) In addition, the component ALL being the vector sum of the three translational components is available. B 2.2 Result Attribute: VELOCITY This attribute is only available for quasi-static and dynamic analysis. In the case of frequency domain analysis (dynamic or quasi-static) it is computed by Xtract based on the DISPLACEMENT attribute as follows: • Real velocity component = * Imaginary displacement component • Imaginary velocity component = * Real displacement component Note: For a quasi-static analysis Xtract cannot compute the velocities unless the frequencies are available on the results file. This in turn requires the frequencies to be input to Sestra (on FRLO or FRQL, normally as part of the S-file). In the case of time domain analysis velocities must have been requested to be stored on the results file in Sestra (RESVA option on FRSP command). The components of the attribute correspond to the components of the attribute DISPLACEMENT. B 2.3 Result Attribute: ACCELERATION This attribute is only available for quasi-static and dynamic analysis. In the case of frequency domain analysis (dynamic or quasi-static) it is computed by Xtract based on the DISPLACEMENT attribute as follows: • Real acceleration component = 2 * Real displacement component • Imaginary acceleration component = 2 * Imaginary displacement component Sesam Program version 3.0 Xtract 1-FEB-2011 B-3 Note: For a quasi-static analysis Xtract cannot compute the accelerations unless the frequencies are available on the results file. This in turn requires the frequencies to be input to Sestra (on FRLO or FRQL, normally as part of the S-file). In the case of time domain analysis velocities must have been requested to be stored on the results file in Sestra (RESVA option on FRSP command). The components of the attribute correspond to the components of the attribute DISPLACEMENT. B 2.4 Result Attribute: REACTION-FORCE The reaction forces are three reaction forces, X-FORCE, Y-FORCE and Z-FORCE, and three reaction moments, RX-MOMENT, RY-MOMENT and RZ-MOMENT. B 2.5 Result Attribute: G-STRESS This attribute contains the general stress components: • SIGXX (x) – stress in the direction of the local x-axis – membrane, shell and solid elements • SIGYY (y) – stress in the direction of the local y-axis – membrane, shell and solid elements • SIGZZ (z) – stress in the direction of the local z-axis – solid elements • TAUXY (xy) – shear stress in the direction of the local x/y-axes – membrane, shell and solid elements • TAUXZ (xz) – shear stress in the direction of the local x/z-axes – 6 and 8 node shell and solid elements • TAUYZ (yz) – shear stress in the direction of the local y/z-axes – 6 and 8 node shell and solid elements • VONMISES – von Mises stress – membrane, shell and solid elements See Section B 1 for information on the local coordinate system of the various elements. B 2.6 Result Attribute: P-STRESS This attribute contains the principal stress components: • P1 – the highest principal stress – membrane, shell and solid elements • P2 – the second highest (and lowest in case of membrane and shell elements) principal stress – membrane, shell and solid elements • P3 – the lowest principal stress – solid elements See Section B 3.3 for information on the calculation of principal stresses. Xtract B-4 B 2.7 Sesam 1-FEB-2011 Program version 3.0 Result Attribute: PM-STRESS This attribute contains the principal membrane stress components, i.e. principal stresses based on the membrane stress components only: • P1 – the highest principal stress – membrane and shell elements • P2 – the lowest principal stress – membrane and shell elements Note: For membranes PM-STRESS components are equal to P-STRESS components. See Section B 3.3 for information on the calculation of principal stresses. B 2.8 Result Attribute: D-STRESS This attribute contains the decomposed stress components, i.e. general stresses decomposed in membrane and bending parts. This attribute is relevant for shell elements only. • SIGMX (Mx) – membrane part of stress in the direction of the local x-axis • SIGMY (My) – membrane part of stress in the direction of the local y-axis • SIGBX (Bx) – bending part of stress in the direction of the local x-axis • SIGBY (By) – bending part of stress in the direction of the local y-axis • TAUMXY (Mxy) – membrane part of shear stress in the direction of the local x/y-axes • TAUBXY (Bxy) – twisting part of shear stress in the direction of the local x/y-axes • TAUBXZ (Bxz) – bending related shear stress in the direction of the local x/z-axes • TAUBYZ (Byz) – bending related shear stress in the direction of the local y/z-axes • MVONMISES – von Mises stress based on membrane stresses See Section B 3.1 for information on the calculation of decomposed stresses. B 2.9 Result Attribute: R-STRESS This attribute contains the stresses integrated through the thickness, often referred to as stress resultants in literature. This attribute is relevant for membrane and shell elements only. • NXX – normal force per unit length in the direction of the local x-axis • NXY – shear force per unit length in the membrane/shell surface (NYX = NXY) • NXZ – shear force per unit length normal to the membrane/shell surface in a section normal to the local x-axis Sesam Program version 3.0 Xtract 1-FEB-2011 B-5 • NYY – normal force per unit length in the direction of the local y-axis • NYZ – shear force per unit length normal to the membrane/shell surface in a section normal to the local y-axis • MXX – bending moment per unit length in a section normal to the local x-axis • MXY – twisting moment per unit length in a section normal to the local x-axis (MYX = MXY) • MYY – bending moment per unit length in a section normal to the local y-axis See Section B 3.2 for information on the calculation of the stress resultants. B 2.10 Result Attribute: G-FORCE This attribute contains the beam forces and moments. This attribute is relevant for beam elements only. • NXX – axial force • NXY – shear force in the direction of the local y-axis • NXZ – shear force in the direction of the local z-axis • MXX – torsional moment • MXY – bending moment about the local y-axis • MXZ – bending moment about the local z-axis B 2.11 Result Attribute: B-STRESS This attribute contains beam stresses computed by Xtract based on forces and moments (G-FORCE). This attribute is relevant for beam elements only. • SIGXX – axial (normal) stress due to axial force alone • SIGBYX – axial (normal) stress in the most extreme fibre due to moment about y-axis • SIGBYX2 – axial (normal) stress in the extreme fibre on the “opposite side” of SIGBYX due to moment about y-axis • SIGBZX – axial (normal) stress in the most extreme fibre due to moment about z-axis • SIGBZX2 – axial (normal) stress in the extreme fibre on the “opposite side” of SIGBZX due to moment about z-axis • TAUTX – shear stress due to torsional moment • TAUXY – shear stress due to shear force in y-direction • TAUXZ – shear stress due to shear force in z-direction Xtract Sesam B-6 1-FEB-2011 Program version 3.0 See Section B 4 for information on the calculation of beam stresses. B3 Derived Stresses for Membrane, Shell and Solid Elements Several derived stress components are computed for the membrane, shell and solid elements based on the general stress components (G-STRESS). These are (see also Section B 2): • Decomposed stresses (D-STRESS), i.e. general stresses decomposed into membrane and bending parts • Principal stresses (P-STRESS) • Principal membrane stresses (PM-STRESS) • Stress resultants (R-STRESS), i.e. general stresses integrated through the membrane/shell thickness giving forces and moments per length unit • von Mises stress • Maximum and minimum stresses for a complex result case • Maximum and minimum stresses for a complex result case combined with static (non-complex) result cases B 3.1 Decomposed Stresses The D-STRESS components are computed based on the G-STRESS as illustrated in Figure B.2 through Figure B.6. B.2 Figure B.2 D-STRESS – normal stress – for 4 node shell elements Sesam Xtract Program version 3.0 1-FEB-2011 B.3 Figure B.3 D-STRESS – membrane shear – for 4 node shell elements B.4 Figure B.4 D-STRESS – normal stress – for 8 node shell elements Figure B.4 through Figure B.6 show a section through the result points of an 8 node shell element. B-7 Xtract Sesam B-8 1-FEB-2011 Program version 3.0 B.5 Figure B.5 D-STRESS – membrane shear – for 8 node shell elements B.6 Figure B.6 D-STRESS – ‘bending’ shear – for 8 node shell elements B 3.2 Stress Resultants The R-STRESS components are computed based on the D-STRESS as illustrated in Figure B.7 and Figure B.8. Sesam Xtract Program version 3.0 1-FEB-2011 B-9 B.7 Figure B.7 R-STRESS – forces – for 4 and 8 node shell elements (Nxz and Nyz do not exist for 4 node shell) B.8 Figure B.8 R-STRESS – moments – for 4 and 8 node shell elements B 3.3 Principal Stresses B 3.3.1 Principal Stresses for Thin Shell (2D Problem) For triangular 3 and quadrilateral 4 node shell elements for which only x, y and xy exist the principal stresses P1 and P2 are found from (the plus applies to P1 and the minus to P2), also see Figure B.9: x + y 1 2 2 P 1 2 = ----------------- --- x – y + 4 xy 2 2 (B.1) Xtract Sesam B-10 1-FEB-2011 Program version 3.0 B.9 Figure B.9 Mohr’s circle for 2D B 3.3.2 Principal Stresses for Thick Shell For triangular 6 and quadrilateral 8 node shell elements having an incomplete three by three stress tensor (x, y, xyxz and yz exist but z does not exist) the computations are based on the full stress tensor as for the solid elements (Section B 3.3.3) except that the smallest of the eigenvalues found is returned as P2 (the middle eigenvalue is irrelevant). B 3.3.3 Principal Stresses for Solids (3D Problem) Solid elements have a complete three by three stress tensor. According to general stress theory the principal stresses of the 3D problem are the eigenvalues Pi of P 0 0 x xy xz 0 P 0 – xy y yz xz yz z 0 0 P v = 0 (B.2) where v is a three by three matrix containing the direction cosines of the three principal stress directions (the three eigenvectors). The three eigenvalues of Equation (B.2) are the roots of P 0 0 x xy xz det 0 P 0 – xy y yz xz yz z 0 0 P = 0 (B.3) Sesam Xtract Program version 3.0 1-FEB-2011 B-11 This is the same as solving the cubic equation 3 2 – P + I1 P – I2 P + I3 = 0 (B.4) where Ii (invariants of the stress tensor) are I1 = x + y + z 2 2 2 I 2 = x y + y z + x z – xy – yz – xz 2 (B.5) 2 2 I 3 = x y z + 2 xy yz xz – x yz – y xz – z xy Equation (B.4) is solved and the eigenvalues are sorted so that P1 P2 P3. These are the three principal stresses. Also see Figure B.10. B.10 Figure B.10 Mohr’s circle for 3D B 3.4 von Mises Stress The von Mises stress is computed according to the following formulae depending on the type of element. For thin shell and membrane elements (2D problem): vonMises = 2 2 2 x + y – x y + 3 xy (B.6) For thick shell element: vonMises = 2 2 2 2 2 x + y – x y + 3 xy + xz + yz (B.7) Xtract Sesam B-12 1-FEB-2011 Program version 3.0 For solid element (3D problem): vonMises = 2 2 2 2 2 2 x + y + z – x y – x z – y z + 3 xy + xz + yz (B.8) Von Mises stress based on membrane stresses only, i.e. the MVONMISES component of the D-STRESS attribute for thin and thick shell elements: MvonMises = B 3.5 2 2 2 Mx + My – Mx My + 3 Mxy (B.9) Sequence of Computation of Stresses The stresses in the Resultpoints positions, i.e. the stresses read from the results file, are the basis for all stresses presented by Xtract. From the Resultpoints stresses the extrapolated stresses within the elements, the nodal averaged stresses, the decomposed stresses, the derived stresses (von Mises and principal stresses) and combined stresses are found. The sequence in which these computations are made matters. For example, computing von Mises stresses followed by averaging these stresses in the nodes gives a different result than first averaging basic stress components in the nodes followed by computing the von Mises stress. (The latter sequence is the correct procedure followed by Xtract.) When the results are complex the number of calculations both increases and gets more complex which makes the sequence of the computations even more important. The sequence of these computations is as follows: 1 Resultpoints stresses are the ones found on the results file. 2 Surface resultpoint stresses are computed for higher order (6 and 8 node) shell elements in upper and lower surfaces by linear extrapolation. 3 Elements stresses are computed by bi-linear extrapolation to the nodes, or rather to the upper and lower surfaces at the nodes, from the Resultpoint stresses (from Surface resultpoint stresses in the case of higher order shell elements). In the case of lower order 4 node plate elements no extrapolation is required as the Resultpoint stresses are positioned in the upper and lower surfaces at the nodes. 4 Element average stresses, positioned in the upper and lower surfaces in the middle of the elements, are found by averaging the element corner values. 5 Nodes stresses are found in the nodes, or rather in the upper and lower surfaces at the nodes, by averaging element stresses of adjoining coplanar shell/plate elements. 6 D-STRESS stress components (membrane and bending) are computed for all positions (Surface resultpoints, Elements, Element average and Nodes) as explained in Section B 3.1. 7 Combinations are created based on stress components (SIGXX, SIGYY, TAUXY, etc.) of the relevant attribute – for complex result cases the combinations are made for all phase steps through the 360 degree cycle, 10 degree intervals by default. 8 Principal and von Mises stresses are computed as the final step as explained in Section B 3.3 and Section B 3.4, respectively. No stress computations are performed based on these stresses. For complex result cases the principal and von Mises stresses are computed for all phase steps and the phase is determined based on the selected [abs] max/min criterion. Sesam Program version 3.0 Xtract 1-FEB-2011 B-13 9 Scan cases are based on (scaled) result cases that individually have been taken through the procedure above before determining result value and result case according to the selected [abs] max/min criterion. B4 Beam Stresses Derived from Beam Forces and Moments The B-STRESS components are found by dividing the forces and moments by areas and minimum sectional moduli. Notice the components SIGBYX2 and SIGBZX2 and how they are computed. The motivation for these two components is explained in Figure B.11. • SIGXX = NXX / AREA • SIGBYX = MXY / WYMIN • SIGBYX2 = MXY / WYMIN2 • SIGBZX = MXZ / WZMIN • SIGBZX2 = MXZ / WZMIN2 • TAUTX = MXX / WXMIN • TAUXY = NXY / SHARY • TAUXZ = NXZ / SHARZ The parameters above are: • AREA – area of beam cross section • WYMIN = Iy/zmax – minimum section modulus about y-axis • WYMIN2 = Iy/zmax2 – minimum section modulus about y-axis on the “opposite side” of zmax; see Figure B.11 • WZMIN = Iz/ymax – minimum section modulus about z-axis • WZMIN2 = Iz/ymax2 – minimum section modulus about z-axis on the “opposite side” of ymax; see Figure B.11 • WXMIN – minimum torsional section modulus about shear centre (= Ix/rmax for a pipe) • SHARY – shear area in the direction of the y-axis. The shear area depends on the type of cross section and is computed by the preprocessor. • SHARZ – shear area in the direction of the z-axis. The shear area depends on the type of cross section and is computed by the preprocessor. Note: Except for SIGXX (which is constant over the section) the B-STRESS components will in general occur at different positions and can therefore neither be added nor be used to compute von Mises stress. Xtract B-14 Sesam 1-FEB-2011 Program version 3.0 Note: Both components SIGBYX and SIGBYX2 will have the same sign as the moment MXY while the two components in reality have opposite signs. This is because it is not taken into account which of the components occur on the positive side of the y-axis and which occur on the negative side (WYMIN and WYMIN2 are always positive). Correspondingly, both components SIGBZX and SIGBZX2 will have the same sign as the moment MXZ. Note: For sections symmetric about the y-axis the SIGBYX and SIGBYX2 components will be equal. Correspondingly, the SIGBZX and SIGBZX2 components will be equal for sections symmetric about the z-axis. Note: For box and double-symmetric I sections the SIGBYX and SIGBZX stresses added to the SIGXX gives the highest axial (normal) stress over the section. The signs of SIGBYX and SIGBZX must, however, be set equal to the sign of SIGXX before adding for reasons explained above. Such adding of stresses must be done outside Xtract, for instance in a spreadsheet after saving a table of stresses to file in Xtract. Note: For pipe sections the SIGBYX and SIGBZX stresses multiplied by 2 and added to the SIGXX gives the axial (normal) stress in the 45°/135°/225°/315° points of the section. The signs of SIGBYX and SIGBZX must, however, be set equal to the sign of SIGXX before adding for reasons explained above. Such adding of stresses must be done outside Xtract, for instance in a spreadsheet after saving a table of stresses to file in Xtract. B.11 Figure B.11 B-STRESS components due to moments Sesam Xtract Program version 3.0 B5 1-FEB-2011 B-15 Maximum and Minimum Stress Involving Complex Result Cases This section describes some basic concepts and properties of complex results. Thereafter, relevant manipulations such as combining, scaling and scanning are discussed. Finally, the manipulations of complex results available in Xtract are described. B 5.1 B 5.1.1 Basic Concepts and Properties of Complex Results Extracting Physical Response from Complex Results A complex result case in Sesam is comprised of a real and an imaginary part (as opposed to a non-complex – for example a static – result case that only contains a real part). The real and imaginary parts describe the harmonic (sinusoidal) response and may graphically be presented by Figure B.12. B.12 Figure B.12 The complex circle Note the terminology: • The term ‘static’ is used for a non-complex load case. • = atan(I/R) is termed the ‘phase shift of the response’ or only ‘phase shift’. • = t is termed the ‘phase of the wave’ even though the harmonic loading is not necessarily due to a wave in water. Xtract B-16 Sesam 1-FEB-2011 Program version 3.0 Note that the maximum value of the response F(a) occurs at = (the point P lies on the Real axis on the positive side). A positive involves that the response is ahead in time of the wave. In Sesam, = 0 corresponds to the wave crest being positioned above the origin. B 5.1.2 Stress Variation through a Cycle (360 Degrees) The basic stress components (x, y, xy, etc.) as well as other responses (displacements, forces, etc.) are harmonic. The derived von Mises stress and the principal stresses, however, are non-linear combinations of the basic stress components and therefore non-harmonic. The graph in Figure B.13 illustrates this (the stress components are the ones belonging to a four node shell element). As can be seen the von Mises stress is a non-harmonic variation (always > 0) repeating itself every 180 degree. (For a combination of a static result case and a complex result case the von Mises will be non-harmonic and repeat itself every 360 degree, see Figure B.14.) The first principal stress (P1) will tend to follow the most positive of the stress components x and y. B.13 Figure B.13 Typical variation of stresses through a cycle for a complex result case From the above it is apparent that finding the maximum von Mises and principal stresses through a cycle of a complex (plus a static) result case requires (unless a more advanced method is employed) searching for the maximum value by stepping through the cycle, e.g. by a ten degree interval (default value of Xtract). Sesam Xtract Program version 3.0 B 5.2 B 5.2.1 1-FEB-2011 B-17 Manipulations of Complex Results Presenting a Single Complex Result Case For a given harmonic attribute (e.g. x) of a complex result case the following values are relevant for presentation: • The real part, R, corresponding to phase = 0 • The imaginary part, I, corresponding to phase = 270 (or 90) • The magnitude (amplitude), M = SQRT(R2 + I2), which is the maximum value of the component through the cycle • The phase shift of the response, = ATAN(I/R), which is the phase lag between the wave and the component (entering the negative phase shift for phase yields a value of the component equal to the magnitude) • The response F for a given value of the phase () of the incoming wave For the derived non-harmonic von Mises and principal stresses the following values are relevant for presentation: • The stress at a given value of the phase () of the incoming wave • The maximum stress found by stepping through the whole cycle (360 degrees) • The value of the phase of the incoming wave giving the maximum stress above All these values may be presented by Xtract as explained in Section 3.4.1. B 5.2.2 Scaling of a Complex Result Case Scaling a complex result case may be done while maintaining its harmonic nature. This is relevant for scaling results corresponding to a unit wave amplitude to results for a real harmonic wave. This is available in Xtract through the Results > Scale complex result case command, see Section 3.4.4. B 5.2.3 Adding Complex Result Cases of Equal Frequencies Adding (with scaling if desired) the real and imaginary parts, respectively, of two or more complex result cases is meaningful provided that the complex result cases have the same frequency (their phase shifts may differ though). The resulting case will be harmonic. This feature is presently available in Prepost but not in Xtract. There is no control in Prepost as to whether the frequencies of the complex cases to be combined are in fact equal. The user is therefore not restrained from creating meaningless combinations of complex cases of different frequencies. The combination is termed ‘quasi-static’ and is assigned zero frequency. Xtract B-18 B 5.2.4 Sesam 1-FEB-2011 Program version 3.0 Combining Several Static and Several Complex Result Cases Generally, in order to combine a complex result case with other result cases it must first be evaluated for a phase of the incoming wave (). This because adding a constant value (static result case) and a harmonic function does not yield a harmonic function and neither will two harmonic functions with different frequencies. Combining a static result case (or any number of such), denoted by subscript s, and several complex result cases, denoted by subscripts 1, 2, 3, … can be done by specifying a phase of the wave for each complex case thereby evaluating each complex case prior to adding the response: F() = fsRs + f1(R1cos1+I1sin1) + f2(R2cos2+I2sin2) + f3(R3cos3+I3sin3) + … Normally, the complex result cases are not correlated, i.e. they (the incoming waves) may occur with any possible combination of phase of the wave. Therefore, the user normally wants to find the combination of phases (1, 2, 3, …) giving the maximum von Mises or principal stress. As demonstrated above, the maximum von Mises for a single complex result case is found by stepping through the cycle. Therefore – unless some assumptions or simplification are made – finding the maximum for a combination of several complex result cases involves evaluating all possible combinations of steps through the cycle of all complex cases, a task that increases exponentially in size when number of complex cases increases. Therefore, combining several complex result cases is normally of little practical interest. Xtract will not allow the user to put more than a single complex result case into a combination. B 5.2.5 Combining Several Static Result Cases with a Single Complex Result Case Combining one or more static (non-complex) result cases with a single complex result case is a highly relevant feature for all postprocessors dealing with complex results. The task is to determine a phase for the complex result case, evaluate the complex case for this phase and finally add (with factors) this evaluation with the static case(s). The phase may be determined either by simply specifying it or as the phase giving maximum or minimum of a certain stress component. Xtract provides this feature through the Results > Combine command, see Section 3.4.2. For illustration purposes a graph of the stress variation through the cycle for a combination of a static result case and a complex result case is shown in Figure B.14. (The stress components are the ones belonging to a four node shell element.) The von Mises stress is non-harmonic and repeats itself every 360 degree. The principal stresses, P1 and P2, are also non-harmonic. Sesam Xtract Program version 3.0 1-FEB-2011 B-19 B.14 Figure B.14 Typical variation of stresses through a cycle for a complex plus a static result case B 5.2.6 Scanning Complex Result Cases Scanning several complex result cases for the maximum or minimum value of a certain stress component is also a required postprocessing feature in connection with complex results. The task is to determine a phase for each complex result case, evaluate the complex cases for these phases and finally select the maximum/ minimum value of the stress component. The phase may be determined either by simply specifying it or, more relevantly, as the phase giving maximum/minimum of the stress component in question. Xtract provides this feature through the Results > Scan command, see Section 3.4.3.