1
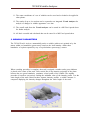
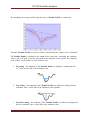
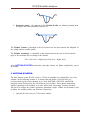
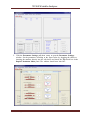
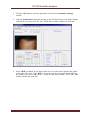
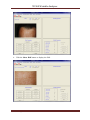
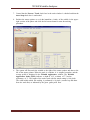
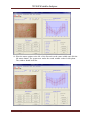
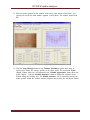
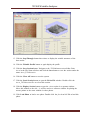
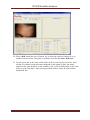
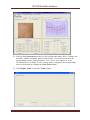
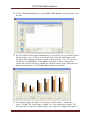
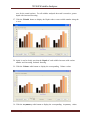
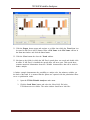
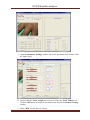
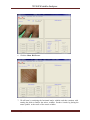
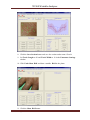
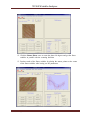
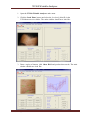
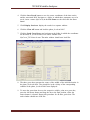
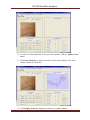
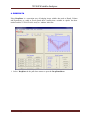
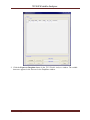
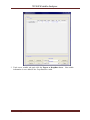
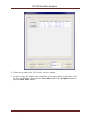
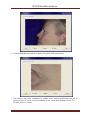
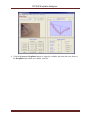
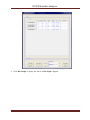
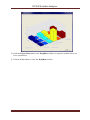
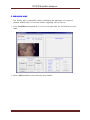
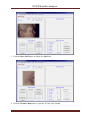
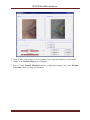
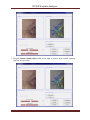
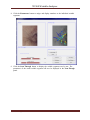
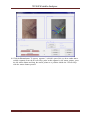
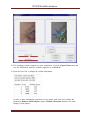
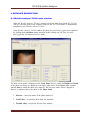
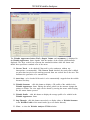
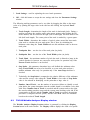
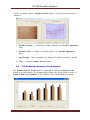
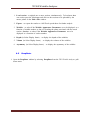
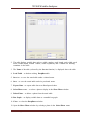
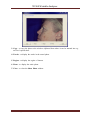
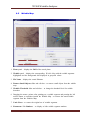
Wrinkle Analyzer TiVi90
User Manual
PIONEERS IN TISSUE VIABILITY IMAGING
User Manual 3.3
Version 3.3
October 2013
TiVi90 Wrinkle Analyzer
Dear Valued Customer!
Welcome to the WheelsBridge Wrinkle Analyzer TiVi90 system intended for automatic
analysis of wrinkle appearance. The Wrinkle Analyzer TiVi90 was designed especially for
observer-independent analysis of wrinkles in association with evaluation of skin care
products and follow up of treatment regimes.
The Wrinkle Analyzer TiVi90 utilizes a highly sensitive digital camera equipped with
polarization filters making it possible to suppress (cross-polarization mode) or enhance (copolarization mode) surface reflections from the skin surface. The versatile system software –
based on the MATLAB® high performance language for technical computing – allows for
rapid and easy capturing and analysis of images. Among the many useful features of the
Wrinkle Analyzer TiVi90 software the following are of particular interest:
?
Automatic capturing of photos.
?
Automatic tracking of wrinkles.
?
Display of winkle profile.
?
3D display of wrinkle structure.
?
Quantitative measures of wrinkle depth, volume and asymmetry appearance.
?
Simultaneous analysis of up to 10 wrinkles.
?
Trend analysis window to display changes in wrinkle appearance over time.
?
Creation of wrinkle maps.
?
Possibility to load and save entire sessions.
?
Possibility to load and save wrinkle coordinates.
?
Operates in cross- and co-polarization mode.
?
All data can be exported to ASCII-format spread sheets.
We are convinced that the Wrinkle Analyzer TiVi90 will be a productive tool in the
assessment and follow-up of wrinkle appearance following treatment with skin care products.
Thank you for choosing the WheelsBridge Wrinkle Analyzer TiVi90.
WheelsBridge AB
Wrinkle Analyzer TiVi90 3.3
Sida 1
TiVi90 Wrinkle Analyzer
Information in this document is subject to change without notice and does not represent a
commitment on the part of WheelsBridge AB. No part of this manual may be reproduced or
transmitted in any form or by any means, electronically or mechanically, including
photocopying and recording, for any purpose without the written permission of WheelsBridge
AB.
Any use of application of WheelsBridge products must be performed by properly trained and
qualified personnel. WheelsBridge AB takes no responsibility for action taken on the basis of
information derived from the use of the product described in this manual or from
consequential damages in connection with furnishing, performance or use of this manual.
Licensee’s limited rights are governed by the license agreement between WheelsBridge AB
and MathWorks. Licensee may not modify or remove any license agreement file
(MarthWorks or third party) that is included with the MCR Libraries (“MCR Library
License”). Licensee of this Application accepts the terms of the MCR Library License.
WheelsBridge is a registered trade mark.
Wrinkle Analyzer TiVi90 3.3
Sida 2
TiVi90 Wrinkle Analyzer
1. INTRODUCTION
Wrinkles frequently appear on the parts of the body where there has been extensive sun
exposure. Wrinkles can appear as fine structures or deep furrows. Smoking, skin type,
heredity occupational and recreational habits are factors that all promote wrinkling of the
skin. Many products have been developed for the reduction of wrinkles or rather their
appearance, but few cost-effective techniques are to date available for quantitative analysis of
wrinkle appearance. The Wrinkle Analyzer TiVi90 is a software package that analysis several
features of wrinkles based on photos captured by polarization spectroscopy camera
technology.
The intended use of the Wrinkle Analyzer TiVi90 is to analyse the appearance of wrinkles
in experimental in laboratory applications. It is not yet approved for the diagnosis and
treatment of disease.
2. OPERATING PRINCIPLE
The Wrinkle Analyzer TiVi90 operates in the following way:
1. The TiVi camera is set to cross- or co-polarization mode by adjusting Illuminator
filters.
2. A photo of the actual skin area is captured.
3. The photo is uploaded to the Wrinkle Analyzer TiVi90 main window.
4.
A region of interest (ROI) is drawn and displayed.
5. Automatic tracking of a wrinkle starts by pointing at the wrinkle using the mouse.
6. The wrinkle profile is automatically calculated and features of the wrinkle appearance
(depth, volume and asymmetry) are displayed.
7. The cross section of a wrinkle (structure) can be visualized in 3D.
8. Up to 10 wrinkles in the same photo – referred to as a session - can be analyzed
simultaneously.
9. A complete session can be saved and uploaded again at a later occasion for further
analysis.
10. An infinite number of sessions can be displayed in separate windows simultaneously.
Wrinkle Analyzer TiVi90 3.3
Sida 3
TiVi90 Wrinkle Analyzer
11. The centre coordinates of a set of wrinkles can be saved and re-loaded to be applied in
other photos.
12. The results of up to six sessions can be exported to an integrated Trend Analyzer for
analysis of changes in wrinkle appearance over time.
13. The overall result from the Trend Analyzer can be stored in a MS Excel spread-sheet
for further analysis.
14. All basic recorded and calculated data can be stored in a MS Excel spread-sheet.
3. WRINKLE PARAMETERS
The TiVi90 Wrinkle Analyzer automatically tracks a wrinkle (white trace) pointed at by the
mouse within set boundaries (green traces) based on the local intensity within these
boundaries of a photo captured by way of a polarization spectroscopy camera.
When a tracking procedure is complete, the track is assigned a number and a green indicator
is placed at the centre of the track. Each vertical line in the intensity projection of the photo
between the two green boundaries constitutes a local profile of the wrinkle. The tracking
procedure is based on successively finding the minimum value of the intensity profile over the
entire length of the track. Based on these separate intensity profiles, a wrinkle structure is
composed displaying the intensity changes throughout the entire length of the track.
Wrinkle Analyzer TiVi90 3.3
Sida 4
TiVi90 Wrinkle Analyzer
By calculating the average profile along the track, a Wrinkle Profile is constructed.
From this Wrinkle Profile several key features characterizing the wrinkle can be calculated.
The Wrinkle Depth is calculated as the length of the vertical line connecting the minimum
value to the cross-point of the line that connects the endpoints of the wrinkle. The endpoints
of the wrinkle can be defined in four different ways:
1. Fix setting – the endpoints of the Wrinkle Profile are defined as starting from the
10th pixel at each side of the minimum value.
2. Top setting – the endpoints of the Wrinkle Profile are defined as starting from the
maximum value at each side of the minimum value (Default).
3. First Max setting – the endpoints of the Wrinkle Profile are defined as starting from
the first maximum value at each side of the minimum value.
Wrinkle Analyzer TiVi90 3.3
Sida 5
TiVi90 Wrinkle Analyzer
4. Endpoints setting – the endpoints of the Wrinkle Profile are defined as starting from
the upper and lower boundaries respectively.
The Wrinkle Volume is calculated as the area between the line that connects the endpoints of
the wrinkle and the wrinkle profile.
The Wrinkle Asymmetry is calculated as the relation between the area to the left and the
right of the horizontal line according to the formula:
200 * (Left Area – Right Area)/(Left Area + Right Area)
In the GETTING STARTED section these and other features are further explained by way of
an example
3. GETTING STARTED
The basic features of the Wrinkle Analyzer TiVi90 are probably best explained by way of an
example. In the following example it is assumed that the photos forehead-0001.jpg –
forehead-0006.jpg have been captured by a Canon EOS550D / 650D TiVi camera with
polarizing filters and stored in the TiVi90demonstration folder. These photos demonstrate
wrinkles appearing in the forehead of a male subject with increasingly frowning forehead.
The task is to analyze the wrinkle appearance parameters (depth, volume and asymmetry) and
to display the wrinkle profiles and structures respectively.
1. Open the Wrinkle Analyzer TiVi90 main window.
Wrinkle Analyzer TiVi90 3.3
Sida 6
TiVi90 Wrinkle Analyzer
2. Click the Parameter Settings pull-down menu to open the Parameter Settings
window. Set the parameters according to the figure below by dragging the sliders or
inserting the numbers directly into the edit boxes and check the Top check-box in the
Depth Calculation Mode panel. The window should now look like:
Wrinkle Analyzer TiVi90 3.3
Sida 7
TiVi90 Wrinkle Analyzer
3. Click the OK button to store the parameters and close the Parameter Settings
window.
4. Click the Load Photo button and navigate to the TiVi90demonstration folder. Doubleclick the file forehead-0001 file. The TiVi90 main window should now look like:
5. Draw a ROI as outlined in the figure below by use of the mouse (position the pointer
at the upper left corner of the ROI to be drawn, press the left mouse button and drag
the pointer to the lower right corner – release the left mouse button). The TiVi90 main
window should now look like:
Wrinkle Analyzer TiVi90 3.3
Sida 8
TiVi90 Wrinkle Analyzer
6. Click the Show ROI button to display the ROI.
Wrinkle Analyzer TiVi90 3.3
Sida 9
TiVi90 Wrinkle Analyzer
7. Control that the Narrow Track check-box in the main window is checked and that the
Auto Stop check-box is unchecked.
8. Position the mouse pointer on or in the immediate vicinity of the wrinkle in the upperright section of the photo and click the left mouse button to start the tracking
procedure.
9. The system will first track the wrinkle to the right of the mouse pointer and then to the
left of the mouse pointer. When the track is complete, it is assigned a number and the
average profile is displayed in the Wrinkle Appearance window. The Wrinkle
Appearance Index (WAI) indicates a depth of 19.2, a volume of 7.7 and an
asymmetry of -2. The length of the entire track with the actual setting is 100 pixels.
The width within which the tracking is performed is 10 pixels (counted up and down
from the track-line) as indicated by the green guide-point lines.
Wrinkle Analyzer TiVi90 3.3
Sida 10
TiVi90 Wrinkle Analyzer
10. Place the mouse pointer to the left of the first track on the same wrinkle and click the
left mouse button. The system now tracks the second wrinkle section in this photo.
The window should look like:
Wrinkle Analyzer TiVi90 3.3
Sida 11
TiVi90 Wrinkle Analyzer
11. Place the mouse pointer on the wrinkle in the lower right section of the photo. The
system now tracks the third wrinkle segment in this photo. The window should look
like:
12. Click the Step Through button in the Wrinkle Parameters panel three times to
successively display the average profiles of the three tracks. The associated WAIs
(Depth, Volume and Ass) are displayed in the Wrinkle Appearance frame above the
profile display. Click the Wrinkle Structure button to display the structure of the
wrinkle along the tracking area. The Winkle Structure can be rotated by placing the
mouse pointer within the wrinkle structure diagram and pressing the left mouse button.
Wrinkle Analyzer TiVi90 3.3
Sida 12
TiVi90 Wrinkle Analyzer
13. Click the Step Through button three times to display the wrinkle structures of the
three tracks.
14. Click the Wrinkle Profile button to again display the profile.
15. Click the Save Session button. Navigate to the TiVi90demonstration folder. Print
Asess in the File Name edit box and click the Save button to save the session under the
name Asess_TiVi90session.
16. Click the Clear All button to reset the system.
17. Click the Load Session button to open the Pick a File window. Double-click the
Asess_TiVi90session file to re-load this session.
18. Click the Display Session button to open the Asess session in a separate window.
Move this window to the side – it will be used as a reference window for placing the
mouse pointer at the same wrinkles in other photos.
19. Click Load Photo to load a new photo. Double-click the forehead-002 file to load this
photo.
Wrinkle Analyzer TiVi90 3.3
Sida 13
TiVi90 Wrinkle Analyzer
20. Draw a ROI around the area of interest (try to select the region of interest to be as
similar to that one in the first photo as possible) and click the Show ROI button.
21. Use the green dots in the centre of the tracks in the Session Display:forehead- 0001
window as reference points and other landmarks in this photo to place the mouse
pointers in the same positions on the wrinkles in the forehead-0002 photo, in the same
order as in the first photo. After having generated all three tracks the main window
should look like:
Wrinkle Analyzer TiVi90 3.3
Sida 14
TiVi90 Wrinkle Analyzer
22. Click the Save Session button and save this session under name Bsess. Continue this
procedure with the remaining photos forehead-003 – forehead-006 and save the
corresponding sessions under the names Csess, Dsess, Esess and Fsess in the
TiVi90demonstration folder. In case a mouse point is misplaced, the corresponding
track can be deleted by clicking the Undo Track button.
23. Click Display Trend to open the Trend window.
Wrinkle Analyzer TiVi90 3.3
Sida 15
TiVi90 Wrinkle Analyzer
24. Click the Load Session button to open the Pick a File window and load sessions from
the disk.
25. Several sessions can be loaded simultaneously. If all sessions are to be loaded, point at
the first session Asess_TiVi90session with the mouse. Press the shift-button on the
key-board while dragging the mouse to point at the last session Fsess_TiVi90session.
All files are now high-lighted. Click Open to upload the sessions. Alternatively,
separate files can be selected by clicking the actual file names while pressing the Ctrbutton on the key-board. The Trend window should now look like:
26. The diagram displays the Depth of the selected wrinkles (black = wrinkle No. 1,
brown = wrinkle No. 2 and orange = wrinkle No. 3) for the different sessions. The
name and dates at which the original photos were captured are displayed along the xWrinkle Analyzer TiVi90 3.3
Sida 16
TiVi90 Wrinkle Analyzer
axes for the actual sessions. For all wrinkles analyzed the trend is towards a greater
depth with increased frowning.
27. Click the Wrinkle button to display the Depth values versus wrinkle number along the
x–axes.
28. Again it can be clearly seen that the Depth of each wrinkle increases with session
number and increasing forehead frowning.
29. Click the Volume radio-button to display the corresponding Volume values.
30. Click the Asymmetry radio-button to display the corresponding Asymmetry values.
Wrinkle Analyzer TiVi90 3.3
Sida 17
TiVi90 Wrinkle Analyzer
31. Click the Export button menu and navigate to a folder into which the Trend data is to
be stored in MS Excel ASCII format. Insert a File Name in the File Name edit box in
the Save As window and click the Save button.
32. Click the Close button the close the Trend window.
33. Navigate to the folder in which the MS Excel spread sheet was saved and double-click
its name. If MS Excel is installed the spread sheet will now open. This spread sheet
contains numerical information about the Wrinkle characteristics that can be used for
further analysis.
A further example demonstrates the possibility to analyze also the minutest wrinkles on
the back of the hand. It is assumed that the photos are captured with the polarization filters
set to co-polarization mode.
1. Open the TiVi90 Wrinkle Analyzer main menu.
2. Click the Load Photo button and select the Hand-0001 file in the
TiVi90demonstration folder. The main window should now look like:
Wrinkle Analyzer TiVi90 3.3
Sida 18
TiVi90 Wrinkle Analyzer
3. Open the Parameter Settings window and set the parameters in accordance with
the figure below.
4. Observe that the Track Length has been set to 50 and the Track Width to 20.
Click the OK button to accept the parameters and close the Parameter Settings
window.
5. Draw a ROI over the base of a finger.
Wrinkle Analyzer TiVi90 3.3
Sida 19
TiVi90 Wrinkle Analyzer
6. Click the Show ROI button.
7. We will start by analyzing the horizontal major wrinkles and then continue with
rotating the photo to analyze the minor wrinkles. Produce 8 tracks by placing the
mouse pointer at the centre of the actual wrinkles.
Wrinkle Analyzer TiVi90 3.3
Sida 20
TiVi90 Wrinkle Analyzer
8. Click the Save Session button and save the session under name HandA.
9. Set Track Length to 20 and Track Width to 10 in the Parameter Settings
window.
10. Click Undo Show ROI and draw a smaller ROI in the photo.
11. Click the Show ROI button.
Wrinkle Analyzer TiVi90 3.3
Sida 21
TiVi90 Wrinkle Analyzer
12. Click the Rotate Photo once to rotate the photo 90 degrees and get the finest
wrinkles in parallel with the scanning direction.
13. Produce tracks of the finest wrinkles by placing the mouse pointer at the centre
of the finest wrinkles after having set the parameters.
Wrinkle Analyzer TiVi90 3.3
Sida 22
TiVi90 Wrinkle Analyzer
14. Save the session under the name HandB.
15. Click the Display Trend button to open the Trend window and load the two
sessions.
16. The rightmost group of bars represents the finest wrinkles while the leftmost
group of bars represents the somewhat larger wrinkles in the skin at the base of
the finger. Click the Volume radio-button to display the Volume of the two sets
of wrinkles.
The final example demonstrates the possibility to save and reload the coordinates for a
wrinkle session which is useful when two sessions recorded at different points in time are
to be compared.
Wrinkle Analyzer TiVi90 3.3
Sida 23
TiVi90 Wrinkle Analyzer
1. Open the TiVi90 Wrinkle Analyzer main menu.
2. Click the Load Photo button and select the forehead_0004 file in the
TiVi90demonstration folder. The main window should now look like:
3. Draw a region of interest, click Show ROI and produce three tracks. The main
window should now look like:
Wrinkle Analyzer TiVi90 3.3
Sida 24
TiVi90 Wrinkle Analyzer
4. Click the Save Coord button to save the centre coordinates of the three tracks
and the associated ROI. Navigate to a folder in which these parameters are to be
saved, insert a name (MyCoord) in the File Name text box and click the Save
button.
5. Click Display Session to display the results in a separate window.
6. Click the Clear All button and load the photo forehead-0005.
7. Click the Load Coord button and navigate to the folder in which the coordinates
for the tracks in forehead-0004 were saved. Double-click
MyCoord_TiVi90tracks.mat. The main window should now look like:
8. The three green dots represent the centre of the middle of the individual tracks in
the photo forehead-0004. They should be in the vicinity of the corresponding
wrinkles in the photo forehead-0005 now displayed.
9. To move the green dots closer to the respective wrinkle point on a green dot,
press the left mouse button and drag the dot to the final position, where the
mouse button is released. Repeat this procedure for all three green dots. The
main window should now look like:
Wrinkle Analyzer TiVi90 3.3
Sida 25
TiVi90 Wrinkle Analyzer
10. To make the final adjustment of the green dot positions, click the Adjust Coord
button.
11. Click Start Tracking to produce the tracks in the photo displayed. The main
window should now look like:
12. Click Display Session to display the results in a separate window.
Wrinkle Analyzer TiVi90 3.3
Sida 26
TiVi90 Wrinkle Analyzer
13. The wrinkle profiles in the photos forehead-0004 and forehead-0005 can now be
compared.
This concludes the GETTING STARTED section.
Wrinkle Analyzer TiVi90 3.3
Sida 27
TiVi90 Wrinkle Analyzer
4. DROPDATA
Using DropData is a convenient way of bringing image wrinkle data such as Depth, Volume
and Asymmetry to a table or Excel spread-sheet. Assume that a wrinkle in a photo ´has been
tracked and the TiVi90 Wrinkle Analyzer window looks like:
1. Select DropData in the pull-down menu to open the DropDataSheet.
Wrinkle Analyzer TiVi90 3.3
Sida 28
TiVi90 Wrinkle Analyzer
2. Click the Export to Dropdata button in the TiVi Wrinkle Analyzer window. The wrinkle
data now appears in the first raw in the DropData window.
Wrinkle Analyzer TiVi90 3.3
Sida 29
TiVi90 Wrinkle Analyzer
3. Track a new wrinkle and again click the Export to DropData button. New wrinkle
information is now added to the DropDataSheet table.
Wrinkle Analyzer TiVi90 3.3
Sida 30
TiVi90 Wrinkle Analyzer
4. Upload a new photo in the TiVi Wrinkle Analyzer window.
5. In order to place the wrinkle center coordinates at the same position in this photo, select
the first LenaWR-0006 photo from the Select Photo menu in the DropData window to
open the Show Photo window:
Wrinkle Analyzer TiVi90 3.3
Sida 31
TiVi90 Wrinkle Analyzer
6. Click the Tracks radio-button to display this photo with tracks drawn.
7. This window with center coordinates of wrinkles in the photo LenaWR-0006 can now be
used as a guide to set the tracker coordinates in the actual photo displayed in the TiVi
Wrinkle Analyzer window.
Wrinkle Analyzer TiVi90 3.3
Sida 32
TiVi90 Wrinkle Analyzer
8. Click the Export to DropData button to export the wrinkles data from this new photo to
the DropData table which now should look like:
Wrinkle Analyzer TiVi90 3.3
Sida 33
TiVi90 Wrinkle Analyzer
9. Click Bar Graph to display the data in a Bar Graph diagram.
Wrinkle Analyzer TiVi90 3.3
Sida 34
TiVi90 Wrinkle Analyzer
10. Click the Export Data button in the DropData window to export the wrinkle data to an
Excel spread-sheet.
11. Click the Close button to close the DropData window.
Wrinkle Analyzer TiVi90 3.3
Sida 35
TiVi90 Wrinkle Analyzer
5. WRINKLE MAP
The Wrinkle Map is particularly useful for displaying the appearance of a group of
adjacent wrinkles such as craw-foot wrinkles appearing close to the eye.
1. Click Load Photo and upload the CrawFoot-001 photo from the TiVi90demonstration
folder.
2. Draw a ROI around the areas with craw-foot wrinkles.
Wrinkle Analyzer TiVi90 3.3
Sida 36
TiVi90 Wrinkle Analyzer
3. Click the Show ROI button to display the ROI area.
4. Click the Wrinkle Map button to open the Wrinkle Map window.
Wrinkle Analyzer TiVi90 3.3
Sida 37
TiVi90 Wrinkle Analyzer
5. In the Wrinkle Map window a set of wrinkles with a depth determined by the threshold
setting in the Wrinkle Map panel is displayed.
6. Print 137 in the Wrinkle Threshold edit box (or adjust the setting by use of the Wrinkle
Threshold slider) to change the threshold.
Wrinkle Analyzer TiVi90 3.3
Sida 38
TiVi90 Wrinkle Analyzer
7. Drag the Remove Small Objects slider to the right to remove small wrinkle segments
from the Wrinkle Map.
Wrinkle Analyzer TiVi90 3.3
Sida 39
TiVi90 Wrinkle Analyzer
8. Click the Enumerate button to assign and display numbers to the individual wrinkle
segments.
9. Click the Scan Through button to display the wrinkle segments one-by-one. The
parameters of the actual wrinkle segment will now be displayed in the Scan Though
panel.
Wrinkle Analyzer TiVi90 3.3
Sida 40
TiVi90 Wrinkle Analyzer
10. Click the Reset button. To remove segment 2 (which is part of the eye brow rather than a
wrinkle segment) from the Wrinkle Map, point at this segment by the mouse pointer, press
the left mouse button and drag the mouse pointer to a position outside the Wrinkle Map
with the mouse button pressed.
Wrinkle Analyzer TiVi90 3.3
Sida 41
TiVi90 Wrinkle Analyzer
11. The remaining wrinkle segments are now renumbered. Click the Export Data button and
save the information about the wrinkles segments in an Excel file.
12. Open the Excel file to display the wrinkle information.
In order to make meaningful comparison of two photos with Craw-foot wrinkles the
parameters Removes Small Objects and the Wrinkle Threshold must have the same
settings in both photos.
Wrinkle Analyzer TiVi90 3.3
Sida 42
TiVi90 Wrinkle Analyzer
6. DETAILED DESCRIPTION
6.1 Wrinkle Analyzer TiVi90 main window
When the Wrinkle Analyzer TiVi90 is started in tool-box mode from inside the TiVi700
Analyzer, the first photo in the sequence loaded in the TiVi700 software is automatically
transferred to the Wrinkle Analyzer TiVi90.
In the Wrinkle Analyzer TiVi90 window the photo forehead-0001. jpg has been uploaded
by clicking the Load Photo button and then double-clicking the file icon forehead0001.jpg in the TiVi90demonstration folder.
The name of the photo is displayed in the Load Photo edit box, while the Height and Width
of the photo (in pixels) are displayed in the upper right corner of the Photo frame together
with the Date at which the photo was captured. The next user action “Draw a Region of
Interest” is displayed above the photo in the Photo frame.
1. Edit box – shows the name of the photo displayed.
2. Load Photo – to upload a photo from the hard drive.
3. Wrinkle Map – to open the Wrinkle Map window.
Wrinkle Analyzer TiVi90 3.3
Sida 43
TiVi90 Wrinkle Analyzer
4. Rotate Photo – rotates the displayed photo 90 degrees counter-clockwise. To be used
if the wrinkle to be analyzed runs vertically.
5. Show ROI – to display a region of interest if a ROI is drawn. When this button is
clicked the action can be reversed by clicking it again (now labeled Undo Show ROI).
In the ROI photo the green frame indicates the borders for placing the mouse to start a
tracking procedure.
6. Abort – clicking this button aborts the current track action .
7. Undo Track – erases the latest wrinkle track.
8. Refresh – erases all tracks and ROIs.
9. Load Session – to load a saved session.
10. Save Session – to save a session.
11. Display Session – to display the results in a new window (the Display Session
window). Several Display Session windows can be kept open simultaneously.
12. Display Trend – to open the Trend window in which the overall results are
displayed.
13. Clear All – resets the TiVi90 system and prepares it for capturing or uploading a new
photo.
14. Save Coord – to save the coordinates of the centre points of tracks and the associated
ROI.
15. Load Coord - to load the coordinates of the centre points of tracks and the associated
ROI.
16. Adjust Coord – to automatically make the final adjustment of green dots positions
(indicating track centre points) provided they are positioned in the vicinity of the
actual wrinkles.
17. Start Tracking – to automatically start tracking if the associated green dots are in
position.
Wrinkle Analyzer TiVi90 3.3
Sida 44
TiVi90 Wrinkle Analyzer
The Wrinkle Appearance Index (WAI), (Depth, Volume and Asymmetry) is displayed in
the Wrinkle Appearance frame together with the number of the wrinkle profile/structure
displayed. The large vertical bars represent the standard deviation while the shorter and
thicker bars represent to standard error of the mean.
18. Narrow Track – to be checked if the track is to be continuous without any
interruptions (recommended). With Narrow Track checked, the track-point is shifted
no more than one pixel as the tracking proceeds from one vertical line to the next. This
facilitates the generation of a smooth track.
19. Auto Stop – to be checked if the track is to be automatically stopped when the wrinkle
becomes too fuzzy.
20. Wrinkle Structure – click this button to display a 3D profile of the wrinkle in the
Wrinkle Appearance frame. Placing the mouse pointer on the structure changes the
pointer to circular. The view angle can be altered by moving the mouse while keeping
the left mouse button pressed.
21. Wrinkle Profile – click this button to display the average profile of a wrinkle in the
Wrinkle Appearance frame.
22. Step Through– click this button successively to display either to Wrinkle Structure
or the Wrinkle Profile of the actual tracks (up to ten tracks allowed).
23. Close – to close the Wrinkle Analyzer TiVi90 window.
Wrinkle Analyzer TiVi90 3.3
Sida 45
TiVi90 Wrinkle Analyzer
24. Export – to save the data associated with the tracked wrinkles in a MS Excel file
(ASCII-format).
25. Parameter Settings – opens a new window in which the wrinkle tracker parameters
can be set. The actual numerical values of these parameters are displayed in the
separate Wrinkle Parameters frame.
26. Drop Data – to open the Drop Data window into which wrinkle parameters can be
automatically exported.
27. Manual – online version of the Wrinkle Analyzer TiVi90 manual.
28. Language – to set the actual language (available only in stand-alone mode).
29. About –to display the Wrinkle Analyzer TiVi90 About window.
30. DemoAssistant – to open the Demo Assistant for online assistance on how to use the
Wrinkle Analyzer.
6.2
TiVi-90 Wrinkle Analyzer Parameter Settings window.
The Settings Parameter window is used for setting and saving the different track parameters.
1. Factory Settings – used for uploading the factory values (Default values) of the track
parameters.
2. Save Settings – used for saving the actual track parameters. These values are
automatically uploaded the next time the Wrinkle Analyzer TiVi90 is opened.
Wrinkle Analyzer TiVi90 3.3
Sida 46
TiVi90 Wrinkle Analyzer
3. Load Settings – used for uploading the saved track parameters.
4. OK – click this button to accept the new settings and close the Parameter Settings
window.
The following tracking parameters can be set either by dragging the slider to the target
value or by printing the target value in the edit box and clicking the keyboard Enter
button.
1. Track Length – determines the length of the track in horizontal pixels. During a
tracking procedure the tracking starts at the mouse pointer (after clicking the left
mouse button) and first tracks to the right (half track-length) and then tracks to the
left (half track-length). The centre point of the track is marked by a green square.
2. Track Width – determines the number of vertical points around the latest trackpoint used to calculate the next track-point. This is done by calculating the
minimum value along the Track Width and uses this minimum value as the next
track point.
3. Trackpoint Size – sets the size of the track point (in pixels).
4. Guidepoint Size – sets the size of the Track Width points (in pixels).
5. Track Limit – the maximum number of pixels the track is allowed to jump in the
vertical direction in between two successive track points. In operation only if the
Narrow Track checkbox is un-checked.
6. Stop Index – this parameter determines how well defined the minimum value
along Track Width has to be to be classified as a true track point and not a
random minimum value only. In operation only if the Auto Stop checkbox is
checked.
7. Technically the Stop Index is compared to the relative difference of the minimum
value and the average value along the Track Width. A low value of Stop Index
value is less tolerant to identifying a track point than a large value is.
8. Number Out of Track – sets the number of successive failures to identify a track
point before the system determines that the wrinkle depth is too shallow to be dealt
with. If the Number Out of Track is exceeded and the system tracks to the right,
the actual tracking procedure stops and the system starts tracking to the left. It the
system tracks to the left and the Number Out of Track is exceeded, the tracking
procedure is completed and the profile, structure and WAI values are calculated
based on the reduced Track Length.
6.3
TiVi-90 Wrinkle Analyzer Display window.
The Wrinkle Analyzer Display Session window is generated by clicking the Display
Session button in the main window. The Display window displays the result of a specific
Wrinkle Analyzer TiVi90 3.3
Sida 47
TiVi90 Wrinkle Analyzer
session. An infinite number of Display Session windows can be kept open and used as
references.
1. Wrinkle Structure – to display the wrinkle structure in the Wrinkle Appearance
frame.
2. Wrinkle Profile – to display the wrinkle profile in the Wrinkle Appearance
frame.
3. Step Through – click to manually step through the wrinkle structures or profiles.
4. Close – to close the Display Session window.
6.4
TiVi-90 Wrinkle Analyzer Trend window.
The Wrinkle Analyzer Trend window is generated by clicking the Display Trend
button in the main window. The Trend window displays the overall results in terms of
Depth, Volume and Asymmetry of the wrinkles versus wrinkle number or session.
Wrinkle Analyzer TiVi90 3.3
Sida 48
TiVi90 Wrinkle Analyzer
1. Load session – to upload one or more sessions simultaneously. To load more than
one session press the Ctr button and click on the sessions to be uploaded by the
mouse pointer in the Pick a File window.
2. Export – to export the results to a MS Excel spread-sheet for further analysis.
3. Wrinkle – to select if the Wrinkle Appearance Parameters are to be displayed as a
function of wrinkle number or date of recording the photo associated with the actual
session. Session – to select if the Wrinkle Appearance Parameters are to be
displayed as a function of session number.
4. Depth (in Select Display frame) – to display the depths of the wrinkles.
5. Volume (in Select Display frame) – to display the volumes of the wrinkles.
6. Asymmetry (in Select Display frame) – to display the asymmetry of the wrinkles.
6.5
DropData.
1. Open the DropData window by selecting DropData from the TiVi Wrinkle Analyzer pulldown menu.
Wrinkle Analyzer TiVi90 3.3
Sida 49
TiVi90 Wrinkle Analyzer
2. The table displays wrinkle data such as wrinkle number, track length, track width, track
mode, wrinkle depth, wrinkle volume, wrinkle asymmetry and a column for inserting
comments in the table.
3. The Name of the table (selected by the Save As function) is displayed above the table.
4. Load Table – to load an existing DropData table.
5. Save As – to save the actual table under a selected name.
6. Save – to save the actual table under its preselected name.
7. Export Data – to export table data to an Excel spread-sheet.
8. Select Photo menu – to select a photo to display in the Show Photo window.
9. Delete Photo – to delete a photo from the actual table.
10. Bar Graph – to display wrinkle data as a rotatable bar graph.
11. Close – to close the DropData awindow.
12. Open the Show Photo window by selecting a photo in the Select Photo menu.
Wrinkle Analyzer TiVi90 3.3
Sida 50
TiVi90 Wrinkle Analyzer
13. Copy – to copy the photo to the windows clipboard from where it can be inserted into e.g.
an Excel spread-sheet.
14. Tracks – to display the tracks in the actual photo.
15. Region – to display the region of interest.
16. Photo - to display the entire photo.
17. Close – to close the Show Photo window.
Wrinkle Analyzer TiVi90 3.3
Sida 51
TiVi90 Wrinkle Analyzer
6.5
Wrinkle Map
1. Photo panel – displays the ROI of the actual photo.
2. Wrinkle panel – displays the corresponding Wrinkle Map with the wrinkle segments
highlighted and the background skin displayed in grayscale colour.
3. File Name – displays the actual filename.
4. Remove Small Objects slider and edit box – to remove small objects from the wrinkle
map.
5. Wrinkle Threshold slider and edit box – to change the threshold level for wrinkle
detection.
6. Dragging the mouse pointer, after pointing on a wrinkle segment and pressing the left
mouse button, to a position outside the Wrinkle Map – to remove the actual wrinkle
segment from the wrinkles Map.
7. Undo Erase – to restore the original set of wrinkle segments.
8. Enumerate / No Numbers – to display or hide wrinkle segment numbers.
Wrinkle Analyzer TiVi90 3.3
Sida 52
TiVi90 Wrinkle Analyzer
9. Export Data – to export wrinkle segment information to an Excel spread-sheet.
10. Load Settings – to load saved wrinkle parameters (Remove Small Objects and Wrinkle
Threshold) and apply these to the actual Wrinkle Map.
11. Save Settings – to save the current Remove Small Objects and the Wrinkle Threshold
parameters.
12. Scan Through – to display the wrinkle segments one by one together with information
about wrinkle segment number, area and wrinkle score.
13. Reset – to reset the Scan Through procedure and display all wrinkle segments.
14. Close – to close the Wrinkle Map window.
Wrinkle Analyzer TiVi90 3.3
Sida 53