1
DEPARTMENT OF ELECTRICAL AND COMPUTER ENGINEERING 807 UNION STREET SCHENECTADY, N Y 12308 ECE-‐499 Senior Project Report Propulsion and P.I Control Systems for SAE Aircraft Ervin Meneses, Propulsion Engineer Partners: Joseph Laub, Telemetry Engineer Joshua Fields, Structural Engineer R. Matthew Lattanzi, Auxiliary Engineer Matthew Wenner, Systems Engineer Advisor: John Spinelli, Ph.D. March 18, 2015 Meneses 2 Table of Contents Executive Summary ..................................................................................................................................... 5 Introduction ................................................................................................................................................. 5 The Problem ............................................................................................................................................ 7 The Objective ........................................................................................................................................... 7 Background ............................................................................................................................................ 8 History of Remote Controlled Aircrafts ............................................................................................ 8 Economic ............................................................................................................................................ 9 Union Aero Competition History .................................................................................................... 10 Manufacturability ............................................................................................................................. 11 Ethical ............................................................................................................................................... 12 Health and Safety ............................................................................................................................. 12 Figure 1 Balance Adapter Connection ............................................................................................... 13 Figure 2 Charging Set Up ................................................................................................................. 13 Figure 3 Rear View of Test Bed .......................................................................................................... 14 Sustainability ..................................................................................................................................... 15 Previous Work ....................................................................................................................................... 15 Figure 4 2014 Electric Propulsion Block Diagram .............................................................................. 15 Design Requirements ................................................................................................................................. 17 Determination of Constraints ................................................................................................................ 18 Figure 5 2014 Union College Aero Design Team ................................................................................ 19 Goals for Performance ....................................................................................................................... 19 Table 1 18x8 First Trial Data .............................................................................................................. 20 Table 2 18x8E First Trial Data ............................................................................................................ 21 Figure 6 Dx6i Transmitter and Throttle Joystick ................................................................................ 22 Figure 7 PWM Widths of Control Signal ............................................................................................ 23 Table 4 Width Range of Control Signal .............................................................................................. 24 Figure 8 4000mAh 30C E-‐Flite Li-‐Po Battery ...................................................................................... 24 Design Alternatives .................................................................................................................................... 25 Figure 9 GUI of Drive Calculator ........................................................................................................ 25 Component Selection ............................................................................................................................ 26 Figure 10 Last year’s Motor and ESC Combination ............................................................................ 27 Meneses 3 Figure 11 This Year's Motor and ESC Combination ............................................................................ 27 Table 5 Propeller Thrust Data ............................................................................................................ 28 Figure 12 18x8E raw and processed data .......................................................................................... 29 Figure 13 3200mAh &4000mAh Battery Comparison ....................................................................... 30 Table 6 Final Electronic Selection ...................................................................................................... 30 Preliminary Proposed Design ..................................................................................................................... 32 Figure 14 2015 Initial Electric Propulsion System Design .................................................................. 32 Figure 15 PID Control Block Diagram ................................................................................................. 33 Alternative ............................................................................................................................................. 33 Final Design and Implementation .............................................................................................................. 34 Figure 16 PI Control Block Diagram ................................................................................................... 34 Figure 17 2015 Final Electric Propulsion System Design .................................................................... 35 Figure 18 P.I Control Algorithm ......................................................................................................... 36 Figure 19 Arduino Mega 2560 ........................................................................................................... 37 Figure 20 DF Robot 50A Current Sensor ............................................................................................ 38 Performance Estimates and Results .......................................................................................................... 38 Figure 21 500W Set Point Test ........................................................................................................... 38 Figure 22 SAE Power Limiter Test ...................................................................................................... 39 Figure 23 Limiter Effect ...................................................................................................................... 40 Figure 24 Crashed P1 Murcielago ...................................................................................................... 41 Figure 25 PI Controller Test ............................................................................................................... 42 Production Schedule .................................................................................................................................. 43 Table 7 Project Schedule ................................................................................................................... 43 Cost Analysis .............................................................................................................................................. 44 Table 8 Component Cost ................................................................................................................... 44 User’s Manual ............................................................................................................................................ 45 Figure 26 Current Sensor Wire Exposures ......................................................................................... 47 Figure 27 Analog Wire With Female and Solid Tips ........................................................................... 48 Conclusion ................................................................................................................................................. 49 Recommendations ..................................................................................................................................... 49 Future Work ............................................................................................................................................... 50 Acknowledgements ................................................................................................................................... 52 Meneses 4 References ................................................................................................................................................. 53 Appendix A: Charging Battery Procedure .................................................................................................. 54 Appendix B: Testing Propeller Procedure .................................................................................................. 55 Figure 28 Custom Female/ Male Dean's Connector .......................................................................... 56 Figure 29 BNC Alligator Connector .................................................................................................... 56 Figure 30 Fireproof Battery Bag ......................................................................................................... 57 Figure 31 Hall Effect Sensor Set Up ................................................................................................... 57 Figure 32 Watt Meter and Power Limiter .......................................................................................... 58 Appendix C: Thrust Data Collection Procedure ......................................................................................... 59 Figure 33 Screen After Selecting Home Button ................................................................................. 60 Figure 34 Top View of GLX Load Cell ................................................................................................. 60 Appendix D: Voltage Divider Design and Code .......................................................................................... 61 Figure 35 Voltage Divider Calculations .............................................................................................. 61 Appendix E: Current Sensor Sample Code ................................................................................................. 63 Appendix F: P.I Control Code ..................................................................................................................... 65 Appendix G: MATLAB® Code ..................................................................................................................... 73 Meneses 5 Executive Summary This document presents the final design of the propulsion and P.I Control Systems for the aircraft dubbed Murcielago produced by the Union College Aero Design Team for participation in the 2015 Society of Automotive Engineers [hereon on referred to as ‘SAE’] Aero Design West Competition-‐ Regular Class [hereon referred to as ‘the Competition’]. The final propulsion and P.I control systems for the C1 Murcielago, were optimized to make the aircraft highly competitive at the Competition, while also abiding by competition rules and regulations. In this report I will provide detail about the following: •
The Problem •
Design Requirements/Alternatives •
Goals •
Preliminary & Final Design •
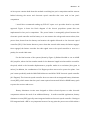
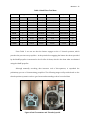
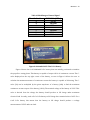
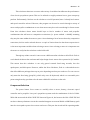
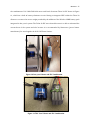
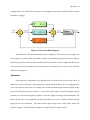
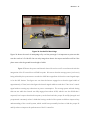
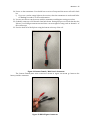
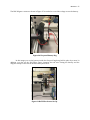
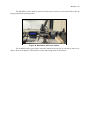
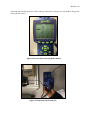
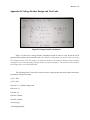
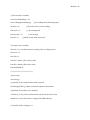
Results In addition, I will elaborate on the process that I have gone through for collecting thrust and power data for different Advanced Precision Composite [hereon referred to as ‘APC’] propellers and motor combinations, the obstacles I have encountered throughout the testing process, and the status of my project at the conclusion of this term. I hope that the information provided in this report serves as a worthy platform that provides my successor with relevant information about my project with the hope that they build upon my work and learn from my mistakes. Introduction For the past seven years the Union College Aero Design Team has been competing in the SAE Aero Design Competition. In the past the team has competed against schools like Virginia Tech, University of Michigan, Warsaw University of Technology (Poland), and Universidade Estadual de Meneses 6 Campinas (Brazil). All which have an immense aerospace program and sponsorship relationships with well-‐known aerospace firms such as Lockheed Martin and Boeing. However, even though The Union College Aero Design Team does not have an aerospace program nor any vast sponsorship relationships, the team has done well in the past by ranking within the top 10 teams out of 40 for the past three years. The SAE Aero Design Competition is intended to provide undergraduate engineering students from different disciplines with an exceptional and stimulating engineering challenge (SAE Aero Design Rules). The competition is heavily geared towards pushing students beyond the limits of textbooks and laboratories by having students design, build, and test the performance of an actual airplane. The competition itself is divided into three main phases. In the first phase, prior to attending the competition, each team is required to electronically submit a design report detailing how their design has met or exceeded the design requirements. In the second phase, each team has to give an oral presentation about their aircraft design and at the same time demonstrate payload loading and unloading (the on/off loading demonstrations are timed). The third phase is the actual fly competition. This year the Union College Aero Team will serve as the transition year as we (Joseph and I) will be setting the foundation for future teams to compete in the Advance Class competition. Please take a look at Joseph Laub’s ECE 499 report to get further insight about the Advance Class competition. For this year’s competition there are rules that will heavily influence the overall design of the propulsion system and airplane. The most important rules have been taken from the 2015 SAE Aero Design Rule book, which include: 1. The power utilized by the propulsion system will be monitored by a new 1000 watt power limiter from Neu Motors Meneses 7 2. The aircraft must now be powered by 6 cell 22.2 volt Lithium Polymer battery with a minimum requirement of 3000mAH @ 25C 3. The maximum combined length, width, and height must be 175 inches These rules have required the design team to reconsider some aspects of the overall design of the aircraft. For example, with a higher battery cell count, I am required to find a new propeller, motor and electronic speed controller combinations that will provide us with the maximum amount of thrust which will, in return, allow us to carry a heavier payload and influence the aerodynamic and structural design of the airplane. The Problem The Competition encompasses the design and production of a large-‐scale remote controlled aircraft that must meet predetermined power and size constraints (see Design Requirements). The overall objective of the competition is to design and build an aircraft that is able to carry the maximum amount of weight as possible within a takeoff runway of two hundred feet (SAE Aero Design Rules). In addition, the SAE Committee requires competitors to integrate the new 2015 SAE 1kW power limiter within the circuit path of the propulsion system. The power limiter is designed to even out the playing field by forcing each competitor to perform under the same power constraints and penalizing any teams that exceed the 1kW threshold. The Objective There are five seniors in the Union College Aero Design Team this year; each team member will be responsible for the design and construction of different aspects within the aircraft. As the propulsion engineer, my responsibility within the team lays in the design and implementation of the electric propulsion system (EPS) for the airplane. The electric propulsion system will have a significant impact on the aircraft’s performance at the Competition; therefore designing an optimal system that meets all competition requirements Meneses 8 is critical to the team’s success. Since this is the second year that the Competition has mandated the use of an EPS, I suspect all teams will have similar improvements and issues in both the propulsion system and aircraft design. The team has to design a light and highly efficient airplane that provides maximum thrust. By meeting all three standards, the team will have a higher chance of being successful at the Competition. As the propulsion engineer, my goal is to provide my team with an aggressive electric propulsion system that complies with the SAE Aero Rules and provides more than 11lbs of thrust. Accurately predicting the thrust our electric propulsion system can provide is critical to the airplane design, since both the structure and aerodynamic design are heavily dependent on the available thrust the propulsion system can generate. Additionally, developing a complete understanding of the functionality of the specified power limiter is crucial to the aircraft’s performance due to its vital role during the competition. As stated previously, my responsibilities include the design of the electric propulsion system. Mathew Latanzi is responsible for the design of the landing gear and auxiliary systems. Joshua Fields is in charge of the structural design of the airplane, Mathew Wenner is in charge of the overall aerodynamic structure of the airplane, and Joseph Laub is in charge of the telemetry system (that will be used in future competitions). The five of us make up the 2015 Union College Aero Design Team. Although each member is responsible for the design of a particular section of the aircraft, we are all expected to contribute wherever help or insight is required. Background History of Remote Controlled Aircrafts In 1871, a French pioneer of aviation design and engineering called Alphonse Pénaud created an airplane powered by twisted rubber (now known as the propeller). Pénaud went on to Meneses 9 design a full sized aircraft with a numerous amount of features (Lienhard). He inspired many to believe that powered flight had potential. The earliest examples of electronically controlled aircrafts date back to the late 19th Century. These aircrafts were flown as part of a musical act around audiences using a spark emitted radio signal (Boddington). This technology soon grabbed the attention of both the European and American armed forces and quickly began to explore the combination of radio controlled power and flight during the early 20th Century as World War II approached. Radio controlled aircrafts were developed in the late 1940’s and early 1950’s by Howard Boys (Imrie). There are many types of radio-‐controlled aircrafts, for example helicopters, jets, sailplanes, gliders, pylon racers, and etc. Homemade models became really popular in the time that R/C (remote controlled) hobbyist started building their own planes by hand using materials such as balsa wood, which is still a method used today (BBMAC). The building process of an R/C plane is very extensive and requires patience and time. At the time, being creative with a design meant more work as there weren’t any customizable parts as there are today. Economic Once R/C models reached a point of popularity many manufacturers saw the opportunity to capitalize on the demand and began producing interchangeable parts and putting them on the market. At this point anyone who could follow detailed instructions and had the means to purchase a kit was capable of building his or her own R/C airplane. At first, all R/C planes were powered by gas engines. It wasn’t until the early 1970’s that hobbyist saw the production of cheap and rechargeable nickel-‐cadmium batteries, which revolutionized the R/C plane industry (BBMAC). Motors that can run on rechargeable batteries along with new materials (at the time) such as plastic, foam, and fiber glass lead to the market of ready-‐to-‐fly planes sold today (BBMAC). Meneses 10 R/C air crafting as a hobby has grown worldwide with the introduction to highly efficient motors (both electric and combustion) along with lighter and more powerful batteries (Li-‐Po). The cost of an R/C aircraft varies in today’s market, especially between homemade and commercial planes. A lot of factors come into play when placing a price tag on a model. For example, size, material, and the application of the aircraft play a big role when determining its value. From my research (Google) R/C airplane models range from $100-‐$1200; this is including sophisticated drone quad copters. Taking the custom route may or may not lead to a cost effective airplane. It all depends on what materials one plans to use for building the plane. For example, if somebody wants to build an airplane made out of pure carbon fiber then his/her cost is going to be higher compared to somebody who is using balsa wood. Union Aero Competition History The Union College Aero Design Team has been competing in the SAE Aero Design Competition for the past 7 years. Through the course of this competition students will find themselves performing trade studies and making compromises to attain a design solution that will optimally meet the mission requirements while still obeying the design constraints (SAE Aero Introduction). The SAE Aero Design Competition provides three classes of competition, the Regular, Advanced, and Micro. This is the second consecutive year that the Regular class has required teams implement and electric propulsion system. According to the SAE Aero Design Rule Book, the purpose of making the Regular Class now all electric is so that it is simpler than the Advanced Class and therefore more accessible to new teams. Meneses 11 As a team coming from a small liberal arts school, approximately 2200 students, we have done exceptionally well in the past. Last year the team placed 10th out of 42 teams and the year before that the team placed 8th out of 37 teams. Manufacturability Material availability is always an issue when designing and manufacturing a product. Many factors come into play when deciding whether or not one should use commercial or custom components. For example, the cost and level of complexity of a certain commercial component that is useful to me may be too advanced for my simple desired application, which may lead me to contemplate taking the custom route. However, it is important to point out that this is not always the case. For my project I do not have flexibility when it comes to selecting commercially available and custom items. The SAE Aero Design Rules do not allow teams to purchase premade aircrafts and enter them in the Competition, with that said we are required to customize the entire aircraft body. There are no restrictions in the customization of electronic components, but seeing how there are already devices that meet our needs (speed controller, transmitter, power limiter, and receiver) , so for the propulsion system design we are going to use commercially available components. In addition, even though there aren’t any restrictions to propeller material, this year we will be using APC propellers, which are a standard in R/C applications. The SAE Committee requires each team to use a power limiter from their supplier Neu Motors, who are specifically designing the limiter for the 2015 SAE Aero Design Competition. It is important to point out that all the electronic components used during the testing and research phase, have been provided by last year’s aero design team. The only additional electrical components that we (John Spinelli specifically) have ordered have been a set of new required 6-‐cell 22.2-‐volt lithium polymer batteries that differ in capacity and the new 2015 power limiter. Meneses 12 Ethical Throughout the testing and research phase of the project I have come across alternative applications for aircrafts similar to the one we are building. One of the applications that I came across was the use of the plane as a stealth bomber, which can be used as a weapon and lead to harming society. This type of application to an extent is not possible with our designed aircraft because it would require the implementation of sophisticated technology, which we do not have the means to access. On the other hand, similar to the stealth bomber function, our aircraft can potentially be used to deliver humanitarian aid packages in areas where a natural or man-‐made disaster may have struck. Besides the two examples I have presented, I have not come across any other issues in the design or testing process that could be used cause harm to anyone. Both of these applications can serve as unintended and intended examples for possible uses of our aircraft. Health and Safety For this competition we are required to use a 6-‐cell 22.2-‐volt lithium polymer battery with a minimum rating of 3000mAh with a discontinuous discharge of 25C. The power that a 6-‐cell lithium polymer battery encapsulates is not insignificant and should not be overlooked by the user. Certain lithium polymer batteries have high inrush currents that can exceed 100A and due to the chemistry of lithium cells there is a possibility of an explosion occurring when improperly charging the battery (Max Amps). When running tests with this battery it is important to take care of it and treat it with respect. In addition to the battery, one must also not overlook the potential threat that the propeller holds to the user and anyone near it when testing. I, unfortunately, was not aware of how sharp propellers can be and had to learn the hard way (I slit my finger removing the wrapping plastic on a propeller). Meneses 13 In order to prevent any future possible injuries Joseph and I have developed specific protocols when working with the battery, motor, and propeller. The battery protocol details how one should go about charging and storing a battery and the motor protocol outlines the steps one should follow to set up communication channel between the motor and the transmitter. For more information please take a look at the appendices as it provides a step by step instructions for each procedure. Figure 1 Balance Adapter Connection Figure 1 shows the connection between the multi colored connections from the battery to the balance adapter board of the EZ Peak Plus Charger. Figure 2 Charging Set Up Meneses 14 Figure 2 shows a completed version of the charging procedure. As you can see from Figure 2 the battery is placed in a fireproof bag and isolated from any other electronics. It is important to point out that overcharging a Li-‐Po battery can damage one of the cells and can potentially lead to a useless battery or even worse, an unwanted explosion. Furthermore, for the series of steps needed to charge a battery, configure the test bed and initialize propeller testing please take a look at the Appendix A and B. Once the steps for setting up the test bed are completed, everything is prepped to start running the motor and start collecting data for different APC propellers. It is important to be in an isolated room prior to running tests with the motor since it has the potential to hurt someone once it reaches high RPM’s. For security, keep the people in the test room to complete minimum and always stand behind the test bed. The following figures display what the typical test setup looked like when collecting thrust and power data. : Figure 3 Rear View of Test Bed Meneses 15 Figure 3 shows the side and rear view of the test bed with all of the electronic components connected. One can see the connection between the PASCO® Dual Load Cell amplifier (stress sensor) and the Xplorer GLX Graphing Data Logger (blue device), which is the device used to measure and save the forward thrust provided by each propeller. Additionally, all electric measurements were recorded using the oscilloscope and Hall Effect sensor (current probe) seen in Figure 3. The Hall Effect sensor was used to accurately measure the current being drawn for the battery. In this image you can also see the transmitter and the fireproof bag where the lithium polymer battery should be placed at all times whether one is testing with it or storing it. For more information on how to set up the graphing calculator used during the testing phase please look at the Appendix C. Sustainability Since I’m participating in a competition based project the product or the plane in this case is only expected to have a life cycle of the same length as the competition, which is 3 days. One of the main reasons why the life expectancy is so short is because during competition the aircraft will be receiving damage that may or may not be adjustable. In addition, the rules for this competition tend to change every year so a new design will have to be built in the future, which means that our design will only be put to use during this year’s competition. Previous Work Since this is the second year that the competition has mandated the use of an EPS, I would like to recommend reading Richard Hojnacki’s MER-‐ 497 and 498 reports. Figure 4 2014 Electric Propulsion Block Diagram Meneses 16 As his reports contain detail about his method on tackling last year’s competition and the reasons behind selecting the motor and electronic speed controller that were used in last year’s competition. I would also recommend reading my ECE-‐497 report as it provides detail to my initial approach. Figure 4 shows the block diagram of the electric propulsion system that was implemented in last year’s competition. The power limiter is strategically placed between the electronic speed controller and the battery so it can measure the voltage and current values, thus power draw, drawn from the battery and monitor the signals delivered to the electronic speed controller (ESC). If the limiter detects a power draw that exceeds 1000 watts, the limiter engages. Once engaged, the limiter overrides the radio signal sent to the speed controller to serve as a penalty for exceed 1000 watts. For the final version of the system (shown by Figure 4) Richard decided to use an 18x8E APC propeller, where the first number stands for the diameter length in inches and the second for the pitch, which is the forwards displacement a propeller makes in a revolution (also given in inches). In addition, the combination of O.S Engine products was used to power the plane. Last year’s team specifically used the OMA-‐5020-‐490 motor and OCA-‐170HV electronic speed controller (O.S. Engines). The electronic speed controller does not come with an integrated battery eliminator circuit (BEC), which means that last year’s team required an external NiCad or NiMH battery pack to power the receiver and servos. Battery eliminator circuits were designed to deliver electrical power to other electrical components without the need of an additional battery. In radio-‐controlled applications, battery eliminator circuits (BEC) typically come integrated within an electronic speed controller. Having an ESC integrated with a BEC is very important because if at any point the power source falls within a Meneses 17 certain threshold the BEC cuts the power to the main drive, which in our case is the motor, and provides the remaining power to the servos to safely land the aircraft. According to Richard, the propulsion system he designed and installed on the aircraft utilized about 850 watts, which means that it only utilized 85% of the allowed power. Therefore there is at least a 10% increase in power that I can have my system utilize for this year competition. This would leave a 5% gap between the operating point of the system and the point at which the limiter is engaged. Design Requirements This is the second year in in competition history that the Competition requires an electric propulsion design. The SAE Aero design rules state in section 4.31 and 4.3.3 that only one single motor configuration is allowed onboard the aircraft and the aircraft must be powered by a commercially available 6-‐cell 22.2 volt lithium polymer battery with a minimum rating of 3000mAh with a discontinuous discharge of 25C (SAE Aero Design Rules). There are no restrictions to the make or model of the electric motor. However, the SAE Committee has made the implementation of a 1000-‐watt power limiter mandatory, Section 4.3.4 of the SAE Aero Design rules state that all regular class aircraft must use a New 2015, 1000-‐watt power limiter from our supplier Neumotors.com (SAE Aero Design Rules). The application of the power limiter forces each team to perform under the same power constraints by penalizing any teams that exceed the 1000 watt power threshold. The only information provided to the team regarding limiter functionality was the following: “The device ensures that all teams compete with the same power levels. The device monitors the battery voltage and current and will interrupt the motor power if more than 1000 watts are being used from the battery. The device will allow 2 seconds window Meneses 18 without limiting power after the first time exceeding 1000 watts, afterwards the power will be cut immediately.” While the competition guidelines suggest a supplier, the supplier provided little insight as to how power limiters actually function. In order to eliminate this substantial gap in information, it is my responsibility to rigorously test and analyze the limiter. With that said, I am also responsible for making sure that the whole electric system’s power consumption does not surpass the 1000-‐
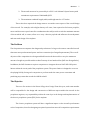
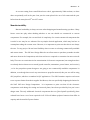
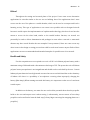
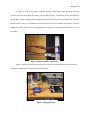
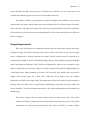
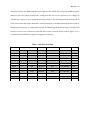
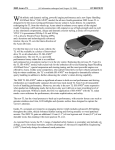
watt threshold. In the past teams have been cautious by designing there system to only utilize 75% of the powered allowed (Hojnacki). This year, I plan on designing an aggressive system by having it utilize the highest amount of power without engaging the power limiter. Determination of Constraints The design requirements stated by the SAE Aero Rule Book play a big role in the overall constraints of size, weight, and cost. For example, limiting our maximum output power to 1000 watts, limits teams from potentially reaching the selected motors maximum RPM value, which directly relates to the amount of thrust the motor will provide the plane. In addition, the use of a commercial 6-‐cell battery (2-‐cell increase from last year) will affect the weight of the plane since a higher battery cell count directly relates to a heavier battery. Furthermore, the aircraft we enter to the competition must not weigh more than 55 pounds including the payload (SAE Aero Design Rules), which influences our choice of materials for building the plane. As far as material restrictions are concerned, the use of Fiber-‐Reinforced Plastic and lead are the only materials that are not allowed on the aircraft (SAE Aero Design Rules). The size constraint was mentioned earlier in the report, but to reiterate the maximum combined length width and height of 175 inches (approximately 14.5 feet). Meneses 19 Manufacturing an R/C plane is not an easy task. Earlier in the report I mentioned hobbyists build their own planes by hand, using materials such as balsa wood. Well that has not changed, as we are currently using balsa wood in our design because it is a very light material. Reducing the weight of the plane is crucial because it will allow us to transfer the cut weight into the payload carried by the plane. The building process of an RC plane is very extensive and requires patience and time. Figure 5 2014 Union College Aero Design Team Figure 6 shows last year’s competing team along with Professor Bruno, the teams head advisor. Since this is the first year that the team has ever had a pair of electrical engineering students, John Spinelli operates as the team’s second advisor. Goals for Performance Based on the specifications, we are going to design an aircraft that can successfully and safely out carry any other competitor. In addition we want our design to meet all design constraints and in order to make this happen, the team collectively has to put their best effort into the designing, building, and testing process. I would like to significantly increase the thrust provided by the motor and propeller combination. In Richard’s MER-‐498 report, he states that the average Meneses 20 thrust provided by the OMA-‐5020-‐490 motor and the OCA-‐170HV ESC along with 18X8E propeller and the 4-‐cell Li-‐Po battery was 8.65 lbs. Seeing how this year we are required to use a bigger (6 cell) battery, I expect to see a significant increase in thrust. The following tables provide detail on some of the thrust and electric data that I collected using the 6-‐cell battery during the first weeks of taking upon this project. It is important to point out that during the first few weeks of testing I did not have access to the oscilloscope and Hall effect sensor (current probe) seen in Figure 3, so I recorded the data manually using the Turnigy power analyzer. Table 1 18x8 First Trial Data
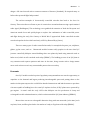
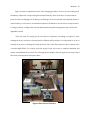
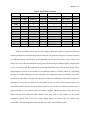
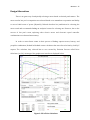
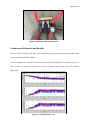
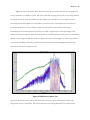
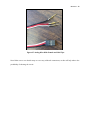
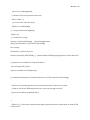
Motor O.S. Engine OMA-‐5020-‐490 Trial 1 Voltage (V) Position 25.11 -‐3 0 25.11 -‐2.5 25.07 Battery E-‐Flite 6s 4000mAh Current (A) Power (W) Propeller 18x8 Thrust (N) Thrust (lbs) Time (s) 0 0.1 0.02248089424 0 0 0 0.1 0.02248089424 20 -‐2 0.59 14.7913 2.4 0.5395414619 40 24.98 -‐1.5 1.98 49.4604 8.2 1.843433328 60 24.75 -‐1 5.81 143.7975 20.1 4.518659743 80 24.37 -‐0.5 11.84 288.5408 28.4 6.384573965 100 23.79 0 19.53 464.6187 38.9 8.745067861 120 23.23 0.5 27.09 629.3007 45.5 10.22880688 140 22.75 1 34.39 782.3725 50.7 11.39781338 160 Limiter 1.5 Limiter Limiter Limiter Limiter 180 Meneses 21 Table 2 18x8E First Trial Data Motor O.S. Engine OMA-‐5020-‐490 Trial 1 Voltage (V) Position 25.05 -‐3 0 25.05 -‐2.5 25.03 Battery E-‐Flite 6s 4000mAh Current (A) Power (W) Propeller 18x8E Thrust (N) Thrust (lbs) Time (s) 0 0 0 0 0 0 0 0 10 -‐2 0.62 15.5186 3.5 0.7868312986 20 24.93 -‐1.5 2.22 55.3446 11.1 2.495379261 30 24.78 -‐1 5.27 130.5906 20.2 4.541140637 40 24.38 -‐0.5 11.79 287.4402 30.1 6.766749168 50 23.94 0 20.12 481.6728 41.8 9.397013794 60 23.50 0.5 27.42 644.37 50.8 11.42029428 70 23.02 1 35.29 812.3758 54.7 12.29704915 80 Limiter 1.5 Limiter Limiter Limiter Limiter 90 Table 1 and Table 2 show the current, voltage, and power values I collected at different throttle positions for two different propellers using the set up shown in Figure 3 with the exception of a different battery, specifically a 6-‐cell 4000mAh 25C E-‐Flite Li-‐Po battery. From Table 1 and Table 2 we can see that the maximum average thrust delivered by the 18x8 propeller along with the 6 cell Li-‐Po battery and the combination of the OMA-‐5020-‐490 motor and the OCA-‐170HV ESC is approximately 11.39lbs of thrust and for the 18x8E propeller is 12.29lbs, which is a significant increase of 3.76lbs. Although, we have surpassed the maximum thrust provided by last year’s system, at the time there were still other propeller and motor combinations that I had not explored, which may or may have not lead to an even higher increase in thrust. The throttle position was increased by half increments and from Table 1 and 2 we can see that our maximum position was 1, which translates to the position before the limiter engages. Throttle position, power draw, and thrust are the most important data columns since they have a huge impact on the overall propulsion system. Each trial used a fully charge battery to ensure that the results were comparable. The following table shows the data collected for the 20x8E propeller. Meneses 22 Table 3 20x8E First Trial Data Motor O.S. Engine OMA-‐5020-‐490 Trial 1 Voltage (V) Position 25.04 -‐3 0 25.04 -‐2.5 24.99 Battery E-‐Flite 6s 4000mAh Current (A) Power (W) Propeller 20x8E Thrust (N) Thrust (lbs) Time (s) 0 0 0 0 0 0 0 0 10 -‐2 0.73 18.2427 6.5 1.461258126 20 24.86 -‐1.5 2.6 64.636 14.5 3.259729665 30 24.58 -‐1 7.04 173.0432 27.6 6.204726811 40 24.11 -‐0.5 13.31 320.9041 32.9 7.396214206 50 23.35 0 25.22 588.887 46.8 10.52105851 60 22.67 0.5 34.35 778.7145 53.9 12.117202 70 Limiter 1 Limiter Limiter Limiter Limiter 80 From Table 3 we can see that the limiter engages at the +.5 throttle position, which precedes the previous two propellers. At the point before engaging the limiter the thrust provided by the 20x8E propeller is measured to be 12.11lbs of thrust, which is less than what we obtained using the 18x8E propeller. Although manually recording data increases risk of discrepancies, it expedited the preliminary process of characterizing propellers. The following images will provide detail on the throttle position system in order to get a better understanding on how I recorded data. Figure 6 Dx6i Transmitter and Throttle Joystick Meneses 23 Figure 6 shows the controller (transmitter) used to drive the motor. The left joystick, which is the one that controls the throttle (shown by right image), has small hash marks on the interior left side that exemplify an x-‐y plane. By letting the center point be the origin, the throttle stick can range by 3 hash marks below and above the center point. I decided that it would be the simplest way to start collecting data and referencing the values to a throttle position. In R/C planes it is standard for the control signal to be a PWM signal, where the width of the PWM signal translates to a specific RPM with a given load. The Dx6i transmitter sends a 45Hz PWM signal that ranges from 1ms-‐ 2ms as shown in Figure7, where 1ms corresponds to the lowest throttle position and 2ms corresponds to the highest throttle position. Table 4 provides the width of the control signal measured at the receiver at different throttle positions. Figure 7 PWM Widths of Control Signal Meneses 24 Table 4 Width Range of Control Signal Throttle Position -‐3 -‐2 -‐1 0 1 2 3 PWM IN Rx (45Hz) 908 us 1.052ms 1.272ms 1.508ms 1.660ms 1.844ms 2.004ms Figure 8 4000mAh 30C E-‐Flite Li-‐Po Battery Figure 8 shows the 6-‐cell 4000mAh Li-‐Po battery that was initially purchased to initialize the propeller-‐ testing phase. This battery is capable of output 120 A of continuous current. The C-‐
value displayed on the top right corner of the battery, as seen in Figure 8 allows the user to calculate the maximum amount of continuous current the battery is capable of delivering. The C-‐
value (30) can be multiplied by the given amp-‐hours of a battery (4Ah) to find the maximum continuous current output of the battery (120A). The nominal voltage of the battery is 22.2V. This value is derived from the voltage the battery should produce at full charge under maximum electrical load. In reality, each cell of a Li-‐Po battery at full charge has a nominal value of 4.2V. For a 6-‐cell Li-‐Po battery this means that the battery at full charge should produce a voltage measurement of 25.2V under no load. Meneses 25 Design Alternatives There is no great way of analytically selecting a motor based on desired performance. The motor used in last year’s competition was selected based on its manufacture reputation and ability to exceed 1000 watts of power (Hojnacki). Richard describes his justification for selecting the motor weak and recommends finding an analytical reason for selecting one. However, due to the success of last year’s team, exploring other electric motor and electronic speed controller combinations were deemed unnecessary. In order to assist future teams in their process of finding superior motor, battery, and propeller combination, Richard left behind a motor calculator that was referred to him by local R/C experts. The calculator they referred him to was created by Christian Persson called Drive Calculator (ver 3.4). An image of the graphic user interface is displayed below: Figure 9 GUI of Drive Calculator Meneses 26 This calculator takes into account a wide variety of variables that influence the performance of an electric propulsion system. This tool is utilized to roughly estimate how a given setup may perform. Unfortunately I did not use the calculator to its full potential, since I already had a motor and speed controller selected. However, this program can be used to search through a variety of motor and propeller combinations to see what motors may be worth considering for future teams. From this calculator future teams should hope to find a number of motor and propeller combinations that will meet to competition restrictions (i.e. power utilized < 1000W) assuming they stay the same within the next two years. Once obtaining a list of motors that obey competition restrictions, the list can be reduced down to a couple of choices based on the thrust output since it is the most important variable when selecting a motor. Once selecting a motor it is important test the motor to verify that the calculator results hold valid. Through my online research I came across a different online calculator called Ecalc. Ecalc is a web based calculator that evaluates and helps design electric motor drive systems for R/C models. This means that this calculator is not only geared towards fixed wing aircrafts, but also quadcopters, and helicopters. However, unlike the Drive Calculator, Ecalc is a subscribed service that offers different packages that vary in price depending on what your needs are. For our case we only want the fixed wing (propCalc), which only costs $1.49/month, which is a reasonable price point seeing how they proclaim to be the most reliable RC calculator on the web. Component Selection The power limiter forces teams to carefully select a motor, battery, electronic speed controller and a propeller. Last year’s propulsion system used the combination of the O.S. OMA-‐
5020-‐490 motor and the OCA-‐170HV ESC shown in Figure 10, but because the OCA-‐170HV ESC did not have a battery eliminator circuit the team had integrate an external NiCad or NiMH battery pack into the circuit path to power the receiver and servos. This year the aircraft will be operating under Meneses 27 the combination of O.S. OMA-‐5020-‐490 motor and Castle Creations Talon 90 ESC shown in Figure 11, which has a built in battery eliminator circuit. Having an integrated BEC within the Talon 90 allows us to remove the excess weight provided by the addition of the NiCad or NiMH battery pack integrated in last year’s system. The Talon 90 ESC was selected because it is able to withstand the current draw of the system and also because it is recommended by Neumotors (power limiter manufacture) for use alongside the 2015 SAE Power Limiter. Figure 10 Last year’s Motor and ESC Combination Figure 11 This Year's Motor and ESC Combination Meneses 28 The SAE Rules state that a commercially available 6-‐cell 22.2V Lithium-‐Polymer battery, with a minimum battery requirement of 3000mAh @25C, must power all electronic components on board the aircraft. However, it is unclear as to which battery rating will provide the aircraft with sufficient energy to last a flight round. After watching footage from last years’ competition, it was determined that each flight round lasts between one to two minutes. With that in mind, it was important to find a battery that would provide the plane with enough energy to complete a three to four minute flight. A 4000mAh Li-‐Po battery was initially purchased to initialize the propeller-‐ testing phase. The test bed shown in Figure 3 was used to test different APC electric propellers. The overall goal was to determine which propeller would provide the aircraft with an optimal amount of thrust while maintaining a power level below the 1kW limit. The data obtained during each test included thrust, current, and voltage draw from the battery, thus power draw. Having thrust and power data for each APC electric propeller tested provided me with sufficient information to conclude the optimal propeller option for the competition. Table 5 shows all the propellers tested near max power. Table 5 Propeller Thrust Data Propeller Average Thrust (lbs) Average Power Draw (W) 17x12E 18x8 18x8E 18x10E 19x8 19x10 20x8E 20x10E 11.26 12.57 12.97 11.69 12.27 11.73 12.11 12.13 879 905 937 890 874 915 856 834 Meneses 29 The 18x8E propeller was chosen because it consistently provided the most thrust near max power. Figure 12 displays a sample of raw thrust and power data collected for the 18x8E propeller near max power, as well as its 5-‐point windowed average. Figure 12 18x8E raw and processed data After determining that the 18x8E propeller was the best option, the next goal was to determine whether or not there were other battery capacities that would provide the plane with sufficient energy to complete a three to four minute flight near max power. Finding the right battery played a pivotal role because excessive capacity adds unnecessary weight to the plane. Any ounce that is removed from the system is added to the payload the plane can carry. A 6-‐cell 3200mAh battery was purchased and after testing it alongside the 4000mAh, it was determined that they both have enough energy to enable the aircraft to complete a three to four minute run as seen in Figure 13. It was also discovered that the 3200mAh battery weighs 4oz less, enforced my decision to select Meneses 30 it for competition. The final electronic component selections for the propulsion system are presented in Table 6. Figure 13 3200mAh &4000mAh Battery Comparison Table 6 Final Electronic Selection Component Motor ESC Battery Brand O.S. Motors Castle Creations E-‐flite Model OMA-‐5020-‐490 Talon 90 3200mAh @30C Notice that instead of looking at how much thrust a propeller provides at full throttle, the focus was on how much thrust was provided near max power. This is due to the fact that all the propellers listed in Table 5 engaged the limiter, but at different throttle positions. It has been repeatedly stated throughout the SAE forums by officials that in order to prevent the limiter from engaging, teams should design their power systems so that it only utilizes power Meneses 31 below the limiter setting at full throttle. One can accomplish this by modifying the throttle travel adjustment setting within the transmitter so that even if the pilot ramps up the throttle joystick, the power being drawn from the battery will never exceed the 1kW threshold. This, by no means, is the best solution to avoiding tripping the limiter. The reason why this approach is not an adequate solution is because changing the throttle travel adjustment within the transmitter limits the control signal to a specific PWM width. The width you limit the control signal to may be the max width one can go up to before engaging the limiter with a fully charged battery, but as time elapses the voltage of the battery decreases. This decrease in voltage leads to a decrease in power and requires an increase in the control signal to compensate for the power loss, but since you’ve clamped the throttle signal to a specific width you won’t be able to compensate for the power loss, which renders this method of avoiding engaging the limiter not optimal. This year I have a designed an active control system that monitors and adjusts the power consumption of the propulsion system before the SAE power limiter gets the chance to do so. I have selected the Arduino Mega 2560 microcontroller to implement my control system. I chose this microcontroller for three main reasons: 1. Broad selection of compatible sensors 2. Simple Programmability 3. Ability to reproduce a signal to control the motor Meneses 32 Preliminary Proposed Design One of the biggest issues in last year’s propulsion system was the fact that it did not have a pre-‐
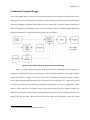
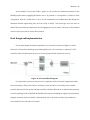
limiting device. A pre-‐limiting device would have been (and still is) useful by preventing the limiter from ever engaging. In Richard’s MER 498 report, he states that in order to avoid activating the limiter he planned on debriefing the pilot once at competition about his collected data and inform him about situations (i.e. throttle positions) that should be avoided. Figure 14 2015 Initial Electric Propulsion System Design Figure 14 shows the block diagram of the initial electric propulsion system design that I intended to implement for this year’s competition. The solid lines indicate a power signal and the dotted lines indicate a signal. In order to remove the probability of getting penalized I propose using a proportional-‐integral-‐derivative (P.I.D) controller shown in Figure 151 , which will be used to monitor our system’s overall power consumption and prevent it from ever going above 1000-‐
watts. A P.I.D controller is a feedback control loop that calculates an error signal by taking the difference between the output of the system, which in this case is the power being drawn from the battery, and the set point. The set point is the level at which we would like to have our system 1
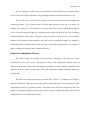
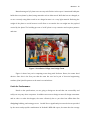
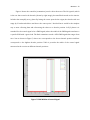
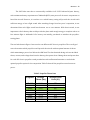
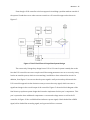
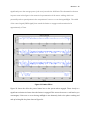
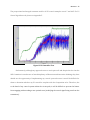
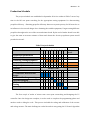
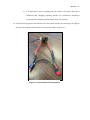
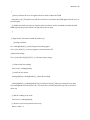
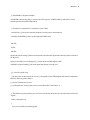
Image obtained from Wikipedia page of PID Controllers Meneses 33 running; ideally we would like our system to be running near max power (990W) without causing the limiter to engage. Figure 15 PID Control Block Diagram1 My initial P.I.D controller implementation was designed to only have two input signals, the first being the set point, which is predefine, and the second being the power draw of the battery. With these inputs the P.I.D controller would have then produced a correction signal and delivered it to the ESC, which would enable the propulsion system to consume power as close to the 1kW limit without ever going over. Alternative If my approach to implement a pre-‐limiting device is unsuccessful, my next step will be to implement a way for the pilot, from the ground, to realize that the limiter is close to engaging. There are a few ways one can do this. For example, one can take Richard’s approach and verbally tell the pilot, which throttle positions to avoid. I, on the other hand, plan to match the highest throttle position one can reach with a given propeller to a throttle signal percentage in the transmitter. The Dx6i controller has a travel adjustment function that allows the user to change maximum throttle signal sent by the transmitter. The Dx6i throttle signal ranges from -‐125%-‐125%, where the absolute 0 signal =-‐125%, half throttle signal= 0%, and full throttle signal=+125%. Meneses 34 As an example, if we look at Table 1 again, we can see that our maximum position for the 18x8E propeller before engaging the limiter was +1. If position +1 corresponds to a 100%, for sake of argument, then all I would have to do is use the transmitter travel adjustment and change the maximum throttle signal being sent out from 125% to 100%. This would get rid of the need to debrief the pilot and most importantly avoid engaging the power limiter. However, as determined earlier in this report, this is not the best solution. Final Design and Implementation For my final design I decided to implement a P.I controller as shown in Figure 16 rather than the P.I.D Controller initially proposed during fall term. A P.I controller is a subset of a P.I.D controller where the derivative the error is not used (proportional constant is set to 0). Figure 16 PI Control Block Diagram It is important to point out that due to the complexity of the electronic components within the circuit path (i.e. ESC, power limiter, and motor) I was not able to accurately create a model (transfer function) for the system. Having a model would have allowed me to simulate the system in a software package such as MATLAB & Simulink and assist me in finding the right proportional and integrals constants for the controller. Unfortunately, due to the lack of a model, the parameters were obtained via a trial and error format. Meneses 35 Even though a P.I.D controller is the best approach in tackling a problem without a model of the system I found there were other reasons to switch to a P.I controller approach as shown in Figure 17. Figure 17 2015 Final Electric Propulsion System Design The reason why I changed my design from a P.I.D to P.I control system is mainly due to the fact that P.I.D controllers are more complex and if the tuning parameters are no set correctly it may lead to an unstable system, which is not something I would like to have onboard the aircraft. In addition, from Figure 12 we can see that the power signal is really noise and a problem with the P.I.D controller approach is that derivative term processes the noisy signal, which can cause a significant change in the overall output of the controller. Figure 17 shows the block diagram of the final electric propulsion system design that I intend to implement for this year’s competition. This year’s system has three additional components: a current and voltage sensor as well as the P.I controller. In Figure 17 the a solid black line indicates a power signal, a black dashed line a PWM signal, a blue dashed line an analog signal, and a green solid line a constant. Meneses 36 Figure 18 P.I Control Algorithm Figure 18 shows a software level block diagram of the P.I control algorithm. The controller receives a current and voltage measurement, which it then uses to calculate the power being drained from the battery. Once the power is measured the error signal is calculated by taking the difference between the set point and the power measured. The error signal then goes into the P.I control loop where it gets multiplied by the proportional and integral constant. The output of the P.I control is a power value and in order to convert it to a quantity that is comparable to that of the control signal, it goes through a power to PWM signal converter. The adjusted PWM signal (output of PWM converter) then gets compared with the throttle signal, which is also a PWM signal that is being sent by pilot, the least of the two gets sent to the controlled system. The controlled system block encompasses the battery, motor, speed controller, and limiter. It is important to state that the P.I controller indirectly controls the power being utilized by the system by directly modifying the PWM control signal. The P.I Control algorithm will be implemented the Arduino Mega 2560 microcontroller shown in Figure 19. Meneses 37 Figure 19 Arduino Mega 2560 The Arduino Mega 2560 microcontroller has an analog-‐to-‐digital converter that reads voltages and converts it to a number between 0 and 1023, so there was no need to buy an external voltage sensor. The only issue is that Arduino analog input can only be used to measure DC voltage between 0-‐5V The range over which an Arduino can measure voltage can be increased by using two resistors can creating a voltage divider. For information on the design of voltage divider used in this circuit along with a sample code please see Appendix D. For measuring current I selected a 50A current sensor (AC/DC) manufactured by DFRobot shown in Figure 20. I selected this sensor because it measures current within the range that the current gets drawn from the battery. Near max power the motor utilizes between 38-‐45A. In addition, as one of its biggest features it is compatible with the Arduino interface. For current sensor sample code see Appendix E. Meneses 38 Figure 20 DF Robot 50A Current Sensor Performance Estimates and Results All of the data presented in this section was obtained using the selected 18x8 propeller and the final electric component listed in Table 6. Prior to testing the P.I controller at the desired set point (925W-‐950W), as a preliminary test, I let the set point be 500W to determine how well it performs under limits below its intended application. Figure 21 500W Set Point Test Meneses 39 Figure 21 shows the power data collected over a 50 second interval with the integration of the P.I controller at a 500W set point. We can see that the average power (red curve) being utilized by the system levels at around 500W, which is what I expected. However, you cannot see how increasing the throttle signal to its max did not cause the power consumption to exceed the set point significantly how one would have expected with just the used of the power limiter. Unfortunately at the time this data was being recorded, I neglected to record the change in the width of the throttle signal. I think showing the direct relationship between the power consumption and the control signal would have made the figure above more meaningful. In order to get a better visual understanding of the functionality of the P.I Controller the following figures will provide detail about the throttle signal as well. Figure 22 SAE Power Limiter Test Figure 22 shows the power and throttle data collected over a 40 second interval without the integration of the P.I controller. We can see that the power being utilized by the system drops Meneses 40 significantly once the average power (red curve) exceeds the 1kW limit. The substantial reduction in power seen in this figure is the numerical representation of the motor stalling, which can potentially end our participation in the competition if it were to occur during midflight. The width of the control signal (PWM signal) that caused the limiter to engage was determined to be approximately 1.73ms. Figure 23 Limiter Effect Figure 23 shows the effect the power limiter has on the system when engaged. There clearly is a significant reduction in thrust when the limiter is engaged. This causes the motor to stall and as you can imagine, if this were to occur during midflight it can ultimately lead to the plane crashing and end up looking like the plane show in Figure 24. Meneses 41 Figure 24 Crashed P1 Murcielago Figure 24 shows the result of attempting to fly our first prototype. It is important to point out this was the result of a 5-‐10ft fall. One can only image how drastic the impact and effect will be if the plane were to hit the ground from a height of 100ft. Figure 25 shows the power and throttle data collected over a 45 second interval with the integration of the P.I controller at a 950W set point. We can see that the average power (red curve) being utilized by the system never exceeds the 1kW limit regardless of what the control signal input is. In the SAE Limiter Test figure we saw that the limiter engaged at a throttle signal width of approximately 1.73ms, but in this figure the throttle signal width exceeds the 1.73ms "max" control signal without causing any reductions in power consumption. The average power utilized during this test run while the throttle was fully engaged was about 915W, which is not the 950W that I expected, but I suspect that this discrepancy can be fixed with the proper Ki and Kp (integral and proportional constants) values. I think that having a model of the system would have improved my understanding of the overall system, which would have potentially lead me to find the proper Ki and Kp values to improve the performance of the P.I controller. Meneses 42 The proportional and integral constants used for all P.I control examples were 0.7 and 0.05. For P.I Control algorithm code please see Appendix F. Figure 25 PI Controller Test Unfortunately, although my approach seems to work quit well and despite the fact that the SAE Committee is an advocate of interdisciplinary collaboration and innovative thinking, they have denied me the opportunity of implementing my control system because it would be difficult for them to determine whether my P.I controller complies with the Competition rules. Therefore, due to the band of my control system within the circuit path, it will be difficult to prevent the limiter from engaging without taking a non-‐optimal route (modifying the control signal being sent from the transmitter). Meneses 43 Production Schedule The project schedule was established in September 2014. As evident in Table 7 most of my time in the fall was spent searching for the appropriate testing equipment for characterizing propeller efficiency. Obtaining propeller efficiency data was my main priority for fall term due to its influence in the aircraft design. Once obtaining the suitable equipment, I began testing different propellers throughout the rest of the term and winter break. By the end of winder break I was able to give the team an accurate estimate of how much thrust the electric propulsion system would provide the aircraft. Table 7 Project Schedule Timeline
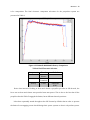
Week Propulsion Optimization -‐ Research -‐Gathering Testing Equipment -‐Prop and Motor Testing -‐Prop Analysis Timeline Week -‐P.I Controller Research and Design -‐ P.I Controller Programming -‐System Debugging -‐P.I Controller Installation and Testing -‐Final Report Fall Term
1 2 3 4 5 6 7 8 9 10 Winter
break
Winter Term
1 2 3 4 5 6 7 8 9 10 The first couple of weeks of winter term were spent researching and designing the P.I controller. Once the design was complete, it took a week to complete the programming phase and another week to debug the code. This process included the coding and calibration of the current and voltage sensors. The main challenge in weeks five and six was getting the P.I Control algorithm Meneses 44 and sensors to function properly. The last few weeks of winter term were spent testing the P.I Control system and trying to find the proper Kp and Ki constants for a set point as close to the 1kW limit. Cost Analysis Item Table 8 Component Cost Quantity Cost/Item($) E-‐Flite 6s 22.2V 4000mAh Li-‐Po battery E-‐Flite 6s 22.2V 3200mAh Li-‐Po battery 1kW SAE Power Limiter DF Robot 50A Current Sensor Ardunio Mega O.S Motor OMA-‐5020-‐490 Castle Creations Talon 90 ESC Total Cost 1 $134.99 Total Price($) $134.99 1 $99.99 $99.99 2 1 1 1 1 $50.00 $14.55 $36.67 $94.00 89.95 $100.00 $14.55 $36.67 $94.00 $89.95 $570.15 Table 8 shows the cost of each component that was used through the completion of this project. It is important to point out that not all of these components were purchased. For example, last year’s team left behind the O.S Motor and Talon 90ESC. In addition, the Arduino Mega 2560 was obtained from the ECE department’s inventory of microcontrollers. The actual amount that was spent on components was $349.53, which is below the $490.00 budget I was granted at the beginning of winter term. However, since I pushed the motor to the limits of its capabilities, meaning that I stressed it during testing to the point of damaging it. Having a rigorous testing method means running the risk of permanently damaging the motor and for competition it is vital to use an undamaged motor, which is why a new motor will be purchased prior to the Competition. The purchase of a new motor will lead to an amount of $443.53 spent, which will still be below the Meneses 45 budget. This table is meant to provide someone who has an interest in taking upon a project similar to mine with an idea as to how much it would cost them pursue and complete the project. User’s Manual Please follow the instructions below for installing the P.I controller into the power system of the plane and setting set point and tuning parameters. 1. Make a connection from one of the ground pins of the Arduino to one of the buses in the breadboard using a jump wire 2. Connect the current sensor in Figure 20 between the Li-‐Po battery and the power limiter a. Attach blue, black, and red Analog Sensor Cables to the sensor b. Connect the black wire to a pin in the breadboard that is in the grounded bus c.
Connect the red wire to the 3.3V pin in the Arduino d. Connect the blue wire to the A7 pin in the Arduino 3. Build the voltage divider seen in Appendix D in the breadboard a. Connect a jump wire at beginning of the voltage divider i. Clamp the other end of the wire with an alligator clip ii. Clamp the other alligator clip to the exposed section of the red 12 gauge wire of the current sensor seen in Figure 26 b. Connect a jump wire at the end of the voltage divider i. Repeat the same steps as before, but this time clamp the alligator clip to the exposed section of the black wire of the exposed section ii. Make a connection from the A0 pin of the Arduino to the row where both of the resistors in the voltage divider meet 4. At this point you have your current and voltage sensors wired Meneses 46 5. Get a set of analog wires that has solid tips at one end and a female adapter at the other as shown in Figure 27 i. Connect the female end to the throttle pins in the receiver ii. Connect the black solid tip end to a pin within the grounded bus iii. Connect the white solid tip end to pin 5 of the Arduino iv. Connect the red solid tip end to any empty row close to the grounded bus 6. Get three jumping wires i. Use one wire to make a connection between a pin in the ground bus to the brown wire terminal in the analog female end of the power limiter ii. Use one wire to make a connection from pin 9 of the Arduino to the yellow wire terminal in the analog female end of the power limiter iii. Use one wire to make a connection from the 5V pin of the Arduino to the red wire terminal in the analog female end of the power limiter. 7. At this point the P.I Controller has been successfully been integrated into the power system of the plane. 8. Connect the Arduino to a Computer using a USB cable type A/B a. Open the Arduino Software b. Open the P.I Control Code 9. Once the algorithm is opened and displayed by the Arduino Software the user may do the following: i. Change the set point by changing the numerical value of the variable ii. Change the tuning parameters (proportional and integral) by changing the numerical value of Kp and Ki Meneses 47 iii. It is important to keep everything else the same as the sensors have been calibrated and changing anything besides the parameters mentioned previously may change the performance of the P.I Controller 10. To upload the program to the Arduino select the button with the arrow facing to the right at the top of the Arduino Sketch and the P.I Controller will be ready to use Figure 26 Current Sensor Wire Exposures Meneses 48 Figure 27 Analog Wire With Female and Solid Tips Note: Make sure to use shrink-‐wrap to cover any soldered connections, as this will help reduce the probability of shorting the circuit. Meneses 49 Conclusion This year, as the propulsion engineer, I was tasked with integrating new regulations by the SAE Committee. The SAE Committee for the 2014-‐2015 competition mandated the integration of a new 2015 power limiter and battery. In order to update the propulsion system from last year, I tested different propellers to find which one would maximize the thrust provided to the aircraft. Through my analysis, I determined by implementing an 18x8E propeller the propulsion system upon take off, when the thrust is most important would be able to provide the aircraft between 12.5-‐ 13 lbs of thrust at near max power; nearly a 4lbs increase in thrust compared to last year. In addition, last year’s propulsion engineer conservatively designed the propulsion system so that it would never exceed the 1kw limit. Although conservative, this design did not allow the aircraft to carry its maximum designed takeoff weight. By implementing a P.I controller I was able to monitor and adjusts the power utilized by the propulsion system and therefore enable the aircraft to achieve the max designed takeoff weight. Through the aforementioned designed specification, I have provided the Union College SAE Aero Design Team with a highly competitive propulsion system. Recommendations Through the course of this project I have been able to reflect on some of the things that assisted me in going forward with my endeavors and other things that I would have done differently. Most of the things listed saved me time and prevented me frustrations and about all of these things may appear to be trivial, but they are easy to forget about. For that reason I would like to list these things and recommend my successor to imitate a similar practice. Meneses 50 1. Keep detailed notes, daily journals, and an organized file system. This will make everything you’ve done worth your time by requiring no effort in reporting your progress or/and conclusions. 2. Create a strict testing procedure and stay with it. This will make the results you obtain easily comparable. 3. Analyze data upon collecting it. This will save you time in writing reports and creating presentations. Furthermore, you won’t know why the data is relevant or what exactly it represents. 4. Test frequently. You can never have too much data for a given experiment. I found, in multiple occasions that the data I measured the first time differed from the second or third time. 5. Explore Online Calculators. I didn’t utilize these online calculators because I already had a motor and speed controller selected, but if rules or regulations change, I highly suggest investing time in figuring out how utilize the online calculators mentioned in this report. Future Work There are many avenues to be explored, which could potentially lead to improvements in the overall propulsion system. My first suggestion would be to find a method of modeling the propulsion system. There is no better way of selecting PI controller constants that through modeling the system in a software package and determining how it behaves given certain parameters. I thought my justification and method for selecting proportional and integral constants was inefficient. Therefore if my successor can find a way of modeling the system, then he/she will have already made significant progress. After a thorough examination of the different combinations (i.e. propellers, motors, and etc.) it is hard to say whether more than 13lbs was feasible. However, I am confident that my successor Meneses 51 will come closer in finding a better component combination by building upon the work and information I have put forth. Finally, since this is the first time The Union College Aero Design Team has ever had a pair of electrical engineering students I would like my successor to be an electrical engineering student as well to keep the continuity. I believe having engineering students from different disciplines will enhance the teams overall aircraft design approach and improve the team’s performance in future competitions. Meneses 52 Acknowledgements •
•
•
•
•
•
•
Professor Spinelli Professor Hedrick Professor Dosiek Gene Davison Stan Gorski Lisa Galeo The 2014 Union College Aero Design Team Meneses 53 References 1. BBMAC. A Brief Histroy RC Model Aircraft. n.d. 14 November 2015. <bbmac.net/misc/histroy.htm>. 2. Boddington, David. Radio-‐Controlled Model Aircraft. CrowoodPress, n.d. 3. Hojnacki, Richard. Electric Propulsion System & Test Bed Design. Senior Capstone. Union College. Schenectady, 2014. 4. Imrie, Alex. Howard Boys-‐ An apprecaition. 1984. 5. Lienhard, John h. Engines of Our Ingenuity. n.d. 12 November 2015. <http://www.uh.edu/engines/epi1129.htm>. 6. Max Amps. n.d. 15 March 2015. 7. O.S. Engines. O.S . Motors. n.d. September 2014. <http://www.osengines.com/motors/motors/motor-‐dimensions.pdf>. 8. SAE Aero Design Rules. "2015 SAE Aero Design East and West Section 4." 1 September 2014. sae.org. 15 September 2014. <http://students.sae.org/cds/aerodesign/rules/2015_aero_rules.pdf>. Meneses 54 Appendix A: Charging Battery Procedure 1. Make sure the battery is in the fireproof container/bag. 2. Before plugging in the EZ Peak Plus charger. a. Connect the multicolored connectors from the battery to the appropriate spot on the balance adapter board (You’ll know you’re correct because it only fits on way). i.
4s batteries to the 4s slot, 6s batteries to the 6s slot, etc. b. Connect the power cable dean’s connectors (from battery) to the dean’s connectors on the charger. 3. Plug in the AC power cord for the EZ Peak Plus charger to the closest outlet. 4. Use the “STOP/BATTERY TYPE” key to select the “PROGRAM SELECT LiPo BATT” category. 5. Press “ENTER/START” to advance to the “LiPo CHARGE” screen. 6. Use the “STATUS/+/-‐” key to scroll to the “LiPo BALANCE” screen and press “ENTER/START.” The amp rate value will flash on and off. 7. Use the “STATUS/+/-‐” key to scroll the amp rate up or down to the desired rate. To find desired rate take the capacity of the battery divided by 1000. mAh/1000 = amp rate 8. Press the “ENTER/START” key again. Battery voltage will flash 9. Use the “STATUS/+/-‐” key to adjust the voltage up or down to match the voltage and cell count indicated on the battery. 10. Press and hold the “ENTER/START” key. Charge will chime and display “BATTERY CHECK WAIT...” 11. Next the display will show “R: #SER S: #SER” to indicate the number of cells the charger detected (R) and the number you selected (S). If these values do not match press “STOP”DO NOT start charging if values do not match. 12. If these values match press “ENTER/START” 13. As the pack charges the display will show the battery type, cell count, charge rate, pack voltage, charge time, and amount of milliamps the pack is receiving. 14. When completed it will display “FULL” 15. To stop charging press “STOP” Note:For further questions refer to the EZ Peak Plus owner’s manual. Please check images below if you’re still confused with how wires should be connected. Meneses 55 Appendix B: Testing Propeller Procedure 1. Find a large, open, and empty room for testing. 2. Move the test bed to a safe location in the room so that people are not likely to walk by the spinning propellers. 3. Place a 10lb weight flush up against the back rail of the test bed. 4. Mount the motor to the front of the test bed and tighten. 5. Attach the propeller to the front of the motor. 6. Double checks that the bolt holding the propeller on the motor is in fact secure. 7. Attach the leads of the motor to the electronic speed controller (ESC). 8. Connect the dean’s power leads from the power limiter to the dean’s power leads on the ESC. i) If the ESC does not have deans connected already. Solder dean’s connectors to the power leads. 9. Connect to the “Programmer” labeled wires of the ESC to any open connection on the receiver. 10. Use the not labeled signal connection from the ESC to connect to the power limiter. Ensure that the blue wire from the power limiter connects to the white wire from the ESC. 11. Connect the remaining signal connection from the power limiter to the throttle input pins on the receiver. 12. Tape the microchip of the limiter to the top rail of the test bed so that one can observe the LED lights illuminating 13. Connect the wattmeter to the dean’s connectors of the power limiter. If no dean’s connectors attached, solder then on the meter’s leads. 14. Make sure you are standing behind and clear of the motor at all times. DO NOT stand to the sides of the spinning propellers and wear goggles. 15. Place battery in in fire proof bag and have it standing with a mass to help it stay in place (see images below for references) 16. Place the Hull Effect sensor on a flat service where it won’t be moved by anything 17. Clamp the red wire leaving the battery with the Hull Effect sensor. Make sure arrow on sensor leads you away from battery. 18. Connect custom dean female/male wire to watt meter (see first image below) 19. Use a BNC to alligator cable to record the voltage drop across the battery. 20. Connect the red and black alligator clips to the stripped custom dean female/male wire (black to black and red to red) 21. Connect Hull Effect sensor to channel 1 and BNC connection to channel 2 of oscilloscope 22. Insert the CompactFlash 4GB memory into the slot on the oscilloscope 23. Turn on the oscilloscope and allow time for it to load the memory card 24. Turn on the Hull Effect sensor and zero the device using the rotating knob on the sensor 25. Attach dean’s connections from the battery to the custom dean female/male connector. i) If no dean’s connectors, solder them in place. ii) The wattmeter will light up, indicating the battery voltage, current, and power. 26. The watt meter should light up display the battery’s voltage and current 27. Turn on the Xplorer Pasco (see Thrust data collection procedure for help on how to use Xplorer Pasco) 28. Before activating the transmitter, make sure throttle (left stick) is at zero (all the way down). 29. Double check all connections (make sure nothing is getting shorted) Meneses 56 30. Power on the transmitter. You should hear a series of beeps and the motor will stall a little bit. i) If you see a strobe orange light on the receiver, then the transmitter is not bound. Refer to “Binding Procedure” for more information. 31. You are now able to run the motor with the transmitter and begin a testing procedure. 32. Gradually ramp up to full throttle then back down. During this process check that that the Xplorer is recording measurements and that a current signal is being read on channel 1 of the oscilloscope. 33. Zero the load cell of the Xplorer using the button at the top of the cell Figure 28 Custom Female/ Male Dean's Connector The Custom Female/male dean connectors shown in Figure 26 should go between the battery and the wattmeter. Figure 29 BNC Alligator Connector
Meneses 57 The BNC Alligator connector shown in Figure 27 is needed to record the voltage across the battery. Figure 30 Fireproof Battery Bag
In this image you see the battery inside the fireproof bag being held in place by a mass. In addition, you also see the Hull Effect sensor clamping the red wire leaving the battery and the alligator clamps on the custom deans female/male wire. Figure 31 Hall Effect Sensor Set Up
Meneses 58 The Hall Effect sensor must be placed on a flat service where it won’t be moved by the air being pushed back by the propeller. Figure 32 Watt Meter and Power Limiter
The wattmeter and power limiter should be taped on the top rail of test bed in order to be able to observe the limiters’ LED and the current, and voltage draw of the battery. Meneses 59 Appendix C: Thrust Data Collection Procedure 1. See notes at end. 2. Connect the Dual Load Cell Amplifier to the top of the GLX (position 1 or 2 it doesn’t matter). For argument sake select position 1 3. Turn on Xplorer GLX Pasco. You should see a green light turn on near the “Play” 4. The screen should now show two force readings (only one should be giving a numerical value since there is only one sensor connected) 5. Press the Home button, which will take you to a menu with 16 options 6. Select the Sensors option 7. Program the sensor (i.e. what sample rate unit you want!). Suggest using samples/s at 10 sample rate 8. Make sure Smooth averaging is off, Force 1 is visible and Force 2 isn’t 9. Press Home Button again 10. Select the Table option 11. There should be two columns one labeled “Time (s)” and the other Force 1 (N) (Newton’s can be changed to lbf). If you don’t see this you can manually add them by pressing the button with the “check” logo on the GLX and highlighting the title cell of the column. After highlighting the title cell, press the “check” button again and a drop down menu will appear that shows what value can be recorded in that column. Order of Force and Time columns don’t matter. 12. Once you have both a Time and Force Column press the “Play” button to being recording data 13. To stop recording data press the “Play” button again 14. To record a new set of data press the “Play” button again and it will erase the current data on the table and collect a new set (Run# will change) 15. To extract the data connect a USB drive to the right side of the GLX (while still on the table interface) 16. Press F4 on the GLX (drop down menu should appear) 17. Select “Export All Data” (i) If it does not connect to the USB, try again. 18.You should now see a different screen where you given the name and format of the file (name can be change if desired) 19.Both Force and Time should show Export on their drop down menu 20.Once ready to export press F1 (ok) 21.A Loading status bar should appear and once completed a success message will appear 22.Disconnect USB and plug into PC 23.The file extracted from the GLX should be a .txt file. Open it and save it as a .csv file in order to be able to open it with excel (from here one can copy and paste the columns to variables in MATLAB) 24.When turning off the GLX make sure to save your data! Note: Make sure to calibrate the stress sensor before collecting data. Easiest way would be using a pulley system with a known mass. Calibrating the sensor will increase the validity of your measurements. After calibrating the sensor and completing steps 1-‐7 you are now ready to start Meneses 60 collecting data. Finally, make sure GLX is always connected to charger as it only holds a charger for a short period of time. Figure 3 3 Screen After Selecting Home Button Figure 34 Top View of GLX Load Cell
Meneses 61 Appendix D: Voltage Divider Design and Test Code Figure 35 Voltage Divider Calculations Figure 33 shows the voltage divider calculations made in order to step down the 25.2V going into the Arduino microcontroller. Since the Arduino analog input can only be used to measure DC voltage between 0-‐5V. The range over which the Arduino can measure voltage was increased by using two resistors and creating a voltage divider as seen in the figure. The resistor values used for the voltage diver were 10𝑘Ω and 50𝑘Ω. The following lines of code were used to test the voltage divider and verify that it measured the battery voltage accurately. // R1 = 50k // R2 = 10k float val = 0; // Holds voltage read float vout = 0; float vin = 0; float R1 = 56000; float R2 = 10000; void setup() { Serial.begin(9600); Meneses 62 } void loop() { val = analogRead(A0); //read voltage analog signal vout = (val/1023)*5;// Convert the analog reading (which goes from 0 -‐ 1023) to a voltage (0 -‐ 5V): vin = ((vout*(R1+R2))/R2)*.97; Serial.print("Voltage Out:\t"); Serial.print(vout); Serial.println("V"); Serial.print("Voltage In:\t"); Serial.print(vin); Serial.println("V"); Serial.println(); delay(500); } Meneses 63 Appendix E: Current Sensor Test Code /* 50A Current Sensor(AC/DC)(SKU:SEN0098) Sample Code This code shows you how to get raw datas from the sensor through Arduino and convert the raw datas to the value of the current according to the datasheet; Smoothing algorithm (http://www.arduino.cc/en/Tutorial/Smoothing) is used to make the outputting current value more reliable; Created 27 December 2011 By Barry Machine www.dfrobot.com Version:0.2 */ const int numReadings = 10; float readings[numReadings]; // the readings from the analog input int index = 0; // the index of the current reading float total = 0; // the running total float average = 0; // the average float currentValue = 0; void setup() { Serial.begin(57600);// Make sure baud is equalk to this number for (int thisReading = 0; thisReading < numReadings; thisReading++) readings[thisReading] = 0; } void loop() { Meneses 64 total= total -‐ readings[index]; readings[index] = analogRead(A7); //Raw data reading readings[index] = (readings[index]-‐510)*5/1024/0.04-‐0.04;//Data processing:510-‐raw data from analogRead when the input is 0; 5-‐5v; the first 0.04-‐0.04V/A(sensitivity); the second 0.04-‐
offset val; total= total + readings[index]; index = index + 1; if (index >= numReadings) index = 0; average = (total/numReadings); //Smoothing algorithm (http://www.arduino.cc/en/Tutorial/Smoothing) currentValue= average-‐.37; Serial.print("Current:\t"); Serial.println(currentValue); Serial.println("A"); Serial.println(); delay(500); } Meneses 65 Appendix F: P.I Control Code //Code modifies PWM signal sent to speed controller based on power measurements #include <Servo.h> // Includes servo.h file from arduino library /******************************/ // Initializes variables //Define Variables we'll be connecting to PID int Setpoint=950; //Enter Desired Set point float Pm, Output; float Error, ITerm,DErr,LastPm,LastAdj; Servo myservo;// creates a servo pin int throttle; // creates throttle variable float signal=0;//Signal sent to ESC float stampthro=0; // Will keep track the throttle signal the receiver float deltathro;// change in throttle variable //Define Tuning Parameters int Kp=.7, Ki=0.05, Kd=0;// These Parameters work and have been tested with set point 500W, 600W, and 950W /* The Current Sensor uses a smoothing algorithm to make the read current value more reliable. Reads repeatedly from an analog input, calculating a running average and printing it to the computer. Keeps 10 readings in an array and continually averages them. Define the number of samples to keep track of. The higher the number, the more the readings will be smoothed, but the slower the output will respond to the input. Using a constant rather than a normal variable let use this value to determine the size of the readings array. */ Meneses 66 //Current sensor variables const int numReadings = 10; float readings[numReadings]; // the readings from the analog input int index = 0; // the index of the current reading float total = 0; // the running total float average = 0; // the average float Im = 0; //Initial current value measured //voltage sensor variables float val = 0; // variable that stores analog value of voltage sensor float vout = 0; float Vm = 0; float R1 = 56000; //R1 resistor value float R2 = 10000;//R2 resistor value float deltaPWM=0; /******************************/ //Start setup void setup(){ // initialize serial communication with computer: Serial.begin(57600);// Make sure baud is equal to this number //initialize the variables we're linked to LastPm=0; // Last power measurement used in the derivative term LastAdj=0;// Last value that we changed the PWM width by // initialize all the readings to 0: Meneses 67 for (int thisReading = 0; thisReading < numReadings; thisReading++) readings[thisReading] = 0; // set pin 9 as motor pin myservo.attach(9); //sets pin 5 as the signal receiving pin pinMode(5, INPUT); } /******************************/ //Start loop void loop() { //voltage variables val = analogRead(A0); //read voltage from analog signal vout = (val/1024)*5;// converts signal to value between 0-‐5V //Measured voltage Vm = ((vout*(R1+R2))/R2)*.973; // Calculates input voltage //Current Variables // subtract the last reading: total= total -‐ readings[index]; // read from the sensor: readings[index] = analogRead(A7); //Raw data reading readings[index] = (readings[index]-‐510)*5/1024/0.04-‐0.04;//Data processing:510-‐raw data from analogRead when the input is 0; 5-‐5v; the first 0.04-‐0.04V/A(sensitivity); the second 0.04-‐
offset val; // add the reading to the total: Meneses 68 total= total + readings[index]; // advance to the next position in the array: index = index + 1; // if we're at the end of the array... if (index >= numReadings) // ...wrap around to the beginning: {index = 0;} // calculate the average: average = (total/numReadings); //Smoothing algorithm (http://www.arduino.cc/en/Tutorial/Smoothing) Im= average; Pm=Im*Vm; // Measured power throttle = pulseIn(5, HIGH,25000); // ( Reads width of PWM signal going into pin 5 from Receiver) //Computer error variable for Output Calculation Error=Setpoint-‐Pm;//Error myservo.writeMicroseconds(throttle); // Conditional statements to determine whether or not PID controller should engage if (Error>0)// Meaning that the power measurement input is below our set point // then we just let the PWM signal from the receiver go through to the ESC { myservo.writeMicroseconds(throttle); } if(Error<0) // if the power measurement input is greater than the set point then we want to PID to take action Meneses 69 { //Once you know the error is negative then we need to adjust the PWM while(Error<0)// The while loop will check the Error and reduce the PWM signal until the error is positive again // Within this while loop there is another while loop that is used to maintain/send the adjusted PWM signal at the point at which it is right below the set point { // Begin Power calculation within the while loop //voltage variables val = analogRead(A0); //read voltage from analog signal vout = (val/1024)*5;// converts signal to value between 0-‐5V //Measured voltage Vm = ((vout*(R1+R2))/R2)*.973; // Calculates input voltage // subtract the last reading: total= total -‐ readings[index]; // read from the sensor: readings[index] = analogRead(A7); //Raw data reading readings[index] = (readings[index]-‐510)*5/1024/0.04-‐0.04;//Data processing:510-‐raw data from analogRead when the input is 0; 5-‐5v; the first 0.04-‐0.04V/A(sensitivity); the second 0.04-‐
offset val; // add the reading to the total: total= total + readings[index]; // advance to the next position in the array: index = index + 1; Meneses 70 // if we're at the end of the array... if (index >= numReadings) // ...wrap around to the beginning: {index = 0;} // calculate the average: average = (total/numReadings); //Smoothing algorithm (http://www.arduino.cc/en/Tutorial/Smoothing) Im= average; Pm=Im*Vm; //measured power throttle = pulseIn(5, HIGH,25000); // ( Reads width of PWM signal going into pin 5 from Receiver) Error = Setpoint-‐Pm;// Checks on setpoint everytime there is reiteration // PID Calculations ITerm+=(Error*Ki); // Term due to integral DErr=-‐(Pm-‐LastPm);// Term due to derivative Output= Kp*Error +ITerm +Kd*DErr; if (Output<-‐90){ Output=-‐90;} // limits our output to the maximum amount of error we anticipate before engaging the SAE Power Limiter //else if (Output>0){Output=0;} // Convert output to a value to a width in PWM which we should reduce the current PWM // we know that a 1% increase in throttle corresponds to a PWM width increase of .004ms // From the current, Voltage, and power data collected in the fall term I found that a .5 increase in the throttle position caused an increase of about 160W when near the //engaging point of the SAE power limiter // .5 increase in throttle position translates to a .08ms (80us) increase in PWM width Meneses 71 // deltaPWM is a negative number deltaPWM= Output*80/160;// converts the PID output to a PWM width by which the current throttle position should be adjusted by // Varaibles to remember for each time loop is called LastPm=Pm; //Last power measured equals current power measurement LastAdj+=deltaPWM;//Sums up the adjusted PWM values Kd=Kd; Ki=Ki; Kd=Kd; signal=throttle+LastAdj;//difference between actual throttle signal and value by which it needs to be adjusted myservo.writeMicroseconds(signal); // Sends adjusted PWM signal to ESC stampthro=signal-‐LastAdj;// throttle signal that keeps a steady level }// close first while loop //At this point we know that the error>0 , the signal is some PWM signal and that the stampthro= throttle, which is greater than 0 }// end of if statement error<0 // at this point we can keep the power around 500w,but I cant reduce it // This while loop keeps keeps you at a level near the Set point until you throttle down below the "signal" while ( stampthro>0) { myservo.writeMicroseconds(signal); Meneses 72 throttle = pulseIn(5, HIGH,25000); if (throttle<=signal) {break;} } // clear variables stampthro=0; signal=0; LastAdj=0; }// close void loop Meneses 73 Appendix G: MATLAB® Code The MATLAB plots shown in this report were obtained using a set of variables that contain data collected from the .txt and. csv files obtained from both the oscilloscope and the GLX Pasco Xplorer for each individual propeller test. The way variable sets are named is simple and it goes as follows: propeller size-‐trial #-‐length of trial-‐ amp rating of battery-‐ esc brand PlotVariables is a MATLAB script that will generate a subplot with 4 graphs: Voltage, Current, Power, and Thrust. When running the script MATLAB will prompt you with what variable set you want use. For example: 18x8-‐1-‐4min-‐4000-‐castle.mat This will load the variables for the 1st 4min trial of the 18x8 prop using the 4000mAh battery and the Castle Creations ESC. If you wanted to see the graphs for the data of the same prop, trial, length, but different battery and different ESC then the following changes would be made: 18x8-‐1-‐4min-‐3200-‐os.mat This will load the variables for 1st 4min trial of the 18x8 prop using the 3200mAh battery and the OS Motors ESC. The PlotVariables MATLAB script is shown below: clear clc %Load appropriate set of variables: propsize,trial,period,battery-‐ESC brand %based on user input prop=input('Enter Prop name ( i.e 18x8 or 18x8E): ','s'); trial=input('Enter trial number: ','s'); tleng=input('Enter duration of test in minutes (i.e 4min): ','s'); bat=input('Enter battery mAh rating: ','s'); esc=input('Enter manufacture name of ESC (i.e os or caslte): ','s'); das='-‐'; sp=' '; ty='.mat'; filename=strcat(prop,das,trial,das,tleng,das,bat,das,esc,ty); load (filename) relabel=strcat('Subplots of ',prop,das,'prop',das,bat,das,esc,das,'Trial',das,trial); %After loading variables make sure to change title of plots P = I.*V; % Calculates power %% 5 point windowed average smI=smooth(I'); smP=smooth(P); Meneses 74 smV=smooth(V); smF=smooth(F); %% %% %Voltage Plot subplot(4,1,1); plot(t, V,'b',t,smV,'r') legend 'exp' 'smooth' title(relabel) % title('Subplots of 18x8 prop 4000mAh OS Arduino Trial 2'); xlabel('Time (s)'); ylabel('Voltage (V)'); %% %Current Plot subplot(4,1,2); plot(t, I,'b',t,smI,'r'); xlabel('Time (s)'); ylabel('Current (A)'); %% %Power Plot subplot(4,1,3); sz=size(P); limit=1000*ones(sz,1);%Line that helps visualize 1kW limit plot(t, P,'b',t,limit,'g',t,smP,'r'); xlabel('Time (s)'); ylabel('Power (W)'); %% %Thurst Plot subplot(4,1,4); plot(Ftime, F,'b',Ftime,smF,'r'); xlabel('Time (s)'); ylabel('Thrust (lbf)');