1
TM
Cyto Pulse Sciences, Inc.
Model PA-4000
Four Parameter PulseAgile ®
Electroporation System
User Manual
Cyto Pulse Sciences, Inc.
P. O. Box 609
Columbia, MD 21045
1-410-787-1890
1-410-787-1891 FAX
www.cytopulse.com
Cyto Pulse Sciences, Inc. makes no warranty with respect to the product except for the warranty set forth
in this Users Manual on page 7-1. The LIMITED WARRANTY SET FORTH ON PAGE 7-1 IS
EXCLUSIVE AND NO OTHER WARRANTY, WHETHER WRITTEN OR ORAL, IS EXPRESSED OR
IMPLIED. Cyto Pulse Sciences, Inc. SPECIFICALLY DISCLAIMS IMPLIED WARRANTIES OF
MERCHANTABILITY AND FITNESS FOR A PARTICULAR PURPOSE.
License Agreement
PA-4000 Pulse Generator
Cyto Pulse Sciences, Inc. (Licensor), conveys to the licensee, for fee paid, a nonexclusive,
nontransferable license to use the PulseAgile® hardware and software (equipment) for research
purposes into perpetuity. Cyto Pulse Sciences, Inc., has patent allowance and patents pending covering
the PulseAgile® process. If the licensee wishes to use the hardware and software for production or
commercial purposes, an additional license shall be required.
The equipment is not approved by the FDA for use in vitro or for in vivo diagnostics or therapy.
The information in this manual is subject to change without notice.
Copyright 2000-2005 Cyto Pulse Sciences, Inc.
PA4000UMANrev.1-1/05
Price $100.00
PA4000 User Manual: rev.1-1/05
TM
Cyto Pulse Sciences, Inc.
Model PA-4000
Four Parameter PulseAgile ®
Electroporation System
User Manual
Cyto Pulse Sciences, Inc.
P. O. Box 609
Columbia, MD 21045
1-410-787-1890
1-410-787-1891 FAX
www.cytopulse.com
Cyto Pulse Sciences, Inc. makes no warranty with respect to the product except for the warranty set forth
in this Users Manual on page 7-1. The LIMITED WARRANTY SET FORTH ON PAGE 7-1 IS
EXCLUSIVE AND NO OTHER WARRANTY, WHETHER WRITTEN OR ORAL, IS EXPRESSED OR
IMPLIED. Cyto Pulse Sciences, Inc. SPECIFICALLY DISCLAIMS IMPLIED WARRANTIES OF
MERCHANTABILITY AND FITNESS FOR A PARTICULAR PURPOSE.
License Agreement
PA-4000 Pulse Generator
Cyto Pulse Sciences, Inc. (Licensor), conveys to the licensee, for fee paid, a nonexclusive,
nontransferable license to use the PulseAgile® hardware and software (equipment) for research
purposes into perpetuity. Cyto Pulse Sciences, Inc., has patent allowance and patents pending covering
the PulseAgile® process. If the licensee wishes to use the hardware and software for production or
commercial purposes, an additional license shall be required.
The equipment is not approved by the FDA for use in vitro or for in vivo diagnostics or therapy.
The information in this manual is subject to change without notice.
Copyright 2000-2005 Cyto Pulse Sciences, Inc.
PA4000UMANrev.1-1/05
Cyto Pulse Sciences, Inc. P. O. Box 609, Columbia, MD 21045 USA 410-715-0990
Price $100.00
i
PA4000 User Manual: rev.1-1/05
BlankPage
ii
Cyto Pulse Sciences, Inc. P. O. Box 609, Columbia, MD 21045 USA 410-715-0990
PA4000 User Manual: rev.1-1/05
Table of Contents
page
1.
Introduction
1-1
PA-4000 PulseAgile® Systems, Options, and Accessories
2.
Tutorials
2-1
2.1
Electroporation
2-1
2.2
Electroporation Equipment
2-2
2.2.1
2.2.2
2.2.3
2.2.4
2-2
2-4
2-6
2-6
2.3
2.4
2.5
Electric Fields in Aqueous Solutions and "Load"
Exponential Decay (ED) Electroporators
Rectangular Wave Electroporators
Cyto Pulse Sciences PA-4000 PulseAgile® Electroporator
Using and Optimizing PulseAgile® Protocols
2-6
2.3.1
2.3.2
2.3.3
2.3.4
2.3.5
2.3.6
2.3.7
2.3.8
2.3.9
2.3.10
2-7
2-7
2-8
2-8
2-8
2-9
2-9
2-9
2-10
2-10
Background
Initial Pore Formation
Initial Pulse Width
Follow-up High Voltage Pulse Further Pore Formation
Movement of Material into Cells
Cell Viability Factors – Heat
Cell Viability Factors - Excess Voltage
Other Cell Associated Factors
Solution Temperature, Pore Closing Times
Addition of Reagents
Method Development
2-10
2.4.1
2.4.2
2.4.3
2.4.4
2.4.5
2-10
2-11
2-11
2-12
2-12
2-12
2-12
2-13
2-13
2-13
2-13
2.4.6
2.4.7
2.4.8
2.4.9
3.
1-2
Choosing a Starting Point
Electroporation Medium
Reporter Molecules
Cell Viability
Electrical Parameters
2.4.5.1 Published Protocols
2.4.5.2 Cell Diameter
Optimize the first pulse
Optimize multiple, high voltage pulses
Optimize molecular transport
Further optimization of Molecular Transport Pulses
References
2-15
Operational Concepts
3-1
3.1
Important Concepts
3-1
3.1.1
3.1.2
3.1.3
3.1.4
3-1
3-2
3-2
3-4
3-4
3-4
3-6
3-6
3-7
3.1.5
3.1.6
3.1.7
Load Resistance and Conductance
Power Supply Voltage Setting and Voltage Monitor
Relationship Between Power Supply and Pulse Amplitude
Changing Amplitude from Pulse-to-Pulse
3.1.4.1 Decreasing Voltage from One Pulse to the Next
3.1.4.2 Increasing Voltage from One Pulse to the Next
Pre-Pulse Load Estimator
Pulse Droop
Aqueous Solution Heating
Cyto Pulse Sciences, Inc. P. O. Box 609, Columbia, MD 21045 USA 410-715-0990
iii
PA4000 User Manual: rev.1-1/05
3.2
4.
3-8
3-8
3-8
3-8
3-8
3-8
3-9
3-9
4-1
4.1
Introduction
4-1
4.2
PA-4000 Pulse Generator
4-1
4.2.1
4.2.2
Front Panel Features
Back Panel Connections
4-1
4-2
Cuvette Holder
Computers
PulseAgile® Software Installation
System Test
Oscilloscope Installation (Optional)
4-5
4-5
4-5
4-5
4-8
Software Operation
5-1
5.1
Introduction
5-1
5.2
The PulseAgile® PA-4000 Interface Software
5-2
5.2.1
5-2
5-2
5-3
5-3
5-3
5-3
5-3
5-3
5-4
5-4
5-4
5-4
5-5
5-5
5-6
5.2.2
5.2.3
5.2.4
5.2.5
5.2.6
5.3
The Toolbar
5.2.1.1 File Pull-down Menu
5.2.1.2 Tools Pull-down Menu
5.2.1.3 Settings Pull-down Menu
5.2.1.4 Help Pull-down Menu
Tools Area
5.2.2.1 Mode Select Buttons
5.2.2.2 Tool Buttons
Status Area
5.2.3.1 Options Connected
5.2.3.2 System
5.2.3.3 Monitors
Last Protocol Log Window
Electroporation Mode Control Panel Area
Running a protocol
Using the PulseAgile® Interface Software
5.3.1
5.3.2
5.3.3
5.3.4
iv
Cuvette Holder
Cuvette Holder Interlock
Short-Circuit Detection
Over Peak-Current Sensor
Over Average-Current Sensor
Microprocessor Protection
Pulse Voltage and Current Monitors
Set-Up
4.3
4.3
4.5
4.5
4.6
5.
Safety Features
3.2.1
3.2.2
3.2.3
3.2.4
3.2.5
3.2.6
3.2.7
PulseAgile® Protocol Conventions, the Pulse Group
Setup and Run a Basic Protocol
5.3.2.1 A Basic PulseAgile® Electroporation Protocol
5.3.2.2 Program the Basic Electroporation protocol
5.3.2.3 Save the Basic Protocol
5.3.2.4 Prepare a Test Sample and Run the Basic Protocol
Reviewing the Last Protocol Log and Log History
File Management
Cyto Pulse Sciences, Inc. P. O. Box 609, Columbia, MD 21045 USA 410-715-0990
5-6
5-7
5-7
5-7
5-7
5-8
5-9
5-10
PA4000 User Manual: rev.1-1/05
6.
Getting Started
6-1
6.1
Introduction
6-1
6.2
Example of Protocol Optimization
6-2
6.2.1
6-2
6-2
6-2
6-3
6-4
6-4
6-4
6.2.2
6.2.3
6.3
7.
Choosing Starting Pulse Voltage and Pulse Width
6.2.1.1 Calculate the Minimum Required Electric Field
6.2.1.2 Compare to Published Electric Field Data
6.2.1.3 Calculate Starting Pulse Amplitude and PA-4000 Set-Voltage
6.2.1.4 Quick Test of Starting Voltage
Amplitude of Low Voltage Pulses
Optimization of First Pulse
References
6-6
Customer Service
7-1
7.1
7.2
7-1
7-1
Limited Warranty
Customer Service
Appendix A PA-4000 Datasheet
Appendix B Pulse Voltage and Current Measurements
Appendix C Declarations of Conformity
Cyto Pulse Sciences, Inc. P. O. Box 609, Columbia, MD 21045 USA 410-715-0990
v
PA4000 User Manual: rev.1-1/05
List of Figures
page
2-1
2-2
2-3
2-4
2-5
2-6
2-7
2-8
Electropores
Pore Area
Electric Field in a Cuvette
Electric Field vs. Cuvette Spacing
Exponential Decay Generator
Pulse Amplitude vs. Time for an Exponential Decay Generator
Uptake Calcein
Cell Viability
2-1
2-1
2-3
2-3
2-4
2-5
2-14
2-14
3-1
3-2
3-3
3-4
3-5
Log Report Example
Power Supply and Pulse Amplitude Relationship
Typical Relationship between Power Supply and Pulse Amplitude
Minimum Pulse Interval for Decreasing Voltage between Pulses
Minimum Pulse Interval for Increasing Voltage between Pulses
3-2
3-3
3-4
3-5
3-5
4-1
4-2
4-3
PA-4000 Front Panel Features
PA-4000 Back Panel Features
PulseAgile® Opening Screen showing current system status
4-1
4-3
4-7
5-1
5-2
5-3
5-4
PulseAgile® Interface Electroporation Mode Screen
A Five-Pulse Protocol Divided into Four Groups of Pulses of Varying Parameters
The Last Protocol Log for the Basic Test Run
The Pulse-Train Delivered by the Basic Protocol
5-2
5-6
5-9
5-9
B-1
B-2
B-4
B-5
Oscilloscope Output Example
Simplified Circuit Diagram of Monitors
Error in Voltage Monitor Due to Current Viewing Resistor
Typical Pulse Voltage as a Percent of Power Supply Voltage
B-3
B-3
B-4
B-5
vi
Cyto Pulse Sciences, Inc. P. O. Box 609, Columbia, MD 21045 USA 410-715-0990
PA4000 User Manual: rev.1-1/05
Caution Notice
This instrument contains a high voltage power supply adjustable beyond 1,000 volts:
such voltage can be lethal.
The user must read this manual carefully before the instrument is placed into operation.
Removing the cover may void the warranty.
Do not connect or disconnect the high voltage cable with the high voltage enabled. To
connect or disconnect the cable, turn line power off and unplug line cord.
Do not open the cuvette holder while the high voltage is on. If a problem occurs during a run,
push the STOP/RESET button on the front panel.
If there is any question about the operation of this instrument, call Cyto Pulse Customer service.
Cyto Pulse Sciences, Inc. P. O. Box 609, Columbia, MD 21045 USA 410-715-0990
vii
PA4000 User Manual: rev.1-1/05
Blank Page
viii
Cyto Pulse Sciences, Inc. P. O. Box 609, Columbia, MD 21045 USA 410-715-0990
PA4000 User Manual Ch1: rev.1-1/05
1. Introduction
Electroporation (electropermeabilization) has many uses in the fields of cell biology,
medicine and microbiology. New uses are being discovered at a rapid pace. In addition to the
many in vitro uses for electroporation, new in vivo uses such as gene therapy and
chemotherapy using electroporation also are being developed.
PulseAgile® technology gives research and medical scientists the tools needed for
demanding new uses. PulseAgile® electroporation was developed to give the operator
maximum flexibility in protocol design and execution. Protocols can be optimized to give the
best cell viability, the highest transfection efficiency, or the best electroporation efficiency.
This manual is designed to help the user get the most benefit from using PulseAgile®
electroporation. It contains information on how to operate the electroporator, safety tips, some
important physical concepts, hints on how to adapt other protocols to PulseAgile® and hints on
developing your own protocols.
Note: The PA-4000 contains a high voltage power supply and was designed with
safety features to protect both the user and the equipment. Used properly, the
PA-4000 is a safe and reliable instrument. Chapter 3 explains some important
concepts related to safe and accurate use of the instrument. Chapter 3 must be
read and understood in order to properly set up this instrument. Our goal is the
safe and productive use of the PA-4000. This product shall only be used in the
manner specified by the manufacturer.
Back Panel Symbols
Protective
Terminal
Conductor
Caution:
Refer to
Documentation
Caution:
Risk of
Electric Shock
Chassis
Ground
The PA-4000, including the optional PA-101, PA-201, PA-96W, or PA-301 is rated for
operation with line/mains voltage of 100-240 VAC, maximum current of 2 amps, at 50-60 Hz.
The AC mains power supply cord is the disconnect device for this product. The power supply
cord shall be a Type SJT, rated 300 Volts AC, 18 AWG, 105° C, 3 conductor including ground.
This unit is rated for use at environmental conditions of 5-40° C, maximum relative
humidity 80% for temperatures up to 31° C decreasing linearly to 50% relative humidity at 40°
C, altitude to 2000 meters.
There are no operator replaceable parts inside the system; Cyto Pulse
recommends that the user not remove the cabinet covers.
Cyto Pulse Sciences, Inc., P. O. Box 609, Columbia, MD 21045 USA 410-787-1890
1-1
PA4000 User Manual Ch1: rev.1-1/05
PA-4000 PulseAgile® Systems, Options, and Accessories
The PA-4000 PulseAgile® electroporation system is the base of a number of advanced
component systems available from Cyto Pulse Sciences.
All of the systems include:
• The PulseAgile® interface software runs on a PC compatible desktop or laptop
computer with the following minimum requirements: 200 Mhz Intel Pentium®,
Windows® 95 , CD-ROM drive, at least one serial port.
• Cuvette Holder and Cuvettes - The cuvette holder is designed for maximum safety of
the user and integrity of the sample. The cuvettes are available in 1mm, 2mm, 4mm
gap spacing, and individually sterile-packaged.
• Cyto Pulse System User Manual - A User Manual is included for all systems and is
written for use by life scientists. The manual details the use and safety
considerations of the system
PA-4000S - Advanced PulseAgile® - Rectangular Wave Electroporation System
(restricted license sale)
This system will run most published square wave protocols and offers the PulseAgile® System
parameter variations of pulse amplitude, width and interval, along with protocol file and data logging
management. The system includes:
1
PA-4000
PulseAgile® - Advanced Rectangular Wave Electroporator
1
PA4-SW
PulseAgile® Application Software
1
PA-4UMAN
PA-4000 User Manual
1
CE-20
Standard Cuvette Holder
1
CUV-M
Cuvette Multi-pack (5 each 1mm, 2mm, 4mm)
1
CS-L-XX
IEC Line Cord, Serial Cable, XX = Country code
Optional Cyto Pulse Add-On Components
PA-96W - Programmable 96 Well Driver Option to PA-4000S (restricted license sale)
Provides the ability to electroporate cells in selected wells of a 96-well microplate. This add-on
system includes:
1
PA-96W
Programmable 96-Well Driver
1
PA-96W-UMAN
PA-96W User Manual
1
96W-A
Electrode array for 96 Well Plate
1
96W-B
96 Well Base
1
96W-P
96 Well Polypropylene Plate, square well, flat bottom, 10 each
1
CPS-LCM-C
Low conductivity medium, 500 ml bottle
1
CS-OPT
Interface Cable Set, DB25 cable, HV cable
PA-101S - Dielectrophoresis Option to PA4000S (restricted license sale)
The sinewave AC-generator dielectrophoresis option for cell alignment and fusion. This add-on
system includes:
1
PA-101
AC Generator
1
PA-101UMAN
PA-101 User Manual
1
FE-10
Fusion Plate Holder
1
FE-C25/400
Coaxial Electrodes, 2.5 mm gap, 350µL volume, set of 3
1
CPS-LCM-C
Low conductivity medium, 500 ml bottle
1
1-2
CS-OPT
Interface Cable Set, DB25 cable, HV cable
Cyto Pulse Sciences, Inc., P. O. Box 609, Columbia, MD 21045 USA 410-787-1890
PA4000 User Manual Ch1: rev.1-1/05
PA-201S - Programmable Pulse Switch Option to PA-4000S (restricted license sale)
A user-programmable switch that allows the PA-4000 to drive up to eight electrode elements
independently. This add-on system includes:
1
PA-201
Programmable Pulse Switch, 8 Outputs
1
PA-201UMAN
PA-201User Manual
1
CS-OPT
Interface Cable Set, DB25 cable, HV cable
1
CS-201
Eight-Wire Cable with plug for electrode connections
PA-301S - Pulse BoosterTM Option to PA-4000S (restricted license sale)
Capable of producing pulses up to 3000V, for higher electric-field applications. This add-on
system includes:
1
PA-301
Pulse BoosterTM 3:1 Step-Up Transformer
1
PA-301UMAN
PA-301User Manual
1
CS-OPT
Interface Cable Set, DB25 cable, HV cable
Optional Components Purchased Separately
DS-100
CS-DS
PCL
A Tektronix® digital oscilloscope with the CS-DS cable set and software
Oscilloscope Cable Set, Three RG-58 coaxial cables with 50-ohm terminations
Laptop computer with the PulseAgile® interface software installed
Cuvettes, Electrodes, Plates and Holders
CUV-01
CUV-02
CUV-04
CUV-M
CE-20
CE-24
Standard Cuvette, 1 mm spacing, one time use
Standard Cuvette, 2 mm spacing, one time use
Standard Cuvette, 4 mm spacing, one time use
Multi-pack (five each of the above), one time use
Cuvette Holder for standard cuvettes
Cuvette Holder for reversing electric fields in a cuvette, for use with PA-201
TE-5-10
TE-5R
Tweezer Electrode, 5 mm x 10 mm pad
Tweezer Electrode, 5 mm round pad
NE-4-4
NE-4-6
NE-6-4
NE-6-6
Parallel-Row Needle Array, 4 mm space, 4 needles/row
Parallel-Row Needle Array, 4 mm space, 6 needles/row
Parallel-Row Needle Array, 6 mm space, 4 needles/row
Parallel-Row Needle Array, 6 mm space, 6 needles/row
FP-C25/400
FP-C25/800
FP-C20/1000
FE-10
Coaxial Fusion Electrode, 2.5 mm gap, 350µL volume
Coaxial Fusion Electrode, 2.5 mm gap, 750µL volume
Coaxial Fusion Electrode, 2 mm gap, 1000µL volume
Coaxial electrode holder, for use with PA-101
96W-A
96W-P
96W-PS
Array Electrode for PA-96W
Microplate
Microplate, Sterile (γ irradiated)
All of the products sold or licensed by Cyto Pulse Sciences, Inc. are for research use
only and are not approved by the United Sates Food and Drug Administration for in vitro or in
vivo diagnostics/therapy or any other purpose.
Cyto Pulse Sciences, Inc., P. O. Box 609, Columbia, MD 21045 USA 410-787-1890
1-3
PA4000 User Manual Ch1: rev.1-1/05
Blank Page
1-4
Cyto Pulse Sciences, Inc., P. O. Box 609, Columbia, MD 21045 USA 410-787-1890
PA-4000 User Manual Ch2: Rev.1-1/05
2. Tutorials
This chapter presents tutorials on electroporation and the various types of equipment
used in the electroporation field.
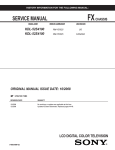
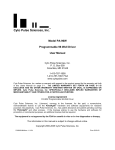
2.1 Electroporation
Electroporation is the name for the use of a trans-membrane electric field pulse to
induce an effective state of poration in a bio-membrane. The pores formed by this process are
commonly called electropores. Their presence allows molecules, ions, and water to pass from
one side of the membrane to the other. As Figure 2-1 shows, the electropores are located
primarily on the surfaces of cells that are closest to the electrodes. If the electric field pulse has
the proper parameters, then the ‘’electroporated’’
E
cells can recover (the electropores reseal
spontaneously) and cells will continue to grow and
express their genetic material.
+
-
A
B
Figure 2-1: Electropores
The use of electroporation became very
popular through the 1980s because it was found to
be an exceptionally practical way to place drugs,
genetic material (e.g., DNA), or other molecules into
cells. In the late 1980s, scientists began to use
electroporation protocols with multi-cellular tissue as
well as cell suspensions.
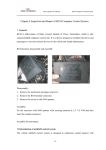
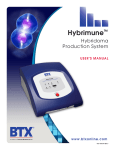
Total Pore Area
Though cell-to-cell biological variability
causes some cells to be more sensitive to electroporation than other cells, pore formation,
number, and effective diameter is generally a function of the product of the pulse amplitude and
the pulse duration (Figure 2-2). In order for pores to form, this product has to be above a
threshold. In Figure 2-2 lines ‘’A’’ and ‘’B’’ identify thresholds where pore formation begins.
Additionally, pore number and effective pore diameter increase with the product of pulse
amplitude and pulse duration. Although other factors
are involved, this threshold is now understood to be
largely dependent on the reciprocal of cell size. If the
upper limit threshold is reached (lines ‘’C’’ and ‘’D’’),
pore diameter and total pore area become too large
for the cell to repair by any spontaneous or biological
process. Therefore the cell is irreversibly damaged.
To prevent this damage, pulse protocols are
empirically developed to be at some point above
threshold and below lethality.
Since the mechanism of electroporation is not
well understood, the development of protocols for a
particular application to a previously uncharacterized
cell or tissue have usually been achieved by
empirically adjusting pulse parameters such as
amplitude, duration, number, and inter-pulse interval.
A
B
C
D
Pulse Amplitude x Pulse Duration
Initial Pulse
Figure 2-2: Pore Area
Cyto Pulse Sciences, Inc., P. O. Box 609, Columbia, MD 21045 USA 410-787-1890
2-1
PA-4000 User Manual Ch2: Rev.1-1/05
Although early research on electropore-mediated transport across membranes assumed
that simple thermal motion (i.e., diffusion) propelled molecules through electropores, research in
the late 1980s and early 1990s began to reveal that movement of molecules through
electropores depends on other experimental conditions and electrical pulse parameters in a way
that indicates that other processes are involved. These reports show that certain experimental
conditions and parameters of electrical pulses may be capable of causing many more molecules
to move per unit time than simple diffusion. For example, referring to Figure 2-1, there is good
evidence that molecular flow is in the direction of the arrow ‘’A’’ (Dimitrov and Sowers, 1990).
However, there is also good evidence that DNA movement is in the direction of the arrow ‘’B’’
(Sukharev, et. al., 1992). This implies that electroporation has a polarity dependence. Although
this apparent contradiction will have to be resolved by future basic research, it clearly shows
that movement of molecules during electroporation is active rather than passive.
An additional important consideration is heat generation during electroporation. During
the electroporation pulse, the electric field causes electrical current to flow through the cell
suspension or tissue. Biologically relevant buffers for cells, culture medium and fluid in extracellular space in tissues contain ions at concentrations high enough to cause high electric
currents to flow. These currents can lead to dramatic heating that is biologically unacceptable.
This is explained in more detail in the tutorial on ‘’Equipment’’. Principles of physics suggest
that the early part of an exponentially decaying pulse does most of the membrane porating but
the late part continues to heat the medium as well as molecular movement. One way to
minimize heating is to use relatively high amplitude, short duration, rectangular wave pulse
instead of an exponentially decaying pulse. If multiple pulses are used, second and subsequent
pulses may be shortened to reduce the total energy input into the solution.
There are two main electroporation waveforms, exponentially decaying, and, rectangular
wave. Different types of electronic equipment generate these waveforms.
2.2 Electroporation Equipment
2.2.1 Electric Fields in Aqueous Solutions and “Load”
The basic process of electroporation and electrofusion requires that cells be exposed to
electric fields with special characteristics. In the most elementary form, the electric field can be
viewed as a voltage applied to two rectangular plates with spacing between the plates (see D in
Figure 2-3 below). The electric field is not dependent on the material between the plates.
As an example, to a first approximation, the applied electric field needed to impress a
threshold voltage of one volt across a cell must be:
Paramecium
Mammalian Cell
Red Blood Cell
Bacterial Cell
180 µm
50 µm
7 µm
1 µm
55 v/cm
200v/cm
1430 v/cm
10,000 v/cm
More precise estimates of electric field requirements will involve the use of the so-called
Schwann equation. For more information refer to Kinosita, etal., 1992.
2-2
Cyto Pulse Sciences, Inc., P. O. Box 609, Columbia, MD 21045 USA 410-787-1890
PA-4000 User Manual Ch2: Rev.1-1/05
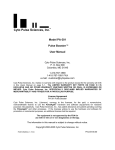
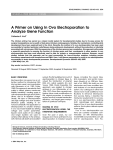
In electroporation applications, a
typical chamber will have an electrode
spacing (D) that will range from 1 mm to
10 mm. Standard cuvettes are widely
available in 1 mm, 2 mm, and 4 mm
spacing. To obtain the required electric
field intensities, high voltage pulse
generators have adjustable pulse
amplitudes from tens of volts to over 1000
volts. Figure 2.4 presents the electric
field intensity for standard cuvettes and
applied pulse voltages.
Spacing
D
Plate
Area
E
E = Voltage/D
Voltage
The concept of resistance is also
very important in this process. From
basic physics, Ohm’s Law states:
Figure 2-3: Electric Field in a Cuvette
Current = voltage / resistance
Current is the quantity of electrons flowing per second. Resistance (Ω, omega), or
“load,” is the hindrance to that flow (measured in ohms) at the applied voltage. Current is
similar to water flowing in a pipe. A smaller diameter pipe allows fewer water molecules per
second to flow. In this case, water pressure is analogous to voltage.
14000
D = 0.75 mm
Electric Field in Cuvette - v/cm
12000
D = 1 mm
10000
8000
6000
D = 2 mm
4000
D = 4 mm
2000
D = 10 mm
In biology, the solution in
which the cells are contained will
determine the sample’s electrical
resistance. Solutions such as
phosphate-buffered saline (PBS)
are very ionic and will conduct a
large amount of current. Distilled
water (DW) and solutions containing
sucrose in distilled water are not
ionic and will conduct a small
amount of current. When
discussing the conducting
properties of material or solutions, a
common parameter used is
resistivity, represented by the Greek
symbol, ρ (rho). This is given in
ohm-cm and is related to resistance
by the formula:
resistance = ρ ∗ ( D / A)
0
0
200
400
600
800
Pulse Amplitude - volts
Figure 2-4: Electric Field vs. Cuvette Spacing
1000
where:
ρ = resistivity, ohm-cm
D = plate spacing, cm
A = plate contact area, cm2
Cyto Pulse Sciences, Inc., P. O. Box 609, Columbia, MD 21045 USA 410-787-1890
2-3
PA-4000 User Manual Ch2: Rev.1-1/05
Additionally, conductive properties are also described as conductivity. Conductivity is
simply the reciprocal of resistivity:
Conductivity (σ) = 1
ρ in the units siemens/cm.
The reason for using resistivity or conductivity to describe the conducting properties of a
material is that they are independent of electrode spacing and the electrode area in contact with
the material. The resistance, however, is dependent on the physical dimensions. Standard
cuvettes have fixed separation between plates, e.g., 1, 2, or 4 mm, and fixed electrode areas of
1 or 2 cm2. The same-sized cuvette filled to different volumes results in samples with different
resistances due to the different area of electrode contact. The table below shows resistivity and
resistance data for standard cuvettes filled with phosphate-buffered saline (PBS) and distilled
water (DW). Incidentally, DW is one of the most resistive (least conductive) solutions.
Table of Resistance (Load)
ρ
Ω-cm
*
Cuvette and
Volume
Resistance
Ω
1 mm
with 50 µl
2 mm
with 200 µl
4 mm
with 800 µl
PBS1
60 @ 25 oC
12
12
12
Distilled Water2
18x106
3.6x10⁶
3.6x10⁶
3.6x10⁶
1. Sigma PBS cat # D8662 2. Sigma water cat # W3500
*
Resistivity is a strong function of temperature, value given at 25 oC.
If a 1000-volt pulse is applied to a cuvette with a 2 mm spacing and 200 µl PBS buffer,
the current that will flow is:
1000 volts / 12 ohms = 83 amps
2.2.2 Exponential Decay (ED) Electroporators
The simplest approach to generating a high voltage pulse is to charge a capacitor (C)
with a high voltage power supply, and then discharge the capacitor into the chamber containing
the cells in the desired aqueous medium or
Charge / Discharge
Switch
buffer. The cells and the buffer represent
the electrical “load” or resistance (R) for the
high voltage pulse, see Figure 2.5. The
charge switch is shown “closed” and the
discharge switch is shown “open”. When
the sample is to be pulsed, these switch
Resistance
positions are reversed and the discharge
High Voltage
of Material in
Reservoir
switch remains closed until the capacitor is
Power Supply
Solution
Capacitor
"Load"
completely discharged. This capacitor is
also called a reservoir capacitor. The
number of electrons that the capacitor can
store (“size”) is measured in farads, and
given the symbol F, which is the number of
electrons per volt.
Figure 2-5: Exponential Decay Generator
2-4
Cyto Pulse Sciences, Inc., P. O. Box 609, Columbia, MD 21045 USA 410-787-1890
PA-4000 User Manual Ch2: Rev.1-1/05
The pulse width is dependent on the size of the capacitor and the resistance (“load”) of
the medium (solution or tissue). The pulse shape is a double exponential with a very fast rise
time and a slow exponential decay fall time. The width at the 50% of amplitude point is given
by:
Width (50%) = 0.7 x C (farads) x R (ohms)
For example, if an ED porator has a 500 µF reservoir capacitor and discharges into a 2
mm cuvette filled with 200 µl PBS (resistance of 12 ohms), the pulse width at the 50%-ofamplitude point is about 6 milliseconds. Below is a graph showing waveforms for a 50 µF, 500
µF, and 5000 µF reservoir capacitor and a 16 ohm Load Resistance. The waveform follows a
standard exponential or ”half-time” decay.
1000
Voltage - volts
800
600
400
5000 µF
200
500 µF
50 µF
0
0
50
100
150
200
Time From Pulse Start - milliseconds
Figure 2-6: Pulse Amplitude vs. Time for an Exponential-Decay Waveform
The Exponential Decay pulser, although inexpensive, is a relatively crude device. As
can be seen from the above example, the amplitude needed for electroporating is in the early
portion of the pulse, but then the total area under the curve contributes to heating the sample.
Additionally, the pulse width is dependent on the conductivity of the solution or tissue being
porated and, without compensation; changes from one experiment to the next will cause the
pulse width to change. Finally, since the capacitor is totally discharged in a single pulse, it must
be totally recharged before it can be used again. This property will limit protocols where
multiple pulses are required.
2.2.3 Rectangular Wave Electroporators
The next level of sophistication in generating pulses is achieved by using a high voltage
solid-state switch that is turned on only for the desired pulse duration. This system still has a
Cyto Pulse Sciences, Inc., P. O. Box 609, Columbia, MD 21045 USA 410-787-1890
2-5
PA-4000 User Manual Ch2: Rev.1-1/05
reservoir capacitor, but it is only discharged by a few percent during a pulse. This approach
permits the pulse width to be set to any value desired by the user. The pulse width delivered to
the chamber is now independent of chamber resistance and the pulse amplitude remains
relatively constant during the time the pulse is on. Together, these properties provide a more
repeatable pulsed electric field. In addition, since the capacitor is only discharged a few
percent, the voltage on the reservoir capacitor can rapidly be brought up to full value permitting
multiple pulses with relatively short pulse intervals. The rectangular wave pulser eliminates
many of the drawbacks of the ED pulser.
2.2.4 Cyto Pulse Sciences PA-4000 PulseAgile® Electroporator
The PA-4000 PulseAgile® electroporator provides the highest level of sophistication in
the market today. It provides control of all pulse parameters with the ability to set pulse width,
amplitude, time between pulses and the electric field direction. The PA-4000 system provides
researchers with the tools to design and implement optimal electroporation protocols.
The rest of this manual is devoted to the description and use of PulseAgile®
electroporation. The goal is to provide you with the ability to get the best use of this patented
technology.
2.3 Using and Optimizing PulseAgile® Protocols
The simplest way to start using PulseAgile® protocols is to begin with published pulse
parameters for the cell type with which you are working. Until PulseAgile® protocol optimization
is done, standard published procedures and parameters can be used. The PA-4000 can readily
deliver single pulses or pulse trains according to standard published specifications.
However, optimization may be desirable in certain circumstances when cells are difficult
to replace or when high yield or viability is needed. PulseAgile® electroporation protocols give
you the flexibility to achieve your goals.
Optimization of an electroporation protocol is an empirical process, but there are some
principles that can be used to narrow the search for an ideal protocol. For instance, there are at
least two (and probably more) mechanisms that have been proposed for movement of DNA into
cells during transfection. They are:
•
Electrophoresis(1,2)
•
Electroosmosis(4)
Thermodiffusion and osmotic flow of medium have also been proposed as transport
mechanisms, but there is little evidence that they play more than a minor role.(3)
For any of these mechanisms to work, the first pulse must permeate the cell. That
means that the first pulse must be above the cell electroporation threshold. In PulseAgile®
protocols, this pulse may have a shorter duration than published parameters because the first
pulse does not have to do all of the work of inducing poration and transport simultaneously.
Second and subsequent pulses are used to increase effective pore area and to assist in
molecular transport. In general, the area of the cells that is permeable during electroporation is
proportional to the strength of the applied electric field. The size of pores induced is roughly
proportional to the width of the applied pulse.
According to one theory, pores are formed in cells by a rearrangement of phospholipids
to a transiently stable pore shape. This rearrangement occurs normally in cells at a very low
rate. The applied electric field serves to increase the probability of formation of transiently
stable pores. There is an energy “hill” that pores must “climb” before rearranging from
2-6
Cyto Pulse Sciences, Inc., P. O. Box 609, Columbia, MD 21045 USA 410-787-1890
PA-4000 User Manual Ch2: Rev.1-1/05
transiently stable pores to normal bilipid layer cell membrane. Therefore pores close at a slower
rate than they form. Thus for a brief time, up to seconds, a significant number of pores exist
after the pulsed electric field is turned off. This is the time during which electrophoretic pulses
can work to move charged molecules such as DNA into cells. For practical purposes, after
about 3 seconds, the pores are closed to movement of large molecules into cells.
The optimization process should proceed iteratively, modifying one variable at a time.
The following is a general outline for optimizing protocols.
2.3.1 Background
There are several components to PulseAgile® protocols. It helps to breakdown the
optimization process into parts to address the variables and avoid becoming overwhelmed by
the number of possible combinations. An electroporation protocol can be broken down into
three parts.
1. First pulse to begin initial pore formation
2. Follow-up high voltage pulses to yield further pore formation
3. Material moves into the cell
Other factors that influence the electroporation process are:
1. Cell viability factors
2. Brownian movement and vector considerations.
2.3.2 Initial Pore Formation
When an external electrical potential is applied to a cell, the cell membrane resists
breakdown until a critical threshold voltage is achieved. As the voltage reaches the threshold,
the cell membrane ceases to resist and a pore is formed in the cell membrane. The breakdown
voltage is roughly one volt (0.2 to 2-volts) across the cell membrane. Mathematically, voltage at
the cell membrane is defined as Vm = 1.5 rE cos B where r is the radius of the cell, E is the
strength of the external field, B is the angle between the direction of the external field and the
normal vector of the membrane at the specific site.
Since the breakdown voltage is approximately 1-volt, the critical voltage for a cell in
volts/micron is E = 1/1.5 r, at the poles where cosB = 1. Multiplying this result by 10,000 gives
the result in Volts/cm. For example, for a 40 micron diameter cell, the voltage needed to
achieve critical voltage is 1/(1.5X20) = 0.033-volts/micron or 333-volts/cm. In practice, higher
voltages are used since the above calculated voltage is only the minimum breakdown voltage.
The charge impressed upon a membrane during the application of a pulsed electric field
creates a pressure across the cell membrane. This pressure is an altered energy state around
the membrane and creates a condition where pores can form. Normally, the most stable state
of least energy for a membrane is a continuous bilipid layer membrane. Another stable bilipid
layer structure is an organized pore across the membrane. This is a slightly higher energy state
than a flat bilipid layer. For a membrane to restructure from one of these stable states to
another requires transitioning through a, less organized, higher energy state. According to one
model of pore formation, pressure across a cell membrane created by charge redistribution
reduces the transition energy and therefore makes it easier for pores to form. Once a pore
forms, a path is created for electrical current to flow which relieves local pressure and maintains
a favorable energy state for pores to remain open during application of the electric field.
Cyto Pulse Sciences, Inc., P. O. Box 609, Columbia, MD 21045 USA 410-787-1890
2-7
PA-4000 User Manual Ch2: Rev.1-1/05
Two practical conclusions derive from this model. One is that continued application of
high electric fields can force continued enlargement of pore size. Thus, electric fields cannot be
applied indefinitely. Another conclusion is that, although pore formation is fast (microseconds),
pore closure is slower (milliseconds to seconds). In practice, pores are effectively closed by
three seconds after application of pulsed electric fields even though some investigators have
detected pores in cell membranes for more than 30 minutes.
Another factor to consider is that cells have a natural net charge across the cell
membrane created by sodium pumps. It is around -70 mV in most cells. This charge is still
present when an applied electric field re-distributes charges within the cell. The -70 mV them
makes a negative charge that much larger and a positive charge that much smaller. This
results in a different transmembrane voltage at each pole of the cell in line with the electric field.
It is larger on the pole of the cell facing the negative electrode. The larger transmembrane
voltage results in a larger area of the cell membrane having a voltage greater than threshold
and therefore a larger area containing pores.
The movement of DNA is toward the positive electrode since DNA has a net negative
charge. This means that it moves into the cell at the pole with the lower transmembrane
voltage. In theory, pores could be induced in cell membranes with first pulses and the electric
field reversed to move DNA into the cell on the side of greatest porosity. That process would
require a PA-201 Programmable Pulse Switch option
2.3.3 Initial Pulse Width
The initial pulse width needs to be long enough to allow for pore formation and short
enough to prevent excessive pore expansion or heat formation. A short period of time is
needed for membranes to respond to the applied force. Minimum times are under one
microsecond so this is not a practical limiting factor. Maximum pulse width is not a precise point
and depends upon the cell viability desired. Over a limited range, increasing pulse width is
equivalent to increasing pulse voltage. That is, effective electroporation is proportional to the
area defined by voltage X pulse width. We suggest initial pulse widths in the range of 10 to 100
microseconds.
2.3.4 Follow-Up High Voltage Pulses Further Pore Formation
A follow-up pulse is defined for this manual as any pulse that 1) has a voltage above
critical voltage, and 2) is applied after the first pulse. Little is known about what effect second
and subsequent pulses have on the cell’s pore size or number. Multiple pulses are reported to
give better results than single pulses in many protocols. For practical purposes, follow-up
pulses should be the same width or narrower than the first pulse.
2.3.5 Movement of Material into Cells
Two forces are known to affect transport of molecules into cells. One is electroosmosis.
This force occurs as a result of charge differences between the cell membrane within the pore
and water molecules adjacent to the charged membrane. The membrane is negatively charged.
As a result, the layer of water immediately adjacent to the cell membrane is positively charged.
This results in movement of water within the pore toward the negative electrode. Movement of
water into the cell on one end and out of the cell on the other end pulls dissolved molecules in
the direction of water transport.
The other known material transport force is electrophoresis. Negatively charged
molecules such as DNA move toward the positive electrode (opposite to the direction of
2-8
Cyto Pulse Sciences, Inc., P. O. Box 609, Columbia, MD 21045 USA 410-787-1890
PA-4000 User Manual Ch2: Rev.1-1/05
electroosmosis). This force is linearly proportional to the voltage and time of voltage
application. This means that the best transport by electrophoresis occurs in high voltage fields
that are applied continuously. There are important factors such as heat production that limit the
voltage and the duration of voltage application that can be applied to cell suspensions.
Generally, the most practical and effective molecular movement derived from electrophoresis is
obtained when lower voltages are applied in multiple, medium to long length pulses. One
publication suggested that all effective movement due to electrophoresis occurs within 3
seconds of the original pulse. That time limit can serve as a guideline.
2.3.6 Cell Viability Factors - Heat
One important limit to the length of time that voltage (and the resultant current) can be
applied to cells is heat production within the solution. Heat production is exponentially
proportional to electrical current within the solution. After pulses are applied, there is some
cooling within a solution due to a heat sink effect from the relatively large mass of metal in the
electrodes. However, the cooling is not rapid enough to compensate for the rapid rise in
temperature related to excessive electrical current during the application of pulses.
One method to compensate for heat production due to electrical current is to reduce the
applied voltage and deliver wider pulses. While heat reduction is exponentially related to
voltage reduction, the loss of movement by electrophoretic force is only linearly related.
Movement due to electrophoresis is accomplished by electrical charge.
For example, a reduction of the voltage by half, coupled with a simultaneous doubling of
pulse width results in the same movement of material by charge. The heat produced under the
same condition is halved. In practice, multiple, wide, low voltage pulses are used to induce
transport of material by electrophoresis after pores are formed by shorter, high voltage pulses.
See section 3.1.5 to calculate temperature increase in an electroporation cuvette.
Another way to reduce heating is to use Cyto Pulse low conductivity medium.
2.3.7 Cell Viability Factors - Excess Voltage
Pulse voltages much beyond breakdown threshold result in formation of pores too large
to spontaneously repair. As a result, cells lyse or die from loss of cytoplasmic content. In a cell
suspension composed of uniform diameter cells, reducing the voltage readily solves the
problem of extreme cell death due to excess voltage. In most cell suspensions, the diameter of
individual cells does vary and there is a distribution of cell sizes. Because of this, some cell
death is inevitable. The larger cells will be killed as the optimal voltage for average cells is
applied. Conventionally, maximum poration has been observed using pulses where about half
of the cells are killed. This is because traditional protocols use the same pulse conditions for
material transport as those to initially form the pores. PulseAgile® allows separation of desired
effects with resultant increases in efficiency and less cell death. For example, in K562 cells, we
have achieved 40% transfection with less than 10% cell death using PulseAgile® protocols.
2.3.8 Other Cell-Associated Factors
Other cell specific factors add to variability in electroporation efficiency. Cell cytoskeletal
structure is an example. Increased density of cell cytoskeleton at the site of pore formation can
make the cell more resistant to detrimental effects of excessive pore expansion. Roughness of
the cell due to cell processes or villi is another example.
Cyto Pulse Sciences, Inc., P. O. Box 609, Columbia, MD 21045 USA 410-787-1890
2-9
PA-4000 User Manual Ch2: Rev.1-1/05
2.3.9 Solution Temperature, Pore Closing Times
The temperature of the cell membrane (or medium) influences pore life-span. Cell
membrane pores remain open for seconds to minutes at room temperature. Higher
temperatures accelerate pore closure. Alternatively, at 4 oC, cell membranes are viscous and
inflexible and pore closure is slower. Pore induction or formation is similarly affected by
temperature variations. It is more difficult to induce pores in cold cell membranes. For
maximum pore life, cells would be electroporated at 27-37 oC and brought rapidly to 4 oC.
These methods of prolonging pore life are rarely practical.
2.3.10 Addition of Reagents
Electroporation efficiency is much higher if the molecules that you want to introduce into
cells (DNA, proteins, and small molecules) are in the cell suspension before application of
pulses rather than after. Even though electropores are theoretically open for seconds to
minutes, close association of DNA with cells at the time of electroporation is essential.
2.4 Method Development
Many combinations of pulse parameters are possible using PulseAgile® electroporation.
Also, there are several ways to arrive at an optimal combination of electroporation parameters.
The following is one suggested methodology.
1. Choose a starting point, goals, medium and reporter molecules.
2. Optimize initial pore formation.
3. Optimize follow-up pulses
4. Optimize molecular transport.
5. Repeat steps 2, 3, 4, if necessary and optimize other parameters, if desired.
2.4.1 Choosing a Starting Point
First, choose goals for the electroporation procedure. The following questions may help:
2-10
•
What molecules are you trying to get into the cell?
•
What are the characteristics of the molecules (size, charge in solution, etc.)?
•
What type of cell are you using?
•
What are the cell’s characteristics?
•
What is the cell size?
•
Do the cells have cell walls?
•
Are there any substances in the proposed medium that are toxic to the cells?
•
Is cell viability important?
•
Is electroporation efficiency important?
•
Are single clones to be selected from the cells?
•
Are cells to be part of a library?
•
Are cells to be used in bulk without cloning?
Cyto Pulse Sciences, Inc., P. O. Box 609, Columbia, MD 21045 USA 410-787-1890
PA-4000 User Manual Ch2: Rev.1-1/05
•
Will this protocol be used repeatedly or will this be a one-time use?
•
What other factors are important?
Using this list, you should be able to choose the desired result. For instance, if the
desired goal is generating a clone of cells from a group of cells transfected with the same
plasmid, the percent of viable cells need not be high. If the goal is genetic engineering of rare
primary cells, cell viability is very important. From this evaluation, you should be able to answer
important questions regarding your electroporation goals.
2.4.2 Electroporation Medium
Choice of the electroporation medium involves compromise. Voltage drop during the
pulse and heat generation are easily controlled when using high resistance, low ionic medium.
The use of Cyto Pulse low conductivity medium is recommended for this purpose.
2.4.3 Reporter Molecules
Electroporation protocol development is much easier if a reporter molecule is available
to readily assess the status of electroporation efficiency. Some available materials are:
DNA (with appropriate promoters)
lac-Z (B-galactosidase)
green fluorescent protein
Chloramphenicol acetyltransferase
Luciferase
antibiotic resistance
Non-DNA
FITC labeled dextrans
Calcein
propidium iodide
trypan blue
The choice of reporter molecule is based upon 1) the similarity in composition and size
of the reporter molecule to the molecule of interest, and 2) the ability to assay for the reporter
molecule. For example, it is a simple matter to screen for antibiotic resistance in bacteria that
have been transfected with a plasmid containing an antibiotic resistance gene. Similarly, if a
fluorescent microscope or a flow cytometer is available, the green fluorescent protein gene
under the control of a constitutive mammalian expression promoter makes an ideal reporter
gene. The fluorescent labeled dextrans are available in several molecular weights. Proteins
can be directly labeled with fluorescein. Note that it is much harder to detect fluorescein labeled
dextrans or proteins than it is to detect gene products because of the amplification inherent in
DNA expression.
Cyto Pulse Sciences, Inc., P. O. Box 609, Columbia, MD 21045 USA 410-787-1890
2-11
PA-4000 User Manual Ch2: Rev.1-1/05
2.4.4 Cell Viability
In addition to choosing a method for measuring yield, a method for measuring cell
viability is needed. Methods include
1.
colony formation (colony count) before and after electroporation
2.
trypan blue dye uptake (hours after the electroporation)
3.
simple cell counts on tissue culture plates the day after electroporation
4.
vital dye uptake of cells attached to a plate 24 hours after electroporation followed
by an absorption reading of eluted dye
5.
Alimar blue or other metabolic dyes
6.
flow cytometric analysis, or other fluorometric analyses, of Calcein AM dye uptake
7.
tritiated thymidine uptake.
There are many more methods, although the gold standard is colony formation. Note
that vital dyes will penetrate permeabilized cells for some time after electroporation and cells
that take up the dye may not be dead.
2.4.5 Electrical Parameters
There are at least two methods for choosing initial pulse parameters for electroporation
protocols. They are:
1. Adapting to existing protocols and optimizing from this starting point.
2. Using cell diameter as a starting point
2.4.5.1 Published Protocols.
If you have a protocol that you have developed or a protocol that others have published,
start with those protocol values. It is more complicated to adapt an exponential wave protocol to
PulseAgile® in comparison to rectangular wave protocols.
The adaptation of exponential decay protocols is as follows: The first pulse is of the
same voltage as the peak exponential voltage with a pulse width of 10 to 100 microseconds.
This pulse will be the pore-forming pulse. The second pulse is half the voltage and twice as
wide. The third pulse is half again the voltage and twice as long as the second pulse. A fourth
pulse may be optionally be added with half again the voltage and twice again the pulse width.
2.4.5.2 Cell Diameter
If published protocols are not available for your cell type, values for a similar cell type
can be used or a starting voltage can be calculated using the average cell radius (in microns) of
the cells in suspension. The formula described below can be used to calculate a starting point.
Often, multiples of the threshold voltage are used.
Threshold in volts/cm, E ≅
2-12
10,000
15
. r , where r is the cell radius.
Cyto Pulse Sciences, Inc., P. O. Box 609, Columbia, MD 21045 USA 410-787-1890
PA-4000 User Manual Ch2: Rev.1-1/05
2.4.6 Optimize the First Pulse
There are many combinations possible using PulseAgile® technology and there are
several ways to arrive at the optimal combination. The following is one way.
Start with an evaluation of the effect of first-pulse electric field on cell viability. Pick a
range of electric fields to work with around the chosen starting electric field. Generally, twice
the threshold voltage is a reasonable starting voltage. A range of the starting voltage ± 33-50%
should be sufficient. Divide the range into equal parts of 25-50 volts/cm and test the effect of
each electric field on viability. Pulse widths of 10 to 100 microseconds are a good starting point.
It may be important to start with higher initial cell viability than needed to compensate for
changes made to the protocol during optimization. Further optimization by changing the pulse
width and number of pulses can be done at this time but it is a good idea to wait until follow-up
lower voltage, pulses have been optimized.
As soon as more than one pulse is added to the protocol, either as initial pulses, followup pulses, or material transport pulses, a pulse interval needs to be chosen. A good initial
interval is 125 milliseconds. Note that in rectangular wave or in PulseAgile® protocols, pulse
intervals are usually in milliseconds and pulse widths are usually in microseconds.
2.4.7 Optimize Multiple High Voltage Pulses
More than one high voltage pulse may be needed. Often 2 to 6 pulses are optimum.
These pulses can be of the same voltage as the first pulse or lower than the first pulse but still
above threshold voltage. It is most efficient to optimize follow-up pulses using a factorial
analysis design, varying pulse voltage and pulse number simultaneously.
2.4.8 Optimize Molecular Transport
Molecular transport pulses are designed to move charged molecules into cells after
pores have been induced. The electric field of the material transport pulses is lower than the
first pulses. Values at or below threshold are used.
2.4.9 Further Optimization of Molecular Transport Pulses
All further optimization should focus on yield and cell viability simultaneously. It is
important to monitor both yield and cell viability in order to identify positive or negative trends in
electroporation efficiency. Choose a range of voltages to be tested. Values of one half, one
fourth, one eighth and one sixteenth of the voltage of the first pulse are reasonable starting
values. Choose a range of pulse widths to be tested for each voltage. Start with a range of 200
microseconds to 2 milliseconds. Begin the optimization process using multiple pulses since
multiple pulses will often be used in the final protocol. Four pulses is a good starting point.
Keeping the number of pulses and pulse widths fixed, test the effect of changing voltage within
the range of voltages. Then test the range of pulse widths against the optimal voltage. Repeat
this process until an optimum is found. Again, employing a factorial analysis by modifying
electric field, pulse width and pulse number simultaneously may save time. The reason for the
increased efficiency is that with a factorial design, interactions can be assessed and
experimental variability is measured over the entire assay rather than just repetitions at
individual independent variables.
Cyto Pulse Sciences, Inc., P. O. Box 609, Columbia, MD 21045 USA 410-787-1890
2-13
PA-4000 User Manual Ch2: Rev.1-1/05
2
100
cell viability (%)
calcein molecules/cell
(x 106)
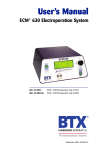
Figure 2-7 shows that molecular uptake of calcein (a fluorescent tracer molecule) is
enhanced with PulseAgile® protocols compared to a single pulse protocol. The single pulse
protocol was applied at 3.3 kV/cm for 50 µs. The PulseAgile® protocols included a single pulse
(3.3 kV/cm, 50 µs) followed 0.125 seconds later by 10 pulses of 1 ms and 0.4 kV/cm with
interval of either () 0.125 s or (░) 20 sec. DU 145 prostate cancer cells were used at 2 X 10⁶
cells/ml, in a 2 mm gap cuvette, and 10 µM calcein. Molecular transport and cell viability were
calculated using calibrated flow cytometry with propidium iodide as the viability stain. Figure 2.8
shows that cell viability was shown to not decrease with the PulseAgile® protocols.
1
50
0
0
Single Pulse
PulseAgile
Figure 2-7: Uptake Calcein
Single Pulse
PulseAgile
Figure 2-8: Cell Viability
Mark Prausnitz, Ph.D., Georgia Institute of Technology provided the data for these graphs.
2-14
Cyto Pulse Sciences, Inc., P. O. Box 609, Columbia, MD 21045 USA 410-787-1890
PA-4000 User Manual Ch2: Rev.1-1/05
2.5 References
1.
Sukharev S.I., Klenchin V.A., Serov S.M., Chernomordik L.V. and Chizmadzhev Y.A.,
Electroporation, and electrophoretic DNA transfer into cells: The effect of DNA
interaction with electropores, 1992, Biophys J. 63; pp. 1320-1327
2.
Klenchin V.A., Sukharev S.M., Chernomordik L.V., Chizmadzhev Y.A., Electricaly
induced DNA uptake by cells is a fast process involving DNA electrophoresis, 1991,
Biophys J. 60; pp. 804-811
3.
Antonov P.A., Maximora V.A., Pancheva, R.P. Heat shock and osmotically independent
steps by DNA uptake after Escherichia coli electroporation. Biochim. Biophys Acta
1993 1216(2); pp. 286-288
4.
Sowers, A.E. Mechanisms of electroporation and electrofusion in Guide to Electroporation
and Electrofusion Editors Chang, Chassy Saunders and Sowers 1992 Academic Press;
pp.119-138
5.
Nickoloff, Jac A., ed. (1995) Electroporation Protocols for Microorganisms, Methods in
Molecular Biology, Volume 47, (Humana Press, Totowa, New Jersey); p. 372.
6.
Nickoloff, Jac A., ed. (1995) Animal Cell Electroporation and Electrofusion Protocols,
Methods in Molecular Biology, Volume 48. (Humana Press, Totowa, New Jersey); p.
369.
7.
Sowers, A.E. (1995) Permeabiliy alteration by transmembrane electric fields:
electroporation, IN: Permeability and Stability of Lipid Bilayers (E. A. Disalvo and S.A.
Simon, eds.), CRC Press, Boca Raton; pp. 105-121.
8.
Chang, D.C., Chassy, B.M., Saunders, J.A. and Sowers, A.E., eds. (1992) Guide to
Electroporation and Electrofusion, (Academic press, San Diego); p. 581
9.
Dimitrov, D.S., and Sowers, A.E., (1990) Membrane electroporation - fast molecular
exchange by electroosmosis. Biochimica et Biophysica Acta 1022; pp. 381-392.
10. Neuman, E., Sowers, A.E., and Jordan, C.A.., eds. (1989) Electroporation and
Electrofusion in Cell Biology, (Plenum Press, New York) pp. 581.
Cyto Pulse Sciences, Inc., P. O. Box 609, Columbia, MD 21045 USA 410-787-1890
2-15
PA-4000 User Manual Ch2: Rev.1-1/05
Blank Page
2-16
Cyto Pulse Sciences, Inc., P. O. Box 609, Columbia, MD 21045 USA 410-787-1890
PA-4000 User Manual Ch3: Rev.1-1/05
3. Operational Concepts
This chapter describes some important concepts with respect to the proper and safe use
of the PA-4000 electroporation system.
3.1 Important Concepts
There are seven important concepts with which the user needs to be familiar in order to
be able to properly use and interpret the readings provided by the PA-4000 electroporator.
3.1.1
•
Load Resistance and Conductance
•
Power Supply Voltage Monitor
•
Relationship between Power Supply Voltage and Pulse Amplitude
•
Changing Pulse Amplitude from pulse to pulse
•
Pre-Pulse Load Estimator
•
Pulse Droop
•
Aqueous Solution Heating
Load Resistance and Conductance
The tutorials in Chapter 2 explained that applying a voltage across a cuvette produces
an electric field. As a result of this electric field, current (electrons) will flow through the material
contained between the plates of the cuvette. The material is said to be presenting an electrical
load on the system and will resist the flow of current to one extent or another. From physics,
Ohms Law says this resistance is related to voltage and current by:
resistance =
voltage
= ohms
current ( amperes )
If the material is very ionic, such as Phosphate Buffered Saline (PBS), it will be very
conductive, i.e., it will have a low resistance. If the material is tissue, it will be less conductive
than the PBS, i.e., it will have a higher resistance and less current will flow. Inversely,
conductance is given by:
conductanc e =
1
= siemens
ohms
The PA-4000 will estimate resistance/conductance and present both in the log report
generated after each protocol run. The number printed in the log is the estimate before the
protocol is run. Since the resistance of ionic solutions such as PBS is very sensitive to
temperature, the resistance will change (decrease) after each pulse due to heating. The
resistance estimate circuit operates between 10 ohms and 100 ohms. Below 10 ohms the
system will display a message “Output Shorted” and the high voltage will not be enabled.
Above 100 ohms the reading will be >100 ohms.
An example log report is given in Figure 3-1. Shown in the log is a PulseAgile protocol
in which each succeeding pulse is twice the width and half the amplitude. The resistance and
conductance estimates made before the protocol was run are shown at the bottom of the log.
Cyto Pulse Sciences, Inc. P. O. Box 609, Columbia, MD 21045 USA 410-787-1890
3-1
PA-4000 User Manual Ch3: Rev.1-1/05
Protocol File: EXP-HI.PRO
12-3-2004-6 18:21:25
Mode: Electroporation
>GRP
>1
NUM
1
WIDTH
0.020
INTVL
1.000
SetV
1000
MonV
995
>GRP
>2
NUM
1
WIDTH
0.040
INTVL
1.000
SetV
500
MonV
510
>GRP
>3
NUM
1
WIDTH
0.080
INTVL
1.000
SetV
250
MonV
255
>>GRP NUM
>4
1
WIDTH
0.0160
INTVL
1.000
SetV
125
MonV
130
>Estimated load = 19 ohms
>Estimated conductance = 0.053 siemens
$
Figure3-1: Log Report Example
3.1.2
Power Supply Voltage Setting and Voltage Monitor
There are two different power supply voltage numbers that appear in the log report
shown in Figure 3-1. The first is the voltage set by the user using the PulseAgile® interface
software, and is shown in the column labeled SetV. This voltage setting is converted to digital
words that the internal microprocessor uses to program the output voltage of the power supply.
The conversion is done in discrete levels, or counts, depending on the voltage range in use:
High Range
Low Range
5 to 1100 volts
4 to 400 volts
5 volts resolution
2 volts resolution
There are errors in these conversions and the final power supply voltage will be set to
within ±5% or ± two counts, whichever is greater.
The second power supply voltage number is the value measured by an internal voltage
monitor circuit at the internal reservoir capacitor. This measurement is also converted into
digital counts and is presented in the log report in the column labeled MonV. Therefore, the
user can see the intended Power Supply Voltage, SetV; and the measured actual Power Supply
Voltage, MonV. The measurements of the actual voltage and the digitizing processes used also
have errors that are on the order of ±5% or ± two counts, whichever is greater.
3.1.3
Relationship Between Power Supply Voltage and Pulse Amplitude
When the user sets a power supply voltage in the PulseAgile® Interface software, that
voltage will not be the voltage of the pulse that will appear across the material being treated
(cuvette, tissue, etc.). The actual pulse amplitude can be estimated if the value of the “load”
(aqueous solution or tissue) resistance is known. The circuit diagram in Figure 3-2 gives the
reason for the difference.
3-2
Cyto Pulse Sciences, Inc. P. O. Box 609, Columbia, MD 21045 410-787-1890
PA-4000 User Manual Ch3: Rev.1-1/05
High Voltage Switch
Rsource
Internal
SetV
Power
Supply
HV
Capacitor
Pulse Amplitude
at cuvette
MonV
Rload
Aqueous
Solution
in Cuvette
Figure 3-2: Power Supply Voltage and Pulse Amplitude Relationship
As shown, when the switch is closed, the full Power Supply voltage actually appears
across two resistances, that inside the box and that outside the box (i.e., aqueous solution in
cuvette or tissue). The resistance inside the box, called source resistance Rsource, is the inherent
resistance in the high voltage switch and an additional resistance included to prevent excessive
current from flowing if the output is inadvertently shorted. The magnitude of the source
resistance is usually a few ohms. Again, from Ohms Law:
Total Current =
Power Supply voltage
= Amps
R source + R load
From this relationship, the voltage that appears across the load is always less than the
power supply voltage. If the power supply is set (SetV) to 400 volts, the high voltage capacitor
is charged to 400 volts. If R source is 2 ohms and R load is 18 ohms, then the total current flowing
from the high voltage capacitor through both resistances is 20 Amps.
The Pulse Amplitude is given by:
Pulse Amplitude (volts )=Total Current ∗R load
In the example above, the pulse amplitude is 380 volts, or 95% of SetV. Another derived
equation to calculate pulse amplitude is:
Pulse Amplitude = Power Supply Voltage ( SetV ) =
Rload
Rload + Rsource
Thus the voltage is divided between the source resistance and load resistance. As the
load resistance goes to zero so does the pulse amplitude voltage. Figure 3-3 shows the typical
power supply voltage vs. pulse amplitude relationship as a function of R load. If the load
resistance is larger than 100 ohms than the difference between the power supply voltage and
pulse amplitude voltage is less than 2%.
Cyto Pulse Sciences, Inc. P. O. Box 609, Columbia, MD 21045 USA 410-787-1890
3-3
PA-4000 User Manual Ch3: Rev.1-1/05
Pulse Amplitude/Power Supply Voltage
1.000
0.980
0.960
0.940
0.920
0.900
0.880
0.860
0.840
0.820
0.800
10
100
1000
Load Resistance, ohms
Figure 3-3: Typical Relationship between Power Supply and Pulse Amplitude
3.1.4
Changing Pulse Amplitude from Pulse-to-Pulse
One of the features of the PA-4000 is the ability to change the pulse amplitude up or
down from one pulse to the next. This ability is one element of PulseAgile® electroporation.
It is important to note that
there are limits to how fast a voltage change
from pulse-to-pulse may be made.
3.1.4.1 Decreasing Voltage from One Pulse to the Next
To produce a pulse of one voltage followed by one of a lower voltage, the reservoir
capacitor voltage must first be decreased, i.e., partially discharged. This voltage change takes
time to occur, and that time is related to the magnitude of the desired change. The graph in
Figure 3-4 shows the minimum waiting time between pulses, or Pulse Interval for this change to
take place. In High Range, 125 ms is the minimum Pulse Interval for all changes.
3.1.4.2 Increasing Voltage from One Pulse to the Next
To produce a pulse of one voltage followed by one of a higher voltage, the reservoir
capacitor voltage must first be increased, i.e., additionally charged. This voltage change takes
time to occur, and that time is related to the magnitude of the desired change. The graph in
Figure 3-5 gives the required time between pulses necessary in order for the pulse amplitude to
be increased from one pulse to the next.
3-4
Cyto Pulse Sciences, Inc. P. O. Box 609, Columbia, MD 21045 410-787-1890
PA-4000 User Manual Ch3: Rev.1-1/05
Minimum Pulse Interval - milliseconds
300.0
Low Range 4 to 400 volts
Minimum Pulse Interval
200.0
Minimum PA-4000 Pulse Interval
High Range 5 to 1100 volts
Minimum Pulse Interval
100.0
0.0
0.01
0.1
1
Vnext pulse .
V current pulse
Figure 3-4: Minimum Pulse Interval for Decreasing Voltage between Pulses
Minimum Pulse Interval - seconds
6.00
Low Range 4 to 400 volts
Minimum Pulse Interval
5.00
4.00
High Range 5 to 1100 volts
Minimum Pulse Interval
3.00
2.00
1.00
0.00
0
200
400
600
800
1000
1200
Voltage Change = Vnext pulse - Vcurrent pulse
Figure 3-5: Minimum Pulse Interval for Increasing Voltage between Pulses
Cyto Pulse Sciences, Inc. P. O. Box 609, Columbia, MD 21045 USA 410-787-1890
3-5
PA-4000 User Manual Ch3: Rev.1-1/05
3.1.5
Pre-Pulse Load Estimator
The load is what the pulse voltage “sees” and it is a function of the material being
electroporated. In a cuvette, this is a function of the cuvette plate spacing, the cuvette plate
area and the conductivity of the aqueous solution. In tissue, it is a function of the electrode
spacing and the conductivity of the tissue. The user may not know these. In order to estimate
the load so an estimate of pulse amplitude can be provided, the PA-4000 uses a pre-pulse
generated by the computer before the high voltage is turned on and the protocol is started. This
pre pulse is 2.2 µs in duration and 2 volts in amplitude. The pulse is placed across the
electrodes and the resulting current measured. Since the voltage is known, the resistance is
calculated. This is done by the microprocessor and presented at the bottom of log report, as a
resistance in ohms and a conductance in siemens, see Figure 3-1.
The pre-pulse data is also used by the microprocessor to detect an output short or
excessive conductivity of the ionic solution. If the load estimate is less than 10 ohms the high
voltage will not be enabled and an “Output Shorted” message will appear.
3.1.6
Pulse Droop
As explained in Section 2.2.3, rectangular wave electroporators also use storage or
reservoir capacitors. When the high voltage is turned on this capacitor is charged to an initial
voltage by the internal power supply. A pulse is generated when the capacitor is momentarily
connected to the load and electrons in the capacitor are drained off like water running out of a
reservoir. After a set time, the pulse width, the capacitor is disconnected from the load. Long
pulses allow more electrons to run out and the voltage decreases (reservoir level drops) just as
in an exponential discharge pulser. In rectangular wave electroporators the maximum pulse
width is usually defined at the point that the pulse voltage at the end of the pulse is 95% of the
initial voltage level. This voltage drop is called droop and is determined by the size of the
internal reservoir capacitor and the load resistance. Droop is calculated by:
Droop (%) =
pulse width (sec onds )
C ∗ R load
When using highly ionic loads, the electrons are depleted faster. Caution is required is setting
pulse widths in these situations.
Typical pulse widths yielding 5% droop or less in the PA-4000 are:
3-6
Load
ohms
10
Low Range
4 to 400 volts
High Range
5 to 1100 volts
420 µs
150 µs
20
300 µs
40
840 µs
1.68 ms
100
400
4.20 ms
20.0 ms
600 µs
1.50 ms
6.00 ms
Cyto Pulse Sciences, Inc. P. O. Box 609, Columbia, MD 21045 410-787-1890
PA-4000 User Manual Ch3: Rev.1-1/05
3.1.7
Aqueous Solution Heating
Heating in the material being treated is a very important consideration. The material is
heated by energy from the pulses. Energy is a function of many variables. Energy in a single
pulse is given by:
[ Pulse Amplitude ] 2
Energy in one pulse =
∗Pulse Width
Resistance of material
watt-seconds or joules
The total energy in the pulse sequence used (protocol) is the sum of the energy in all of
the pulses. For rectangular wave pulses, the temperature increase in the material being treated
is (Neumann, Sowers, Jordan, p66):
Temperature Increase =
Energy in all Pulses
c p ∗s∗ν
o
K
where:
cp = specific heat , joule/gm K, approximately 4.186
s = specific mass, gm/cm3 , approximately 1
ν = volume, cm3
For example, the resistance of 100 µl of PBS in a 2 mm cuvette is:
Resistance = ρ ∗
[ spacing ]2
[0.2 cm ]2
= 60 Ω − cm ∗
= 24 Ω
volume
100 µl ∗ 0.001 cm 3 / µl
For two pulses, with amplitude 1000 volts, and widths 100 µs,
Total Energy = 2 ∗
1000 2
* 10 − 4 sec = 8.3 joules
32
and,
Temperatur e Increase =
6.3 joules
= 20 0 K
3
3
4.186 j / gm K ∗1 gm / cm ∗100 µl∗0.001cm / µl
NOTE:
The most effective method of monitoring temperature increases during the pulse is to
use an oscilloscope to monitor the pulse current. The pulse current should be constant
over a pulse. If the pulse current is increasing during the pulse, then the material being
treated is increasing in temperature during the pulse.
Cyto Pulse Sciences, Inc. P. O. Box 609, Columbia, MD 21045 USA 410-787-1890
3-7
PA-4000 User Manual Ch3: Rev.1-1/05
3.2 Safety Features
There are many safety features designed into the equipment that will protect both the
user and the PA-4000. This section will describe them.
3.2.1
Cuvette Holder
The Cuvette Holder was designed to prevent accidental contact with the high voltage
pulse electrodes. The electrodes can only apply voltage to the cuvettes when the handle is
pushed all the way in.
3.2.2
Cuvette Holder Interlock
If the Cuvette Holder handle is withdrawn from the plastic shield, an interlock is tripped
and the high voltage cannot be enabled. A red Light Emitting Diode (LED) will illuminate on the
front panel and Open will appear in the Electrode Holder status window. The interlock is
provided by a second cable that must be connected for the system to fully operate.
3.2.3
Short-Circuit Detection
As described in Section 3.1.5, a load estimator circuit is used to determine the
approximate resistance of the test sample before the high voltage is turned on. If the value of
resistance is too low (below 10 ohms), the PA-4000 software will display a message “Output
Shorted” and will not turn on the high voltage or run the protocol. If this happens, there is a
problem with the conductivity of the cuvette solution. This problem will need to be fixed before
the system will operate fully.
3.2.4
Over Peak-Current Limit Sensor
The peak current sensor is used to detect excessive load current during a pulse. If such
a condition is detected, the unit will shut down within a few microseconds and a red LED on the
front panel called External Fault will be illuminated. There are generally two causes of
excessive load current:
• Arc in the Cuvette during a pulse: If this fault occurs, the cuvette or chamber
must be examined to see what caused the fault and the situation corrected.
• Over-heating the aqueous solution in the cuvette: This type of fault will occur
if an ionic buffer such as PBS is used and/or the user sets the pulse repetition
rate too high. Each pulse heats up the solution. Heat decreases the resistance
of the solution. Eventually, the resistance becomes so low that excessive current
will flow. In some cases, the temperature increase can be so large that the
aqueous solution in the cuvette boils. Creating excessive heat must be avoided.
Cell lysis will occur long before the temperature reaches the boiling point. In a
1mm or 2mm cuvette, this can happen in a few pulses at high voltage.
3.2.5
Over Average-Current Limit Sensor
The average current sensor is used to detect excessive charging and discharging of the
reservoir capacitor during complex protocol runs. PulseAgile® capability permits an infinite
number of waveform combinations, so it is not possible to describe each condition that will
trigger this fault circuit. In general, protocols with a large number of repetitive pulses of very
wide pulse widths and short pulse intervals can trigger this fault. In such cases, it is likely that
substantial heating of the test sample would take place, further enhancing the current draw and
probably doing harm to the cells under treatment.
3-8
Cyto Pulse Sciences, Inc. P. O. Box 609, Columbia, MD 21045 410-787-1890
PA-4000 User Manual Ch3: Rev.1-1/05
3.2.6
Microprocessor Protection
A microprocessor is used in the PA-4000 to control system operation and safety. As a
result there are a number of protection and sensing circuits used to monitor the microprocessor
operation to insure it is operating correctly. The sensing circuits monitor proper power supply
voltage, proper cycle execution, and adverse effects of sever line transients, which could effect
logic operation. If any of these conditions are detected an UNIDENTIFIED FAULT window will
appear in the operator interface. To clear the fault, the system must be reset by clicking OK in
the operator window. In some cases, pushing the red Stop/Reset button on the front panel is
required.
3.3 Pulse Voltage and Current Monitors
All Cyto Pulse waveform generators have built-in monitors to safely view replicas of the
pulse amplitude and pulse current waveforms. This permits the monitoring of these values for
critical applications. This method is the only precise way of determining the delivered pulse
characteristics, including load resistance and aqueous solution heating. A digital oscilloscope
and cable kit may be ordered from Cyto Pulse for this purpose. It consists of three 50-ohm
coaxial cables with three 50-ohm terminations.
The scale factors of the pulse monitors are:
Pulse Amplitude = (Pulse Voltage Monitor voltage) x 200, into 50 ohms
Pulse Current = (Pulse Current Monitor voltage) x 20, into 50 ohms
For example, a 1000-volt pulse will produce a 5-volt replica at the connector. A 100-amp
pulse current will produce a 5-volt replica of the current pulse. An oscilloscope must be
connected to the monitor ports on the back of the unit for viewing. A complete description of the
monitor circuits is given in Appendix B.
Cyto Pulse Sciences, Inc. P. O. Box 609, Columbia, MD 21045 USA 410-787-1890
3-9
PA-4000 User Manual Ch3: Rev.1-1/05
Blank Page
3-10
Cyto Pulse Sciences, Inc. P. O. Box 609, Columbia, MD 21045 410-787-1890
PA-4000 User Manual Ch4: Rev.1-1/05
4. Set Up
! NOTE: THERE ARE SEVERAL IMPORTANT SAFETY AND OPERATIONAL CONCEPTS
DESCRIBED IN CHAPTER 3. FOR YOUR SAFETY AND PROPER OPERATION OF THE
PA-4000, CHAPTER 3 MUST BE READ FIRST !
4.1
Introduction
It is recommended to first setup only the basic system consisting of the PA-4000, a
computer, and the cuvette holder. Test this configuration before connecting any optional
equipment that may have been purchased. The connections and set-up for using the optional
equipment (PA-96W, PA-101, PA-201, and PA-301) are described in their respective User
Manuals. If you purchased the Laptop Option, the PulseAgile® software was installed at the
factory.
! DO NOT PLUG IN THE LINE/MAINS CORD UNTIL ALL OF THE SET-UP PROCEDURES
DESCRIBED BELOW HAVE BEEN COMPLETED !
4.2
PA-4000 Pulse Generator
4.2.1
Front Panel Features
Place the PA-4000 Pulse Generator on a tabletop. There are no connections to be
made to the pulse generator front panel shown in Figure 4-1. The three functions on the front
panel are the Line/Mains Power switch, the system Stop/Reset button and the indicator lightemitting-diodes (LEDs), that display the equipment status.
Fault LEDs
Status LEDs
Power Switch
Reset Button
Figure 4-1: PA-4000 Front Panel Features
Cyto Pulse Sciences, Inc. P. O. Box 609, Columbia, MD 21045, Voice: 410-787-1890
4-1
PA-4000 User Manual Ch4: Rev.1-1/05
4.2.2
Back Panel Connections
Line/Mains Power Cord - The line/mains cord supplied with a grounded IEC connector
must be plugged into the back of the unit. Figure 4-2, Detail 1 shows the location.
! DO NOT CONNECT THE OTHER END OF THE LINE/MAINS CORD INTO THE WALL
UNTIL ALL INSTALLATION STEPS ARE COMPLETE !
Serial Cable - the supplied serial cable must be connected between the D-Subminiature
9-position (DB9) connector on the back of the unit and a computer. This is the communication
link between the microprocessor in the PA-4000 and the computer. This is a standard RS-232
serial communication interface. See Figure 4-2, Detail 2.
Cuvette Interlock Cable - The interlock cable with the RCA-type phono jack from the
Cuvette Holder must be connected to the jack labeled Cuvette Interlock at the top of the back
panel. See Figure 4-2, Detail 3.
High Voltage Cable - the high voltage coaxial cable from the cuvette holder must be
plugged into the Pulse Out MHV jack. There is only one such jack on the back panel. See
Figure 4-2, Detail 4. The MHV connector is similar to the low voltage BNC connector, however:
! DO NOT ATTEMPT TO FORCE
A BNC PLUG ONTO THE MHV JACK.
BOTH CONNECTORS CAN BE DAMAGED,
VOIDING THE PA-4000 WARRANTY !
Ground Stud - It is good practice to ground electronic equipment. A wire from the
ground stud on the back panel connected to any good earth ground, such as a metal water pipe,
is satisfactory. See Figure 4-2, Detail 4.
Pulse Voltage Monitor (Optional) - this BNC jack is available for the user who wishes to
observe/measure the pulse amplitude using an oscilloscope. (Figure 4-2, Detail 4) Connection
to this jack is not required. A 50-ohm termination at the oscilloscope is required. A 50-ohm
cable with terminations may be ordered from Cyto Pulse.
Pulse Current Monitor (Optional) - this BNC jack is available for the user who wishes to
observe/measure the pulse current using an oscilloscope. (Figure 4-2, Detail 4) Connection to
this jack is not required. A 50-ohm termination at the oscilloscope is required. A 50-ohm cable
with terminations may be ordered from Cyto Pulse.
Pulse Trigger Out (Optional) - this BNC jack is available for the researcher who wishes
to observe/measure the pulse signals using an oscilloscope. (Figure 4-2, Detail 3) It is
connected to an oscilloscope trigger input. The trigger signal precedes the pulse amplitude or
current signals by a few hundred nanoseconds. Connection to the trigger connector is not
required. A 50-ohm cable and termination at the oscilloscope should be used.
Hardware Option Interface - this is the D-Subminiature 25-position (DB25) connector
located at the top left of the back panel. (Figure 4-2, Detail 2) It is the control line over which
the PA-4000’s internal microprocessor commands the optional equipment. A shielded DB25
cable is supplied with the optional equipment. This connector is the same type as that used for
computer parallel interfaces. However,
! DO NOT USE THIS CONNECTOR TO CONNECT TO
A COMPUTER PARALLEL PORT OR TO A PRINTER.
DAMAGE TO BOTH PIECES OF EQUIPMENT MAY OCCUR,
VOIDING THE PA-4000 WARRANTY !
4-2
Cyto Pulse Sciences, Inc. P. O. Box 609, Columbia, MD 21045, Voice: 410-787-1890
PA-4000 User Manual Ch4: Rev.1-1/05
PA-4000 Back Panel
Detail 3
Detail 2
Detail 4
Detail 1
Detail 1. Line Power
Fuse Holder
Use 2A/240VAC
Slo-Blo
Plug Line/Mains Cord here
100-240 VAC, 50/60 Hz
Power Outlet for
Cyto Pulse Optional
Equipment that
require Line/Mains
Power
FOR USE WITH
CYTO PULSE
EQUIPMENT
ONLY!
Detail 2. Interface
Connection for
Cyto Pulse
Sciences Options
ONLY
Connect Serial
Cable from
Computer here
! No Printer or
Parallel Port
Connection !
Figure 4-2: PA-4000 Back Panel Features
Cyto Pulse Sciences, Inc. P. O. Box 609, Columbia, MD 21045, Voice: 410-787-1890
4-3
PA-4000 User Manual Ch4: Rev.1-1/05
Detail 3. Cuvette Interlock, Pulse Trigger Out
Phono-Jack
Connector
BNC Connector
Connect optional
oscilloscope
trigger cable here
Connect Cuvette
Interlock Cable
here
Serial Number
Label
Detail 4. HV Out, Monitors, and System Ground
High Voltage Connectors
Use Banana Jacks
OR
MHV Jack
! Never use both at once !
! Never try to force a BNC
onto the MHV jack !
System Ground Stud
10-32 bolt
Pulse Current Monitor
Pulse Voltage Monitor
1V = 20 Amps
1V = 200 Volts
Figure 4-2 (cont’d): PA-4000 Back Panel Features
4-4
Cyto Pulse Sciences, Inc. P. O. Box 609, Columbia, MD 21045, Voice: 410-787-1890
PA-4000 User Manual Ch4: Rev.1-1/05
4.3
The CE-20 Cuvette Holder
The CE-20 cuvette holder will accept industry-standard cuvettes. The holder has two
cable assemblies; one for the pulsed high voltage connection and one for a safety interlock.
The larger diameter cable must be plugged into the Pulse Out MHV jack on the back panel of
the PA-4000. This connector is the only one that will accept the high voltage cable. The safety
interlock cable must be plugged into the RCA-type phono jack labeled Cuvette Interlock on the
back panel of the PA-4000. The interlock must be satisfied, for the system to properly operate.
PLACE AN EMPTY 4 MM CUVETTE IN THE CUVETTE HOLDER
AND SLIDE THE HANDLE FORWARD UNTIL IT STOPS
DO NOT CLOSE THE HANDLE WITHOUT A CUVETTE INSTALLED
4.4
Computers
Place a computer next to the PA-4000. Ideally, the computer will be equipped with an
RS-232 serial port with a DB9 connector. Connect the serial cable provided with the system
between the serial ports on the PA-4000 and the computer.
If only USB ports are available on the computer, then a USB-to-Serial converter will be
necessary. These converters are widely available; however they are not available from Cyto
Pulse. (Cyto Pulse Sciences makes no claim that the use of any USB-to-Serial converter is
100% applicable to the functionality of a PA-4000 Electroporation system. The use of a RS-232
serial interface is recommended). Use the manufacturer’s instructions to install the converter
first, then connect the serial cable between the PA-4000 and the converter and proceed.
4.5
PulseAgile® Interface Software Installation
The PulseAgile® PA-4000 interface software must be run under Windows® 95 or higher
(32 bit). If the software needs to be installed, use the following procedure:
1. Close all other programs and insert the CD-ROM.
2. Click Start from the Windows® lower menu bar.
3. Select "Run...", which will display a dialog box.
4. Type "{CDRomDriveDesignation}:\setup", then click “OK”.
5. The setup program will begin; follow the instructions from this point.
4.6
System Test
The following is a test of the basic system (PA-4000 system with no optional equipment
attached) using a preprogrammed protocol located in the default /protocol folder. A more
detailed explanation of the use of the PulseAgile® software is covered in Chapter 5.
First:
•
Plug in the Line/Mains cord for the PA-4000.
•
Turn on the Line/Mains power for the PA-4000.
What should happen…
The green Power LED on the front panel will illuminate followed by the green HV Off
LED. This delay is due to system checks performed by the PA-4000’s internal microprocessor.
If the CE-20 handle has not been fully pushed-in, the red Cuvette Open LED will be illuminated.
If so, slide it forward to engage the interlock, and then the red Cuvette Open LED will turn off.
Cyto Pulse Sciences, Inc. P. O. Box 609, Columbia, MD 21045, Voice: 410-787-1890
4-5
PA-4000 User Manual Ch4: Rev.1-1/05
Then:
•
Start the PulseAgile® PA-4000 Interface software.
What should happen…
The screen should appear like that as shown in Figure 4-3. The CommLink window
should show OK. This display indicates that the computer is communicating with the internal
microprocessor of the PA-4000. Additionally, the Electrode Holder window should display OK,
the High Voltage window should display OFF, and the Status window should say Ready. The
Power Supply Voltage window will display 5 volts.
Troubleshooting tip:
If ERROR appears in the CommLink window, then click Settings>Communications… on
the upper toolbar. Click Test in the Comms Test area. If TEST OK does not appear in the box,
then try choosing another COM port in the Port Selection area and repeating the test. If
communication can’t be established, then turn off the PA-4000 and check the serial cable
connection to both the PA-4000 and the computer (or USB-to-Serial adapter, if applicable).
Once communication is established, the test may proceed.
Then:
•
Click on the file folder icon on the left side of the screen
•
Open the protocol file called PA-4000Test.pro.
•
Click Turn HV ON
What should happen…
The protocol settings are downloaded to the PA-4000’s internal microprocessor. The
red Pulse LED will flash once, indicating that the low voltage load estimator pulse has been sent
to the cuvette holder. Soon thereafter the red HV On LED will turn on, and the High Voltage
window should display On. Then the red Off Zero LED will illuminate. The high voltage power
supply is now enabled and the reservoir capacitor is being charged. After approximately seven
seconds the START button is enabled. The Power Supply Voltage window will display 50 volts
and the Load Ohmmeter window will display 100 Ohms.
Then:
•
Click START
What should happen…
The PA-4000 runs the protocol. A protocol log as shown in Figure 4-4 should appear in
the Last Protocol Log window. Again, a more detailed description of the software features
follows in Chapter 5.
This completes the set-up and testing of the basic PA-4000 system.
If there is a problem, contact the factory for assistance.
Phone: 410.787.1890
Internet: www.cytopulse.com
4-6
Cyto Pulse Sciences, Inc. P. O. Box 609, Columbia, MD 21045, Voice: 410-787-1890
PA-4000 User Manual Ch4: Rev.1-1/05
Figure 4-3: PulseAgile® Opening Screen showing current system status
Protocol File: PA-4000TEST.PRO
12-14-2004-3 15:51:24
Mode: Electroporation
>GRP
>1
NUM
1
WIDTH
0.020
INTVL
0.50
SetV
50
MonV
50
>Estimated load > 999 ohms
>Estimated conductance < 0.001 siemens
$
Figure 4-4: PA-4000Test.pro Protocol Log
Cyto Pulse Sciences, Inc. P. O. Box 609, Columbia, MD 21045, Voice: 410-787-1890
4-7
PA-4000 User Manual Ch4: Rev.1-1/05
4.7
Oscilloscope Installation (Optional)
This installation procedure is for the digital oscilloscope option ordered from Cyto Pulse.
The scope-package ordered from Cyto Pulse is composed of a 2-channel Tektronix® digital
storage oscilloscope and a set of three coaxial cables with 50-ohm terminations.
1. Place the scope on top of or beside the PA-4000.
2. Connect one coaxial cable from Ch1 of the scope to the Pulse Voltage Monitor BNC
jack; located at the bottom-center of the back panel of the PA-4000.
3. Connect one coaxial cable from Ch2 of the scope to the Pulse Current Monitor BNC
jack; bottom-left of the back panel of the PA-4000.
4. Connect one coaxial cable from EXT Trigger of the scope to the Pulse Trigger Out
BNC connector located at the top-right of the back panel of the PA-4000.
5. Connect the scope line/mains cord and turn power on.
6. Set-up the scope as follows (refer to the scope manual for assistance):
Push Ch1 Menu, set:
•
Coupling
DC
•
BW Limit
Off
•
Volt/Div
•
Probe
•
Volts/DIV knob 2.00V
•
Vertical Position0.00 div (using the position knob)
Coarse
1X
Push Ch2 Menu, set:
•
Coupling
DC
•
BW Limit
Off
•
Volt/Div
•
Probe
1X
•
Volts/Div
2.00V
•
Vertical Position4.00 div (using the position knob)
•
Sec/Div
Coarse
25 µs
Push Trigger menu, set:
4-8
•
Edge
•
Slope
Rising
•
Source
Ext
•
Mode
Normal
•
Coupling
DC
•
Level
1.00V
Cyto Pulse Sciences, Inc. P. O. Box 609, Columbia, MD 21045, Voice: 410-787-1890
PA-4000 User Manual Ch5: rev.1-1/05
5. Software Operation
5.1
Introduction
This chapter will describe the various PulseAgile® interface software features and
functions. The software conforms to standard Windows® conventions and this manual assumes
that the user is familiar with Microsoft Windows® 95 or later.
The software performs the following functions:
•
Select operating mode
Electroporation
Electroporation with dielectrophoresis (electrofusion)
Electroporation with programmable pulse switch
•
Setting up Protocols
•
Running Protocols
•
File Management to save and recall protocols
•
Data Log Display, printing and saving
•
Status Display
The following sections describe operation based on the above bullets.
Some things to remember:
•
There are three operating modes: Electroporation, Electrofusion and
Programmable Pulse Switch.
•
Electrofusion mode may only be selected when a PA-101 is connected to the
interface on the back panel.
•
Programmable Pulse Switch mode may only be selected when a PA-201 or a
PA-96W is connected to the interface on the back panel.
•
If an item is grayed out, it cannot be accessed. Either it is an option that is not
installed or not available in the current mode.
•
Some commonly used functions have redundant control features, i.e. they can
be accessed from several places on the screen.
•
The default installation directory is C:\Program Files\Pagile. It will be different if
you have selected another directory during installation.
•
The screen is divided into four areas within the main window. The Title Bar and
pulldown menus (top), the Tool buttons (left), the Control Panel for each
operating mode (center), and the Status area (right), see Figure 5-1.
•
When the cuvette holder is open, The Electrode Holder window will display
OPEN. As a safety feature, the high voltage power supply cannot be enabled
and protocols cannot be run while the cuvette holder is open. However,
protocols can be programmed and saved in this state.
Cyto Pulse Sciences, Inc. P. O. Box 609, Columbia, MD 21045, Voice: 410-787-1890
5-1
PA-4000 User Manual Ch5: rev.1-1/05
5.2
The PulseAgile® PA-4000 Interface Software
Start the PulseAgile® Interface software. A screen will appear that shows standard
Windows® -type pull-down menus at the top, a Tools area on the left, and a Status area on the
right (shown in Figure 4-3). Now click the button labeled Electroporation, which will add the
Control Panel area and the Last Protocol Log window to the center of the display. The screen
should now appear as shown in Figure 5-1.
Figure 5-1: PulseAgile® Interface Electroporation Mode Screen
5.2.1
The Toolbar
Across the top-left of the main window is a list of standard Windows® pull-down menus.
5.2.1.1 File Pull-down Menu
5-2
•
Open: Opens a previously saved protocol.
•
Save: Saves the current protocol, overwriting the file if it had been previously saved.
•
Save Protocol As: Saves the current protocol. The user is prompted for a filename.
•
Log Save As: Saves the protocol Log History. The user is prompted for a filename.
•
Print Log: Prints the Last Protocol Log or the Log History (user selectable).
•
Exit: Exits the program.
Cyto Pulse Sciences, Inc. P. O. Box 609, Columbia, MD 21045 410-715-0990
PA-4000 User Manual Ch5: rev.1-1/05
5.2.1.2 Tools Pull-down Menu
•
Calculator: The Microsoft Windows® calculator
•
Session History: Opens a panel that allows the user to scroll through the Protocol
Logs that have been run during the current session.
•
Electroporation: Selects the electroporation mode.
•
Electrofusion: Selects the Electrofusion mode only if a PA-101 is connected.
•
Programmable Pulse Switch: Selects the Programmable Pulse Switch mode only if
a PA-201 or a PA-96W is connected.
•
Quick Pulse: Runs the open protocol without additional user input. Pressing F12
achieves the same result. The software activates Turn HV ON and START. May be
used to run the same protocol repeatedly. A protocol must be open for this to work.
5.2.1.3 Settings Pull-down Menu
•
Communications: This selection opens the communications dialog box. Within the
box are two functions: 1) Port selection and 2) Communication link testing.
•
Sound: This selection turns the event beeper on and off.
•
Reset Device: Resets the system (same as Reset button at top right).
5.2.1.4 Help Pull-down Menu:
•
5.2.2
About: Shows the Cyto Pulse logo, software version, and phone numbers.
Tools Area
The Tools area is found on the left side of the screen and contains a set of frequently used
function buttons. These functions can also be accessed from the Toolbar as described above.
5.2.2.1 Mode Select Buttons
•
Electroporation Button: Selects the Electroporation mode.
•
Electrofusion Button: Selects the Electrofusion mode only if a PA-101 is connected.
•
Electroporation Pro Pulse Switch Button: Selects the Programmable Pulse Switch
mode only if a PA-201 or a PA-96W is connected.
5.2.2.2 Tool Buttons
•
Folder Button: Opens a protocol
•
Disk Button: Protocol “Save As…” Saves a protocol under a user specified filename.
•
Printer Button: Prints the Last Protocol Log or the Log History (user selectable) to a
file or printer
•
Calculator Button: The Microsoft Windows® Calculator
•
Notepad Button: Saves the protocol Log History under a user specified filename.
•
Handshake Button: Communications: Opens the Communications dialog box.
•
Exit Button: Exits the program.
Cyto Pulse Sciences, Inc. P. O. Box 609, Columbia, MD 21045, Voice: 410-787-1890
5-3
PA-4000 User Manual Ch5: rev.1-1/05
5.2.3
Status Area
This area at the upper right corner of the screen displays up-to-date information about
the system conditions.
5.2.3.1 Options Connected
This section shows which optional device is connected to the PA-4000. A check is
shown in the appropriate box if a device is properly connected. Only one optional device can be
connected at a time.
5.2.3.2 System
This section shows the current PA-4000 system status. These conditions frequently
change during operation.
•
CommLink: This box displays the status of the RS-232 serial communications link.
OK:
Communications is established and functional.
ERROR:
There is a problem with the communications link.
•
Electrode Holder: This box displays whether or not the electrode holder in use is
ready to receive pulses, and the current status of the safety interlock.
OK:
The electrode holder is closed; the safety interlock is satisfied.
OPEN:
The electrode holder is open; the safety interlock is not satisfied.
•
High Voltage: Displays the state of the internal high voltage power supply (HVPS).
ON:
The power supply is on and the reservoir capacitor is charging.
OFF:
The power supply is off.
•
Status: This box shows the current functional status of the PA-4000. It displays:
Ready:
The PA-4000 is ready to accept instructions to begin a protocol.
Download…: The computer is loading protocol to the internal microprocessor.
Charging:
The system is charging the reservoir capacitor to the set voltage.
Pulsing:
The protocol is being delivered to the electrode holder.
5.2.3.3 Monitors
5-4
•
Power Supply Voltage: Displays the voltage of the reservoir capacitor, not the pulse
amplitude. This display is operational at all times except when pulses are being
delivered.
During charging:
Displays the voltage, updated every second or so.
After charging:
Displays the final voltage on the reservoir capacitor.
PA-4000 at rest:
Displays an approximate measure of the pre-pulse voltage
used by the Load Estimator function.
in Low Range:
2 volts
in High Range:
5 volts
•
Load Ohmmeter: Displays an estimate of the external load as determined by the
Load Estimator function. The estimate is displayed during the period from when the
high voltage power supply is turned on to the finish of the protocol deilvery. This
value is then listed at the end of the Protocol Log.
Cyto Pulse Sciences, Inc. P. O. Box 609, Columbia, MD 21045 410-715-0990
PA-4000 User Manual Ch5: rev.1-1/05
5.2.4
Last Protocol Log Window
The window at the bottom center of the screen is the Last Protocol Log window. The
window displays the last protocol executed. However, all protocols run during a session are
stored in memory. At any time during a session, the entire log history can be saved as a text file
using the Log Save As tool described above.
5.2.5
Electroporation Mode Control Panel Area
The Electroporation Mode Control Panel Area in the center of the screen is where the
pulse-protocol parameters are set, edited, and reviewed. The following is a description of each
of the sections, and input/display boxes found in the Control Panel.
•
Group ID: Displays the group number whose characteristics are shown in the rest of
the Control Panel Area. The Group ID is also shown highlighted in the Group List.
The Cyto Pulse Sciences concept of Pulse Groups is explained in Section 5.3.
•
Pulses: Displays the number of pulses in the active group. The number can be
changed by directly typing in the number or by using the up and down arrows shown
on the screen.
•
Pulse
Amplitude:
Displays the reservoir capacitor charge voltage level setting of the
active group. The user sets the value, within the allowed limits, by typing in the
number desired. The unit is volts.
Range: Two buttons to select High or Low, which changes the range and
resolution of the reservoir capacitor charge voltage.
Low Range allows from 4 to 400 volts in 2 volt increments.
High Range allows from 5 to 1100 volts in 5 volt increments.
Duration: Displays the pulse duration (width) setting of the active group. The
user sets the value, within the allowed limits, by typing in the number desired. The
unit is milliseconds. Since most pulse durations will likely be set in the microsecond
range, the duration will be frequently displayed in decimal values. For example, a
display of 0.020milliseconds is 20 microseconds.
•
Interval: Displays the pulse interval setting of the active group. It is the amount of
time from the beginning of one pulse to the beginning of the next pulse. The unit is
seconds. The minimum value is 0.125 seconds.
•
Group List: Displays the list of groups in the current protocol. The groups will be
executed in the order displayed. There are three buttons to control the list:
Add (or Alt-A): Used to add a group to the list.
Replace (or Alt-P): Used to change data within a group. Changes made to
values within a group will not take effect until Replace has been selected. If a pulse
parameter is changed, but not Replaced, an error dialog box will appear if the user
tries to run the protocol. The user will be prompted to replace the values first.
Remove (or Alt-M): Deletes a group. If a group is deleted, the group numbers
below the deleted group (if any) are renumbered accordingly.
Cyto Pulse Sciences, Inc. P. O. Box 609, Columbia, MD 21045, Voice: 410-787-1890
5-5
PA-4000 User Manual Ch5: rev.1-1/05
5.2.6
Running a protocol
The following function buttons are used to run the current protocol:
5.3
•
Turn HV ON (or Alt-H): After all of the electroporation parameters are set, and the
user is ready start the protocol (cuvette in place, safety interlock engaged), then click
Turn HV ON. The internal high voltage power supply (HVPS) turns on and charges
the reservoir capacitor to the level set in Group 1. After seven seconds, the Start
button is highlighted and the system is ready to deliver pulses.
•
Start (or Alt-S): Clicking Start begins delivery of the protocol to the test sample. The
pulse groups are executed in sequential order. A double beep signals the end of
protocol execution, if sounds were enabled. If the Start button is not clicked within
80 seconds after turning on the HVPS, the PA-4000 system will automatically reset
itself.
•
Reset (or Alt-R): Clicking Reset stops the capacitor charging and/or the delivery of
pulses, and can be used at any time.
•
F12: Pushing F12 on the keyboard is the same as clicking Turn HV ON followed by
Start. Please note that the reservoir capacitor takes time to charge, so there will be
delay of approximately seven seconds before pulsing starts. A double beep signals
the end of protocol, if sounds were enabled.
Using the PulseAgile® Interface Software
This section will provide instruction regarding the conventions used to create
Cyto Pulse PulseAgile® protocols, the setting up of a basic electroporation protocol, and the
data logging and file management features.
5.3.1
PulseAgile® Protocol Conventions, the Pulse Group
PulseAgile® electroporation allows pulse-to-pulse changes of parameters such as
amplitude, duration and interval. In order to achieve this capability, Cyto Pulse introduces the
concept of the Pulse Group. A Pulse Group is a set of pulses (1 to 99 in number) of the same
amplitude, duration (a.k.a. pulse width), and interval. Figure 5-2 is a graphical representation of
the concept. Additionally, the Pulse Group can contain other defined parameters specifically for
PPS and electrofusion modes if those optional devices are in use.
Figure 5-2: A Five-Pulse Protocol Divided into Four Groups of Pulses of Varying Parameters
5-6
Cyto Pulse Sciences, Inc. P. O. Box 609, Columbia, MD 21045 410-715-0990
PA-4000 User Manual Ch5: rev.1-1/05
5.3.2
Setup and Run a Basic Protocol
The following section is a guide to begin programming PulseAgile® electroporation
protocols. It is meant as an exercise to familiarize the user with the functions and features of
the PA-4000 system.
5.3.2.1 A Basic PulseAgile® Electroporation Protocol
As an example, the following pulse train will be programmed below and then run using
the PulseAgile® interface software.
Pulse 1
500 volts, 20 µs, wait 0.2 seconds
Pulse 2
500 volts, 20 µs, wait 0.2 seconds
Pulse 3
200 volts, 100 µs, wait 0.3 seconds
Pulse 4
200 volts, 100 µs, wait 0.3 seconds
Pulse 5
200 volts, 100 µs, end
5.3.2.2 Program the Basic Electroporation Protocol
•
Start the PulseAgile® interface software.
•
Click the Electroporation mode-select button. When the mode is first selected, there
is no protocol loaded, but default values are contained in the various input boxes.
•
Click the Add button above the Group List to begin creating the protocol. This action
adds Group1 to the list.
•
Change the following parameters:
In Pulses, type 2
In Pulse Amplitude, type 500
In Pulse Duration, type 0.020
In Interval, type 0.200
•
Click the Replace button for the changes to take effect. Group1 is now programmed.
•
Click the Add button. This action adds Group2 is now added to the list.
•
Change the following parameters:
In Pulses, type 3
In Pulse Amplitude, type 200
In Pulse Duration, type 0.100
In Interval, type 0.300
•
Click the Replace button. Group2 is now programmed.
5.3.2.3 Save the Basic Protocol
At this point the protocol can be saved to disk, if desired. Follow these steps to save:
•
Click the Floppy-Disk tool button, or click File>Protocol Save As.
•
Type a name for the file in the dialog box.
•
Click Save.
Cyto Pulse Sciences, Inc. P. O. Box 609, Columbia, MD 21045, Voice: 410-787-1890
5-7
PA-4000 User Manual Ch5: rev.1-1/05
5.3.2.4 Prepare a Test Sample and Run the Basic Protocol
Once the protocol has been setup, it can be executed.
•
First place 400 µL of PBS in a 4mm cuvette. An empty cuvette can be used as well,
but the Load Estimator result will be different than that discussed below
•
Insert the cuvette in the CE-20 Cuvette Holder slide the handle forward until it is
closed. Check the System Status box to see that Ready is displayed.
•
Click the Turn HV-ON button. A low voltage (approximately 2.5-volts) “pre-pulse” is
delivered to the cuvette. This pulse is used by the internal microprocessor to
estimate the resistance of the load (the aqueous solution in the cuvette).
Troubleshooting hint:
If the pre-pulse current detected is too high, the protocol run will cease.
An Output Shorted window will appear. Click OK to acknowledge.
The solution in the cuvette must be checked for excessive conductivity
before proceeding. If the test cuvette was prepared exactly as
described above, the conductivity should not pose a problem
•
The internal high voltage power supply will turn on if the load-current test is passed.
The system allows about seven seconds for the reservoir capacitor to charge. On
the front panel, the HV ON LED illuminates followed shortly by the Off Zero LED.
The Off Zero LED turns on at the following conditions:
In Low Range: for all voltage settings 4 – 400 Volts
In High Range: for voltage settings above 10 Volts (15 – 1100 Volts)
•
The Start button will be enabled when the reservoir capacitor is fully charged.
•
Click the Start button. The programmed pulses are delivered to the cuvette,
beginning with Group1. The Pulse LED illuminates as each pulse is delivered. The
System Status box will display Pulsing. A double beep signals the end of protocol
execution, if sounds are enabled.
Try Quick Pulse
Pressing F12 on the keyboard will perform both functions of
clicking Turn HV-ON and Start. If this option is used, remember that
there is a built-in seven second charging delay before pulses are delivered.
5-8
•
When the protocol run is complete, the high voltage power supply will be turned off
and the reservoir capacitor will be discharged. The system will return to the following
status:
The HV OFF LED will be on.
The HV ON LED will be off.
The Off Zero LED will be off.
The System Status box will display Ready.
The Turn HV On button will be highlighted.
•
At the end of protocol execution, it is a good safety practice to confirm that the HV
Off LED is illuminated to be sure that the protocol run has indeed completed before
removing the cuvette from the holder.
Cyto Pulse Sciences, Inc. P. O. Box 609, Columbia, MD 21045 410-715-0990
PA-4000 User Manual Ch5: rev.1-1/05
5.3.3
Reviewing the Last Protocol Log and Log History
The Last Protocol Log is now ready for viewing and saving. It provides a record of the
protocol that was last delivered to the test sample. A description of Last Protocol Log for this
basic example is given in Figure 5-3. A representation of the actual pulse-train is shown below
in Figure 5-4. The parameters for every pulse delivered are recorded. Note that the SetV and
MonV parameters are referring to the voltage of the HVPS and reservoir capacitor, not the pulse
amplitude. Each time the protocol is run, the Last Protocol Log is refreshed, and the previous
results are added to the Log History. The Log History is the record of the entire electroporation
Protocol Information:
Filename (if applicable)
Date: MM-DD-YY-DoW
Time: 24-Hour Clock
System Mode
Protocol File: BASICTEST.PRO
12-17-2004-6 18:51:35
Mode: Electroporation
Delivered Pulse Parameters
subdivided by Group number
where:
GRP = Pulse Group #
NUM = Pulse # in Group
WIDTH = Pulse Duration
INTVL = Time between
pulses
SetV = Set HVPS Voltage
MonV = Measured HVPS
Voltage
>GRP
>1
>1
NUM
1
2
WIDTH
0.020
0.020
INTVL
0.20
0.20
SetV
500
500
MonV
500
500
>GRP
>2
>2
>2
NUM
1
2
3
WIDTH
0.100
0.100
0.100
INTVL
0.30
0.30
0.30
SetV
200
200
200
MonV
205
205
205
Load Estimator Result
>Estimated load > 19 ohms
Calculated Conductance
>Estimated conductance < 0.053 siemens
System Message
>Normal Completion
$
Figure 5-3: The Last Protocol Log for the Basic Test Run
session that has occurred since the software was started. It can be viewed by clicking the
Show Log History button. The Log History may then be saved as a .txt file by clicking File>Log
Save As or the Notebook button. The Log may be printed to file or by a printer by selecting the
Printer button.
Figure 5-4: The Pulse-Train Delivered by the Basic Protocol
Cyto Pulse Sciences, Inc. P. O. Box 609, Columbia, MD 21045, Voice: 410-787-1890
5-9
PA-4000 User Manual Ch5: rev.1-1/05
5.3.4
File Management
File management conforms to standard Windows® conventions. The protocols are
saved to and retrieved from a folder created at the time of software installation or to any user
created folder. The file extension used for a protocol file is .pro. The software automatically
applies this extension when a protocol is saved. Log History files are saved as plain text and
are given the .txt extension.
5-10
Cyto Pulse Sciences, Inc. P. O. Box 609, Columbia, MD 21045 410-715-0990
PA-4000 User Manual Ch6: rev.1-1/05
6.
6.1
Getting Started with PulseAgile® Electroporation
Introduction
This chapter provides general guidelines to help with the building and optimizing of
electroporation protocols. Referring to published work is one way to start the electroporation
protocol optimization process. The following checklist may help:
Starting point for Electroporation Optimization
1.
What is the cell type?
2.
What is the cell diameter? (Can be estimated - See examples below.)
3.
Published pulsed-electric field. (If known. See examples below.)
4.
Published pulse width. (If known. See examples below.)
5.
Published number of pulses. (If known. See examples below.)
6.
Estimate the minimum electric field required to electroporate the cell. 1
7.
Desired transfection efficiency. (Helps define the endpoint for optimization)
8.
Desired cell viability. (Helps define the endpoint for optimization)
9.
Molecule for transfection (DNA, dye, etc.) 2
10. What is the conductivity, σ, of the medium? 3
cm
V/cm
V
siemens/cm
11. Cuvette electrode gap. (0.1, 0.2 or 0.4 cm)
cm
12. Estimate the load resistance. 4
13. Percent of voltage delivered to cuvette. (Use Figure 3-3, on page 3-4.)
Ω
%applied
14. Calculate the necessary PA-4000 pulse voltage setting. 5
V
1
Use the formula Vt = 1.5rE(cosθ), solving for E where:
=
the minimum required (threshold) voltage across the cell. Assume Vt = 1.
Vt
r
=
the radius of the cell in cm.
E
=
the strength of the applied electric field in V/cm.
θ
=
the angle between the applied field direction and the normal vector of
the membrane. Assume cosθ = 1 for an electric field normal to the membrane.
2
Optimization for DNA transfection may be different than that for other small, soluble
molecules. It is known, for instance, that additional low voltage pulses enhance DNA
transfection after the initial high voltage pulse. See Chapter 2 for a further explanation.
3
This value is important for highly conductive medium such as PBS or tissue culture medium.
If the medium is highly conductive but the actual conductivity is unknown, an approximation
can be made by using the conductivity of PBS whose ρ = 0.0333 siemens/cm.
4
Use the formula R = ρ x (cuvette gap, cm)2 ÷ (sample volume, cm3), with ρ = Ω-cm = 1/σ
5
Use the formula V = 2 x E x (cuvette gap) ÷ (%applied), with E = V/cm, and cuvette gap = cm.
Cyto Pulse Sciences, Inc. P. O. Box 609, Columbia, MD 21045, Voice: 410-787-1890
6-1
PA-4000 User Manual Ch6: rev.1-1/05
Examples of several published protocols:
Cell
diameter*
30 microns
30 microns
7 microns
40 microns
40 microns
30 microns
Cell Line
Voltage
Pulse Width
Reference
CHO
1.5 kV/cm
Zerbib, 1985
50 µs
CHO
600-1500 V/cm
Wolf, 1994
100-4000 µs
Human RBC
2-4 kV/cm
Serpersu, 1985
10 µs
3T3 fibroblasts
1.2-1.5 kV/cm
Mir, 1988
100 µs
Murine fibroblasts
1-4.2 kV/cm
Liang, 1988
40-500 µs
B lymphoblasts
1.2-1.4 kV/cm
Press, 1988
100 µs
Polymorphonuclear
50 microns
5-10 kV/cm
Hashimoto, 1989
1-5 µs
leukocytes
Yeast
5 microns
7.5-8.5 kV/cm
Bartoletti, 1989
50 µs
Fish eggs
200 microns
750 V/cm
Inoue, 1990
50 µs
* Estimated cell diameter. Actual diameter not mentioned in articles.
6.2
An Example of Protocol Optimization
Chapter 2 presented details regarding the factors that affect electroporation protocol
optimization. We will work through an example using Chinese Hamster Ovary, CHO cells.
6.2.1
Choose a Starting Pulse Voltage and Pulse Width
The most difficult initial decisions are the choices of the starting pulse amplitude and the
duration (pulse width). A method for doing this is to first calculate the minimum required applied
electric field for the cell and compare it to published work on the cell in question (or similar cell),
and confirm whether or not the published value is reasonable starting point.
6.2.1.1 Calculate the Minimum Required Electric Field
Our example cell is the CHO cell with an average diameter of 30 microns. Our goal is to
transfect the cells with a plasmid containing a gene that we have inserted.
Note 1 from the checklist gives
Vt = 1.5rE(cosθ).
Solving for electric field,
E = Vt/1.5r(cosθ)
Assume Vt=1 volt and cosθ=1,
E = 1 volt/1.5(15x10-4 cm)1
Therefore,
E = 444.4 V/cm
This is the applied electric field that would produce the threshold voltage required to
electroporate the average diameter cell at the poles nearest the electrodes. Since all of the
cells are not the same size and are not located near the electrodes, higher electric field strength
would be required to electroporate the maximum number of cells.
6.2.1.2 Compare to Published Electric Field Data
From the table above, we see that Zerbib, et al, used a rectangular wave pulse that
produced an electric field of 1500 V/cm for a period of 50 microseconds in his electrode. That
field strength is over three times the threshold value. Note that for any given cell size, there is a
6-2
Cyto Pulse Sciences, Inc. P. O. Box 609, Columbia, MD 21045 USA 410-787-1890
PA-4000 User Manual Ch6: rev.1-1/05
wide range of fields used in the published work. This variability is due, to some extent, to the
differing balance of transfection efficiency and cell viability goals of the experimenters. So it
would likely be reasonable to start with a pulsed electric field of 1500 V/cm.
6.2.1.3 Calculate the Starting Pulse Amplitude and PA-4000 Set-Voltage
The starting pulse amplitude will be influenced by two cuvette-related factors: the
electrode gap and the resistance of the electroporation medium.
For this example, assume that a standard cuvette with a gap of 2-mm and PBS (or
similar ionic medium) will be used. The following calculations determine the load resistance, the
pulse amplitude, and the PA-4000 set-voltage if the cuvette is filled to a volume of 180 µL:
From Chapter 2, the resistance of the solution is given by:
R = ρ(D/A) where
ρ = resistivity, Ω-cm (for PBS ρ = 60Ω-cm)
D = electrode gap, cm
A = contact area, cm2
Since
A = Volume/D ,
then
R = ρ(D2/Volume)
Substituting
R = (60 Ω-cm)(0.2cm)2/0.180cm3)
gives
R = 13.3 Ω
Load Resistance
The electric field desired in the cuvette is 1500 V/cm, and is given by:
E = V/D where
V = pulse amplitude, volts
So
V = E(D)
V. = (1500 V/cm)(.2cm)
V = 300 volts
Pulse Amplitude
Recall that due to the PA-4000’s internal resistance, the actual pulse voltage delivered to
a 13 Ω load is 84% of the set voltage (see Figure 3-3). So the actual set voltage needs to be:
VSet = (VPulse) /%applied
VSet = 300 V/0.84
VSet = 357 volts
PA-4000 Set Voltage
If a 4-mm cuvette were used with the same medium and filled to a volume of 400 µL
(half full), about 90% of the set voltage would be applied to the solution. So,
R = 24 Ω
4-mm Load Resistance
V = 600 volts
Pulse Amplitude
VSet = 667 volts
PA-4000 Set Voltage
Cyto Pulse Sciences, Inc. P. O. Box 609, Columbia, MD 21045, Voice: 410-787-1890
6-3
PA-4000 User Manual Ch6: rev.1-1/05
6.2.1.4 Quick Test of Starting Voltage
Next we need a method to see if our starting voltage is reasonable. Our starting values
are:
•
Cuvette chosen = 4 mm gap cuvette
•
Medium or buffer = PBS
•
Minimum Electric Field = 444 V/cm. (PA-4000 setting of 197 volts)
•
Published Electric Field = 1500 V/cm. (PA-4000 setting of 667 Volts)
•
Pulse width = 50 µs
One quick method to test the range is to do a Trypan blue dye exclusion test. This test
evaluates total cells porated, including dead cells. Choose a range of voltages to test that
includes the minimum voltage of 197 volts something above the highest published voltage (667
volts). For instance, perform single-pulse protocols using the PA-4000 set from 200-volts to
700-volts in 50-volt increments.
The assay is performed by applying a 50 µs duration pulse at a voltage within the
chosen range to the CHO cell mixture in medium. Immediately after the pulse is applied, add an
equal volume of commercial 0.4% Trypan blue dye. Incubate for 5 minutes and count clear vs.
blue cells. Draw a graph of total cells vs. blue cells. Since this test does not differentiate
between dead porated cells and living porated cells, it serves as a first approximation. The midrange voltage for the rest of our optimization studies will be a voltage that induces less than
50% blue cells. The exact value to choose will depend upon your electroporation goals. For
this example we will chose the voltage that yields 25% blue cells. At this value, we know that at
least 25% cell viability is maintained and that effective poration can be measured. For this
example, we will assume that 500-volts (not an actual measurement) yields 25% blue cells.
6.2.2
Amplitude of Low Voltage Pulses
Since our goal for this electroporation protocol is to transfect CHO cells, we will use a
two-voltage protocol since we know that it will be more efficient than a one-voltage protocol.
Low voltage pulses move DNA into cells by electrophoresis and, as far as we know, do not
porate cells. For this example, let’s choose arbitrary parameters for the low voltage pulses,
such as 200 V/cm or about 90-volts, and long durations (wide pulses) of 2 ms. Again, as an
arbitrary starting number, we will apply 6 low voltage pulses.
6.2.3
Optimization of First Pulse
Two measurements need to be made for each pulse protocol tested. One measurement
needs to be a measurement of transfection efficiency. The other measurement needs to be a
measurement of cell viability.
Since our hypothetical DNA molecule does not have an easily identified product, we will
choose a reporter molecule to determine transfection efficiency. For this we will use the Green
Fluorescent Protein reporter gene. (See the list of reporter molecules in Chapter 2). A positive
transfection is recorded if cells are fluorescent under a fluorescent microscope 24 hours after
returning to tissue culture. Alternatively, a flow cytometer can be used to measure
fluorescence. The percentage of positive cells is recorded. The concentration of DNA may
have to be optimized but we will use 10 µg/ml as a starting point.
6-4
Cyto Pulse Sciences, Inc. P. O. Box 609, Columbia, MD 21045 USA 410-787-1890
PA-4000 User Manual Ch6: rev.1-1/05
For cell viability, we will use colony-forming units. This is done by plating a dilution of
the cells onto a tissue culture plate, allowing cells to adhere for four hours and overlaying the
cells with agarose made with cell culture medium. Any of the viability tests listed in Chapter 2
will do.
Since 500 Volts is our starting point (from trypan blue experiments), we will test the first
pulses in 50-Volt increments ranging from 350 to 650-volts using a starting pulse width of 50 µs.
Since two pulses are usually better than one pulse for the high voltage pulses, we will use two
initial pulses. The first two pulses will be followed by six 90-volt pulses of 2 ms duration.
Plotting percent viability vs. transfection efficiency gives us our optimal first pulse voltage. At
this point, our optimization gives us the desired efficiency and viability.
Also at this point, a factorial analysis would be useful if the first optimization did not yield
the desired results. A 24 factorial analysis would allow simultaneous examination of voltage and
pulse width of the two groups.
There are many paths to protocol optimization and this was one example.
6.3
References
1.
Zerbib, D., Amalrick, F., Teissie, J. (1985) Electric-field mediated
transformation: Isolation and characterization of a TK+ subclone. Biochem. Biophys. Res.
Commun. 129;611
2.
Bartoletti, D.C., Harrison, G.I., and Weaver, J.C. (1989) The number of
molecules taken up by electroporated cells: quantitative determination. FEBS Letters 256: 4-10
3.
Wolf, H., Rols, M.P., Boldt, E., Neumann, E., Tiessie, J. (1994) Control by
pulse parameters of electric field-mediated gene transfer in mammalian cells. Biophys. J. 66:
524-531
4.
Mir, L.M., Banoun, H., Paoletti, C. (1988) Introduction of definite amounts of
nonpermeant molecules into living cells after electropermeabilization: direct access to the
cytosol. Exp. Cell Res. 175:15-25
5.
Serpersu, E.H., Kinosita, K., Tsong, T.Y. (1985) Reversible and irreversible
modification of erythrocyte membrane permeability by electric field. Biochem. Biophys. Acta
812;779
6.
Liang, H., Purcker, W.J., Stenger, D.A., Kubiniec, R.T., Hiu, S.W. (1988)
Uptake of fluorescent-labeled dextrans by10T ½ fibroblasts following permeation by rectangular
and exponential-decay electric field pulses. BioTechniques, 6; 550
7.
Press, F., Quilet, A., Mir, L., Marchio-Fournigalt, C., Fuenteun, J., Fradelizi,
D. (1988) An improved electro-transfection method using square shaped electric impulsions.
Biochem. Biophys. Res. Commun. 151; 982
8.
Hashimoto, K., Tatsumi, N., Okuda, K. (1989) Introduction of phalloidin labeled
with fluorescein isothyocyanate into living p[olymorphonuclear leukocytes by electroporation. J.
Biochem Biophys. Methods. 19;143-154
9.
Inoue, K., Yamishita, S., Hata, J., Kabeno, S., Asada, S., Nagahisa, E., Fujita,
T. (1990) Electroporation as a new technique for producing transgenic fish. Cell Differ. Dev. 29;
123-128
Cyto Pulse Sciences, Inc. P. O. Box 609, Columbia, MD 21045, Voice: 410-787-1890
6-5
PA-4000 User Manual Ch6: rev.1-1/05
Blank Page
6-6
Cyto Pulse Sciences, Inc. P. O. Box 609, Columbia, MD 21045 USA 410-787-1890
PA-4000 User Manual Ch7: rev.1-1/05
7. Customer Service
7.1 Limited Warranty
Cyto Pulse products are warranted against defect in materials and workmanship. If the
customer provides notice of such a defect during warranty period, Cyto Pulse, at its option, will
either repair or replace the products, which were found to be defective. The limited warranty set
forth above is exclusive and no other warranty whether written or oral, is expressed or implied.
Cyto Pulse specifically disclaims implied warranties of merchantability and fitness for a
particular purpose.
EXCEPT AS SET FORTH ABOVE, CYTO PULSE MAKES NO WARRANTY WITH RESPECT
TO THE PRODUCT, AND IN NO EVENT, REGARDLESS OF CAUSE, SHALL CYTO PULSE
BE LIABLE FOR INDIRECT, SPECIAL, OR CONSEQUENTIAL DAMAGES OR OTHER
LOSSES OF ANY KIND ARISING FROM BREACH OF WARRANTY OR OTHER USES OF
THIS PRODUCT. CYTO PULSE’S OBLIGATION TO REPAIR OR TO REPLACE, TO THE
EXTENT SET FORTH ABOVE, CONSTITUTES THE EXCLUSIVE REMEDIES OF THE
CUSTOMER FOR ANY BREACH OF WARRANTY.
This warranty shall not apply to products that after inspection by Cyto Pulse were found
to be improperly used or to have been modified in any manner. Cyto Pulse recommends that
the user not open the product cabinet. This limited warranty is valid for one year from the date
of shipment.
7.2 Customer Service
If the user believes that there is a defect in the CYTO PULSE product, the customer should
contact CYTO PULSE Customer Service through our website at www.cytopulse.com or phone
410-787-1890, or contact the local CYTO PULSE representative. A determination if the product
is still in warranty will be made. If the warranty period is still in effect, the user will be given an
authorization number (RMA) to return the product. If after receipt and inspection the product is
found to be defective, it will be replaced or repaired and returned to the customer. If the product
is found to have been modified or misused, the user will be given a quote for repair. If the
warranty period has expired and the user requests repair, CYTO PULSE will inspect the product
and provide a written quote for repair. The user must provide a purchase order number before
the product will be repaired. If the unit is damaged in shipment, the user must recover the
insured value to replace or repair from the carrier
7-1
PA-4000 User Manual Ch7: rev.1-1/05
Blank page
7-2
PA4000 User Manual AppA: rev.1-1/05
Appendix A
Pulse Specifications
Power Supply
High Range:
Voltage
5 to 1100 volts
Step Size
5 volts
Set Accuracy
+5% +5 volts
Low Range:
Voltage
4 to 400 volts
Step Size
2 volt
Set Accuracy
+5% + 2 volt
Pulse Amplitude
at 10 ohm load
5 to 970 volts
at 20 ohm load
5 to 1030 volts
at 100 ohm load
5 to 1070 volts
at 1000 ohm load
5 to 1100 volts
Droop
< 5% at 20 ohms, 150 µs
Pulse Over-Current Shut Down
>125 amps
Maximum Average Power
> 50 watts
Pulse Width
1 µs to 20 ms
Pulse Width Step Size
1 µs
Pulse Interval
0.125 to 400 sec
Pulse Interval Step Size
0.001 second
Number of Groups
20
Number of Pulses per Group
99
Line/Mains Power
100-240 VAC, 50/60 Hz
IEC 320
Cyto Pulse Sciences, Inc., P. O. Box 609, Columbia, MD 21045 USA 410-787-1890
A-1
PA4000 User Manual AppA: rev.1-1/05
Blank Page
A-2
Cyto Pulse Sciences, Inc., P. O. Box 609, Columbia, MD 21045 USA 410-787-1890
PA4000 User Manual AppB: rev.1-1/05
Appendix B
Pulse Voltage and Current Measurements
This appendix describes how to make pulse measurements using the internal monitors or
by using external customer supplied equipment, which will improve accuracy by a few percent.
Both of these techniques require the use of an oscilloscope, which usually has a measurement
accuracy of 3% to 4%. Also described are the internal circuits of the monitors and how the
scale factors are derived. A Tektronix digital oscilloscope may be purchased from Cyto Pulse.
How to Use the Internal Monitors
The PA-2000 and PA-4000 have internal pulse voltage and current monitors. The
monitors are available via BNC connectors on the back panel of the unit. These monitors
provide a signal that is a scaled down replica of the actual pulse voltage and pulse current. The
monitor signal must be viewed with an oscilloscope. The monitors must operate into a 50-ohm
load to provide a properly calibrated signal. This may be accomplished by selecting the 50 ohm
input impedance option on oscilloscopes that have that option or by using an external 50 ohm
coaxial termination. A kit containing three 1 meter coaxial cables and three 50 ohm attenuators
may be purchased from Cyto Pulse.
Three connections must be made to use the monitors:
Connection 1 - External Trigger, this BNC connector is at the top-right corner on the back
panel. A coaxial cable is connected between this connector and the oscilloscope external
trigger input. The signal is identical to the low voltage pulse that drives the high voltage switch.
This signal has the same width and interval as the high voltage pulse but is always the same
voltage. The level of this trigger pulse is about 1.5 volts into 50 ohms. When used in this
manner the scope will be triggered independent of the pulse voltage or pulse current amplitude.
A trigger level, on the oscilloscope, of 1.0 volt is recommended.
Connection 2 - Pulse Voltage Monitor, this BNC connector is located at the bottom center
of the back panel. A coaxial cable is connected from this connector to oscilloscope Channel 1.
As stated, this replica is calibrated into 50 ohms. The amplitude of the signal is 1/200 of the
actual high voltage pulse. That is, a 1000-volt pulse will appear as a 5.0 volt pulse into 50 ohms
at the oscilloscope. To calculate an estimate of the actual high voltage pulse:
Pulse Amplitude Estimate = Pulse Voltage Monitor in volts x 200 volts/volt
The pulse width and interval are the same as the high voltage pulse. The pulse rise time
out of this monitor is slower than the actual pulse rise time. If rise time measurements are
critical than an external high voltage probe must be used (see below, external measurements).
Connection 3 - Pulse Current Monitor, this BNC connector is located at the bottom left of
the back panel. A coaxial cable is connected from this connector to oscilloscope channel 2. As
stated, this replica is calibrated into 50 ohms. The amplitude of the signal is 1/20 of the actual
pulse current resulting from the high voltage pulse. That is, pulse current of 100 Amps will
appear as a 5.0 volt pulse into 50 ohms. To calculate an estimate of the pulse current:
Pulse Current Estimate = Pulse Current Monitor in volts x 20 Amps/volt
Cyto Pulse Sciences, Inc., P. O. Box 609, Columbia, MD 21045 USA 410-787-1890
B-1
PA4000 User Manual AppB: rev.1-1/05
The pulse width and interval are the same as the high voltage current pulse. The pulse
rise time out of this monitor is slower than the actual pulse current rise time. If pulse current rise
time measurements are critical than an external torroidal type current transformer should be
used (see below, external measurements).
In addition to pulse voltage and current, two other parameters of interest may be
calculated, resistance of the external load (buffer in cuvette or tissue) and charge.
The resistance in vitro or in vivo is calculated by:
External Resistance = Pulse Voltage / Pulse Current
ohms
The total charge transferred by a rectangular-wave pulse is calculated by:
PW
Total Charge =
= I • PW
∫ i(t) dt
0
in coulombs
where:
I = flattop pulse current in Amps
PW = pulse width in seconds
Combining with the current monitor equation above:
Total Charge = Current Monitor x 20 x Pulse Width
coulombs
An example of an oscilloscope output is presented in Figure B-1. The top trace, Channel
1 is the Voltage Monitor and the bottom trace, Channel 2 is the Current Monitor. The following
are the calculated values. In this example, a 400 µl volume of PBS in a 4 mm cuvette at 19 o C
and power supply voltage of 1,000 volts was used.
Estimated Pulse Amplitude
Estimated Pulse Current
Estimated PBS Resistance
Estimated Total Charge
= 2.24 div x 2 v/div x 200 v/v = 896 volts
= 1.80 div x 1 v/div x 20 A/v = 36 Amps
= 896 v/ 36 A = 24.9 ohms
= 24.9 A x 100 µs = 2.5 millicoulombs
Internal Pulse Voltage and Current Monitors
The Pulse Voltage Monitor and Pulse Current Monitor signals are derived from the high
voltage pulse. The circuit diagram is shown in Figure B-2 below.
Figure B-1: Oscilloscope Output Example
1) Ch 1:
2) Ch 2:
B-2
1 Volt 25 us
500 mVolt 25 us
Cyto Pulse Sciences, Inc., P. O. Box 609, Columbia, MD 21045 USA 410-787-1890
1>
PA4000 User Manual AppB: rev.1-1/05
Voltage Monitor Error Due to CVR
The voltage monitor circuit is a resistive divider. It is across the External Load plus the
Current Viewing Resistor. This is important because the voltage applied to the External Load is
slightly less than that measured by the Pulse Voltage Monitor. This error is 1.78%, at the lowest
from High Voltage Power Supply and Capacitor
3
Protection
Resistors
2.2 ohms
2
High Voltage Switch
Percent Error
1
Intrinsic Resistance
= Rs
(a function of current)
External Load
10 k ohms
0
10
100
Buffer Solution
Tissue
External Resistance - ohms
Current Viewing
Figure B-3: Error in Voltage
Due to (CVR)
Current Viewing Resistor
50 ohms Monitor Resistor
0.20 ohms
System Ground
(Earth)
Amplifier
divide by 4
Amplifier
unit gain
Power Supply
Voltage Monitor
(to computer and data log)
Pulse
Current Monitor
(IMON)
Pulse
Voltage Monitor
(VMON)
Back Panel
Voltage Monitor Scale Factor = 50/10,000 = 1/200
Current Monitor Scale Factor = 0.20/4 = 1/20
HV Switch Rs = a + b Rext + c Rext 2 + d Rext 3
Figure B-2: Simplified Circuit Diagram of Monitors
Cyto Pulse Sciences, Inc., P. O. Box 609, Columbia, MD 21045 USA 410-787-1890
B-3
PA4000 User Manual AppB: rev.1-1/05
Pulse Amplitude/Power Supply Voltage
1.000
0.980
0.960
0.940
0.920
0.900
0.880
0.860
0.840
0.820
0.800
10
100
1000
Load Resistance, ohms
Figure B-4: Typical Relationship between Power Supply and Pulse Amplitude
value of permitted External Resistance of 8 ohms. Shown in Figure B-3, as the External Load
Resistance gets larger, the error gets smaller.
Voltage Across External Load
If the Pulse Voltage Monitor/Oscilloscope combination is not used, the voltage across the
External Load Resistance can be estimated. The voltage across the load is:
Pulse Voltage across External Load = Rext/Rtotal x Power Supply Voltage
where:
Rtotal = Rinternal + Rext
Rinternal = 2.5 ohms (nominally)
This is a standard voltage divider relationship. An estimate of Rext is given in the
Ohmmeter window Status area of the PulseAgile® software interface and at the bottom of the
Protocol Log report. The above computation is performed by the PulseAgile® software and
also presented in the log report. The number presented is the ratio of pulse voltage to power
supply voltage. As the External Load Resistance gets lower, more voltage appears across the
internal resistance and less voltage appears across the External Load. This is shown in the
graph in Figure B-4. This ratio estimate is accurate to about 10%. The Rext estimate should not
be used for precise analysis.
Using External Equipment to Measure Pulse Voltage and Current
B-4
Cyto Pulse Sciences, Inc., P. O. Box 609, Columbia, MD 21045 USA 410-787-1890
PA4000 User Manual AppB: rev.1-1/05
The most accurate method to measure pulse voltage and pulse current is with an external
high voltage oscilloscope probe and an external current transformer.
High Voltage Probe
Most oscilloscope manufacturers offer a high voltage probe. One example is the Tektronix
TEK5100. To use the probe, connect the probe tip to the high voltage side of the external load
such as the cuvette contact. The ground side must be connected to the System Ground Screw
on the back panel, not the other side of the external load. If connected to the other side of the
external load, the internal current monitor circuit will distort the current measurement.
Caution
When connecting to the high voltage side, care must be taken so it is not
possible to come in contact with any high voltage while the system is operating.
Current Transformer
The most accurate and safest current measurement is with a torroidal current transformer.
This is a coil through which the low potential side of the External Load current is passed. The
current through the return lead induces a voltage in the transformer, which is in turn measured.
A Pearson Model 411 is recommended for this type of measurement. Contact Pearson
Electronics, Palo Alto, CA.
Load Resistance and Electric Field Predicting Model
A Microsoft EXCEL model that will predict the external load is available from the Cyto
Pulse. This prediction is useful when setting up a protocol to determine the cuvette type to use,
the buffer type, the volume to be treated, and the electric field intensity in the cuvette.
Cyto Pulse Sciences, Inc., P. O. Box 609, Columbia, MD 21045 USA 410-787-1890
B-5
PA4000 User Manual AppC: rev.1-1/05
Appendix C
Declarations of Conformity
CE Declaration of Conformity
CB Test Certificate
FCC Compliance: CFR 47, Part 18, Subpart C, Class A Equipment
Industry Canada Compliance: ICES-003 Category II, Class A Equipment
Cyto Pulse Sciences, Inc., P. O. Box 609, Columbia, MD 21045 USA 410-787-1890
C-1
PA4000 User Manual AppC: rev.1-1/05
Blank Page
C-2
Cyto Pulse Sciences, Inc., P. O. Box 609, Columbia, MD 21045 USA 410-787-1890
PA4000 User Manual AppC: rev.1-1/05
Replace with CE
Cyto Pulse Sciences, Inc., P. O. Box 609, Columbia, MD 21045 USA 410-787-1890
C-3
PA4000 User Manual AppC: rev.1-1/05
Blank Page
C-4
Cyto Pulse Sciences, Inc., P. O. Box 609, Columbia, MD 21045 USA 410-787-1890
PA4000 User Manual AppC: rev.1-1/05
Replace with CB
Cyto Pulse Sciences, Inc., P. O. Box 609, Columbia, MD 21045 USA 410-787-1890
C-5
PA4000 User Manual AppC: rev.1-1/05
Blank Page
C-6
Cyto Pulse Sciences, Inc., P. O. Box 609, Columbia, MD 21045 USA 410-787-1890
PA4000 User Manual AppC: rev.1-1/05
Replace with FCC
Cyto Pulse Sciences, Inc., P. O. Box 609, Columbia, MD 21045 USA 410-787-1890
C-7
PA4000 User Manual AppC: rev.1-1/05
Blank Page
C-8
Cyto Pulse Sciences, Inc., P. O. Box 609, Columbia, MD 21045 USA 410-787-1890
PA4000 User Manual AppC: rev.1-1/05
Replace with Industry Canada
Cyto Pulse Sciences, Inc., P. O. Box 609, Columbia, MD 21045 USA 410-787-1890
C-9
PA4000 User Manual AppC: rev.1-1/05
Blank Page
C-10
Cyto Pulse Sciences, Inc., P. O. Box 609, Columbia, MD 21045 USA 410-787-1890