1
Mayavi User Guide, Release 3.3.1
For simple structures (such as rectangular grids) prefer the surf or mesh functions, as they will create more
efficient data structures.
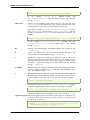
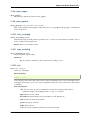
Keyword arguments:
color the color of the vtk object. Overides the colormap, if any, when specified. This is
specified as a triplet of float ranging from 0 to 1, eg (1, 1, 1) for white.
colormap type of colormap to use.
extent [xmin, xmax, ymin, ymax, zmin, zmax] Default is the x, y, z arrays extents. Use
this to change the extent of the object created.
figure Figure to populate.
line_width The with of the lines, if any used. Must be a float. Default: 2.0
mask boolean mask array to suppress some data points.
mask_points If supplied, only one out of ‘mask_points’ data point is displayed. This option is usefull to reduce the number of points displayed on large datasets Must be an
integer or None.
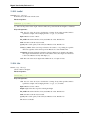
mode the mode of the glyphs. Must be ‘2darrow’ or ‘2dcircle’ or ‘2dcross’ or ‘2ddash’ or
‘2ddiamond’ or ‘2dhooked_arrow’ or ‘2dsquare’ or ‘2dthick_arrow’ or ‘2dthick_cross’
or ‘2dtriangle’ or ‘2dvertex’ or ‘arrow’ or ‘axes’ or ‘cone’ or ‘cube’ or ‘cylinder’ or
‘point’ or ‘sphere’. Default: sphere
name the name of the vtk object created.
opacity The overall opacity of the vtk object. Must be a float. Default: 1.0
representation the representation type used for the surface. Must be ‘surface’ or ‘wireframe’ or ‘points’ or ‘mesh’ or ‘fancymesh’. Default: surface
resolution The resolution of the glyph created. For spheres, for instance, this is the number
of divisions along theta and phi. Must be an integer. Default: 8
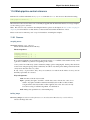
scalars optional scalar data.
scale_factor scale factor of the glyphs used to represent the vertices, in fancy_mesh mode.
Must be a float. Default: 0.05
scale_mode the scaling mode for the glyphs (‘vector’, ‘scalar’, or ‘none’).
transparent make the opacity of the actor depend on the scalar.
tube_radius radius of the tubes used to represent the lines, in mesh mode. If None, simple
lines are used.
tube_sides number of sides of the tubes used to represent the lines. Must be an integer.
Default: 6
vmax vmax is used to scale the colormap If None, the max of the data will be used
vmin vmin is used to scale the colormap If None, the min of the data will be used
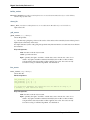
11.1. Plotting functions
237