1
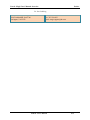
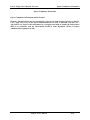
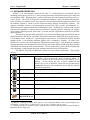
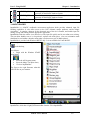
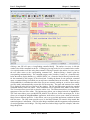
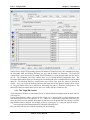
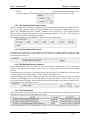
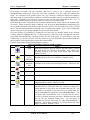
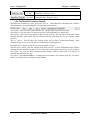
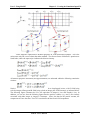
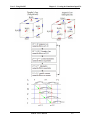
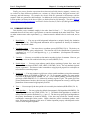
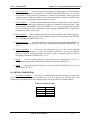
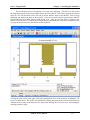
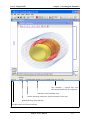
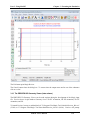
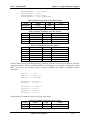
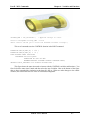
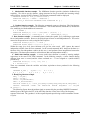
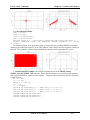
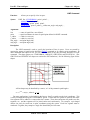
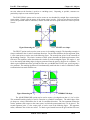
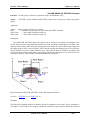
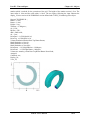
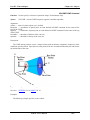
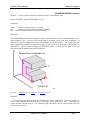
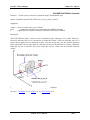
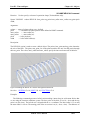
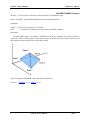
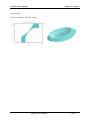
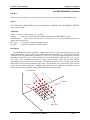
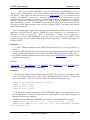
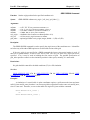
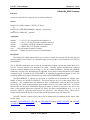
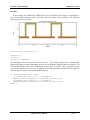
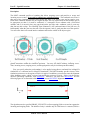
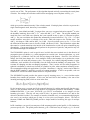
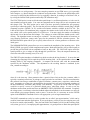
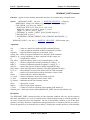
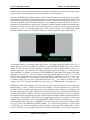
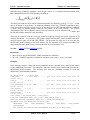
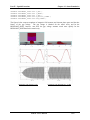
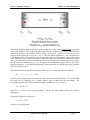
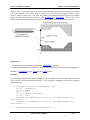
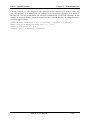
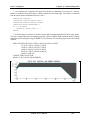
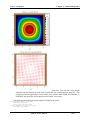
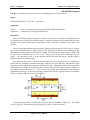
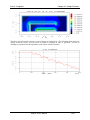
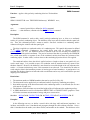
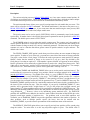
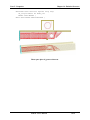
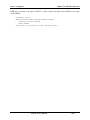
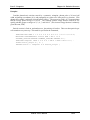
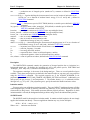
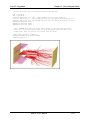
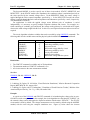
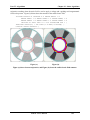
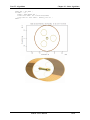
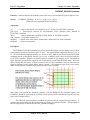
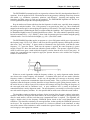
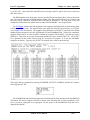
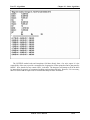
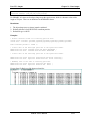
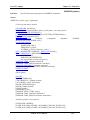
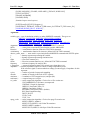
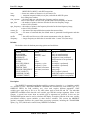
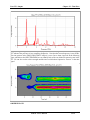
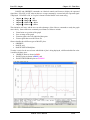
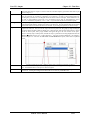
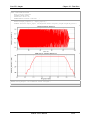
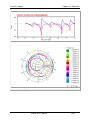
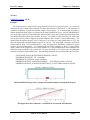
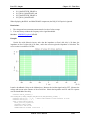
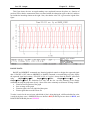
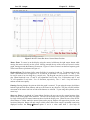
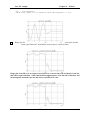
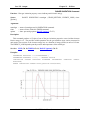
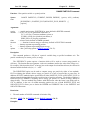
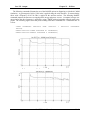
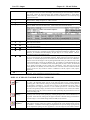
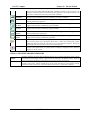
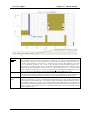
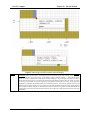
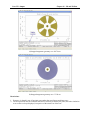
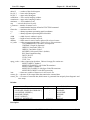
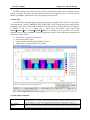
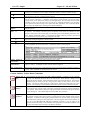
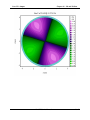
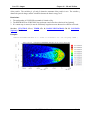
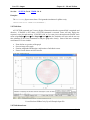
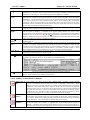
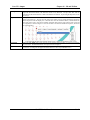
Part VII –Output Chapter 24 – 2D and 3D Plots Show/Hide X_AXIS: This command is the same as the menu "Phasespace -> x-Axis and labels" toggle command. It toggles between showing and hiding the graph x axis/labels. Show/Hide Y_AXIS: This command is the same as the menu "Phasespace -> y-Axis and labels" toggle command. It toggles between showing and hiding the graph y axis/labels. Show/Hide Legend: This command is the same as the menu "Phasespace -> Legend" toggle command. It toggles between showing and hiding the graph legend. Show/Hide Frame: This command is the same as the menu "Phasespace -> Show graph frame" toggle command. It toggles between showing and hiding the graph frame. Reset Graph: This command is the same as the menu "Phasespace -> Reset" command. This command will reset the plot to the original settings. Any changes such as zooming in, changing line colors, hiding the legend, etc, will be reversed. 23.1 PHASESPACE Mouse/Keyboard Controls: Current Mouse Position: Mouse Zoom: Keyboard Zoom: Panning: Snap to a In Phasespace whenever the mouse cursor is inside the plot area, the x,y location of the mouse cursor is shown in the status bar of the MAGIC window. Figure 4 shows the status bar of the MAGIC window. When the mouse is positioned at the blue arrow, the location of the cursor is shown in the status bar. MAGIC Status Bar shows Current Mouse Position To zoom in on the display using the mouse, hold down the right mouse button while moving the mouse vertically on the screen. Moving towards the top of the screen will zoom in on the graph, moving towards the bottom will zoom out. Aspect Ratio will be preserved if 1:1 Aspect Ratio is enabled. Figure 4 shows a zoom in on the right-middle vane of the same magnetron and phasespace plot shown in Figure 2. The keyboard offers more flexibility for zooming in and out. To change only the scale of the x (horizontal) axis, use uppercase “X” to zoom in, or lowercase “x” to zoom out. “Y” and “y” can be used to zoom in or out along the y (vertical) axis. The Keypad can also be used to zoom in on the plot. When NumLock is on, “4” and “6“ will expand the X axis in the –X or +X directions, and “2” and “8” will expand the Y axis in the –Y or +Y directions, respectively. The “+” and “–“ keys will zoom in and out on both axes equally. If 1:1 Aspect Ratio is enabled, the scale of one axis cannot be changed without effecting the scale of the other. Because of this, if a command that zooms in on the x or y axis is used, such as “X” or “Y” both axes will zoom in equally, much like when “+” is used. The same is true for commands that expand only one of the axes. To disable Aspect Ratio, uncheck the Phasespace 1:1 Aspect Ratio menu option. Panning changes the point at which the graph is centered. To pan using the mouse, hold down both the right and left mouse buttons, and move the mouse in any direction. The plot will shift with the movement of the mouse until one or both of the buttons are released. To pan using the keyboard, use the arrow keys. As explained in Current Mouse Position, the user can see the current location of the mouse cursor on the MAGIC User’s Manual 24- 41