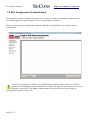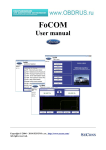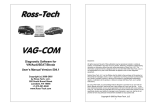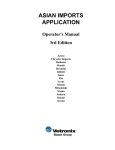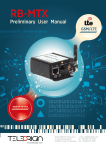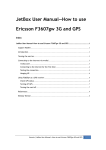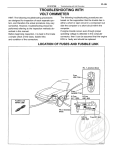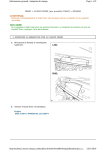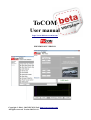
1
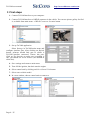
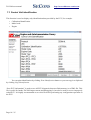
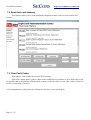
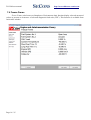
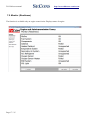
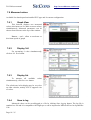
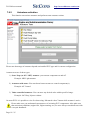
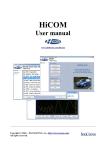
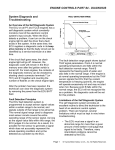
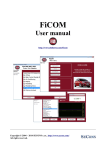
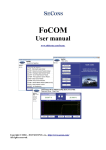
ToCOM user manual
http://www.obdtester.com/tocom
7.6 Measured values
Available live data depend on installed ECU type and it's current configuration.
7.6.1
Graph View
This function displays two measured
values (also known as live data or sensor values)
simultaneously. Measured parameters can be
chosen from selectors at the top of the window.
Buttons – and + allow to accelerate or
decelerate speed of graph.
7.6.2
Display 3x3
For measuring 9 value simultaneously,
click on 3x3 View button.
7.6.3
Display list
To measure all available
simultaneously, click List view button.
values
The refresh rate in list display may be very slow
on older vehicles, mainly if ECU supports a lot
of values.
7.6.4
Save to log
Measured values can be saved/logged to a file by clicking Start logging button. The log file is
standard csv file and it is compatible with VagScope or can be imported to Microsoft Excel or OpenOffice
Calc.
Page 18 / 25