1
Charting
Creating charts
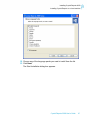
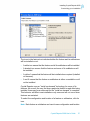
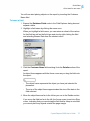
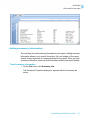
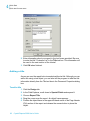
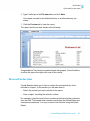
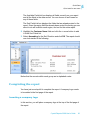
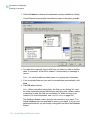
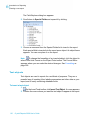
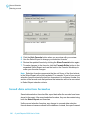
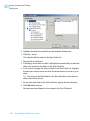
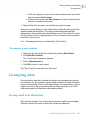
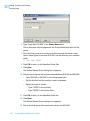
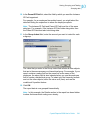
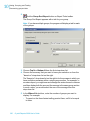
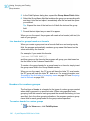
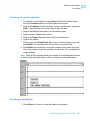
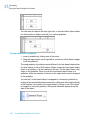
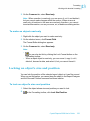
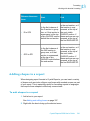
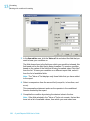
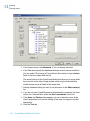
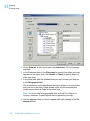
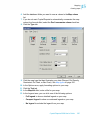
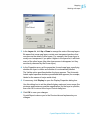
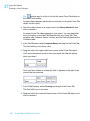
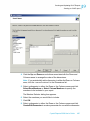
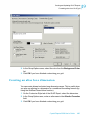
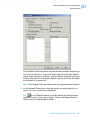
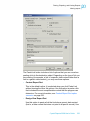
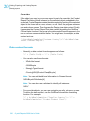
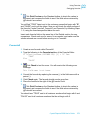
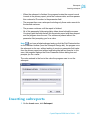
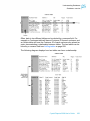
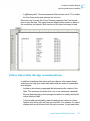
11. Accept the default title information or add new titles to your chart.
12. Click OK.
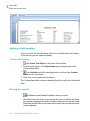
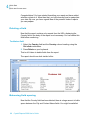
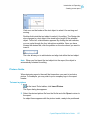
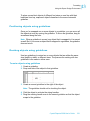
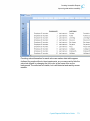
Note: When your chart is inserted, it may cover a portion of the report. Move
and resize the chart so that it fits properly within the report.
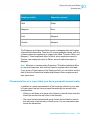
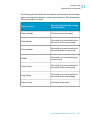
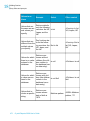
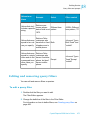
Condition
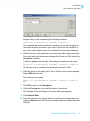
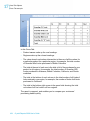
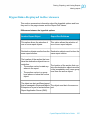
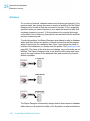
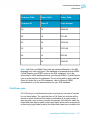
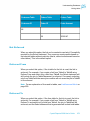
The condition is used to indicate when to plot the point. For example, a chart
showing last year's sales for your customers uses the Customer Name field
as the condition. Each time the condition changes (the customer name
changes), a point is plotted.
You also have the option of plotting a point for each record, or plotting one
point for all records.
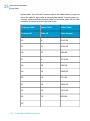
Value
The Advanced chart uses the value to indicate what information is plotted
as the points on your chart. For example, to create a chart showing last year's
sales for your customers, the Last Year's Sales field would be the value.
Charting on summary or subtotal fields (Group
layout)
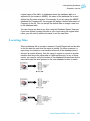
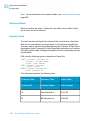
Many of the charts you create are based on summary or subtotals within
your report. In order to create these charts, you must have a summary or
subtotal already inserted into your report in a group header or footer. For
more information on inserting summaries and subtotals, see Summarizing
grouped data on page 246 and Subtotaling on page 252.
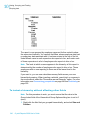
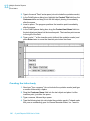
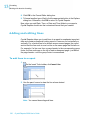
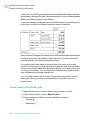
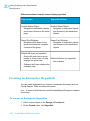
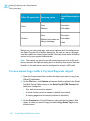
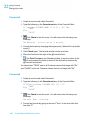
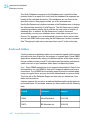
To chart on a summary or subtotal field
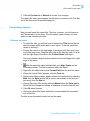
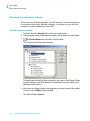
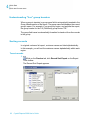
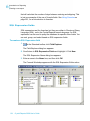
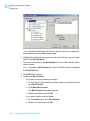
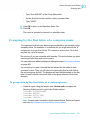
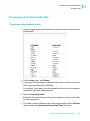
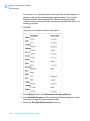
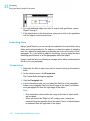
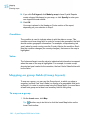
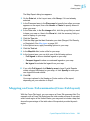
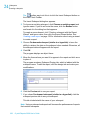
1. On the Insert menu, click Chart.
An object frame appears in the Report Header area.
Crystal Reports 2008 User's Guide
377
14