1
Binary Dependent Variable Models—259
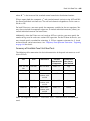
Details on the two tests are described in the
“Technical Notes” on page 296. Briefly, the tests
differ in how the observations are grouped and in
the asymptotic distribution of the test statistic.
The Hosmer-Lemeshow test groups observations
on the basis of the predicted probability that
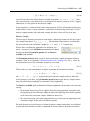
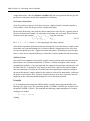
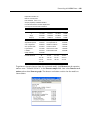
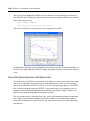
y = 1 . The Andrews test is a more general test
that groups observations on the basis of any series
or series expression.
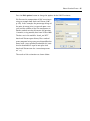
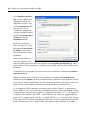
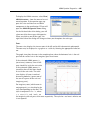
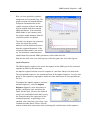
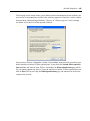
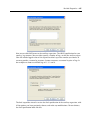
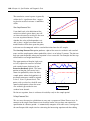
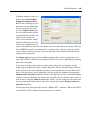
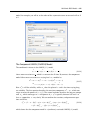
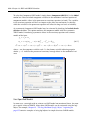
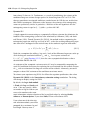
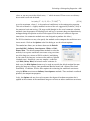
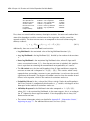
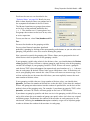
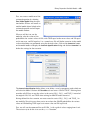
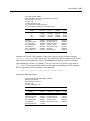
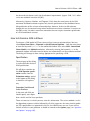
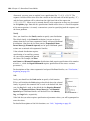
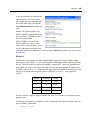
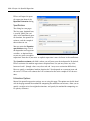
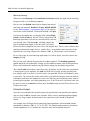
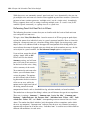
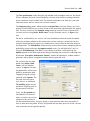
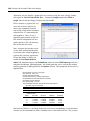
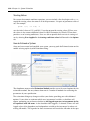
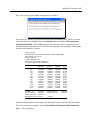
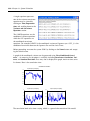
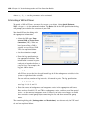
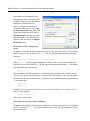
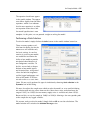
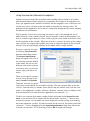
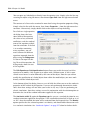
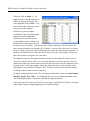
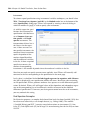
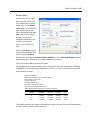
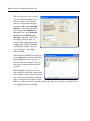
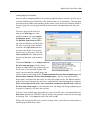
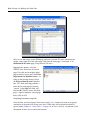
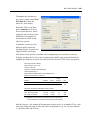
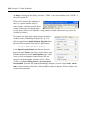
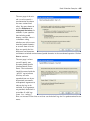
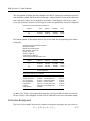
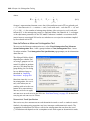
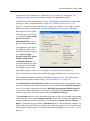
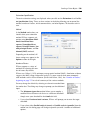
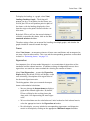
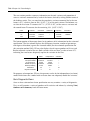
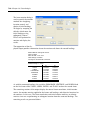
To carry out the test, select View/Goodness-of-Fit
Test…
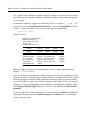
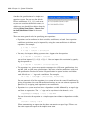
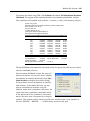
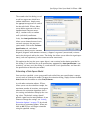
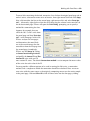
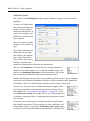
You must first decide on the grouping variable.
You can select Hosmer-Lemeshow (predicted
probability) grouping by clicking on the corresponding radio button, or you can select series
grouping, and provide a series to be used in forming the groups.
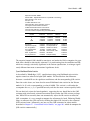
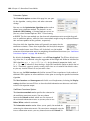
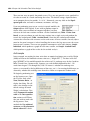
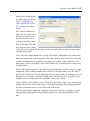
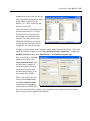
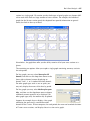
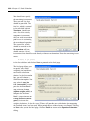
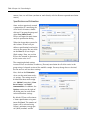
Next, you need to specify the grouping rule. EViews allows you to group on the basis of
either distinct values or quantiles of the grouping variable.
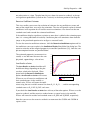
If your grouping variable takes relatively few distinct values, you should choose the Distinct
values grouping. EViews will form a separate group for each distinct value of the grouping
variable. For example, if your grouping variable is TUCE, EViews will create a group for
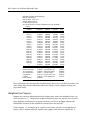
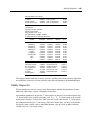
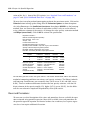
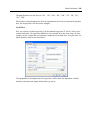
each distinct TUCE value and compare the expected and actual numbers of y = 1 observations in each group. By default, EViews limits you to 100 distinct values. If the distinct values in your grouping series exceeds this value, EViews will return an error message. If you
wish to evaluate the test for more than 100 values, you must explicitly increase the maximum number of distinct values.
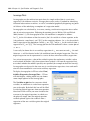
If your grouping variable takes on a large number of distinct values, you should select
Quantiles, and enter the number of desired bins in the edit field. If you select this method,
EViews will group your observations into the number of specified bins, on the basis of the
ordered values of the grouping series. For example, if you choose to group by TUCE, select
Quantiles, and enter 10, EViews will form groups on the basis of TUCE deciles.
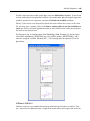
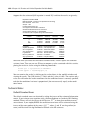
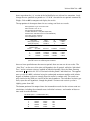
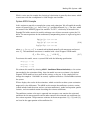
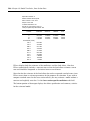
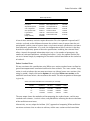
If you choose to group by quantiles and there are ties in the grouping variable, EViews may
not be able to form the exact number of groups you specify unless tied values are assigned
to different groups. Furthermore, the number of observations in each group may be very
unbalanced. Selecting the randomize ties option randomly assigns ties to adjacent groups
in order to balance the number of observations in each group.