1
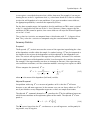
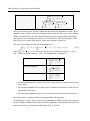
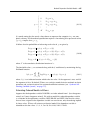
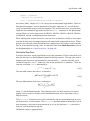
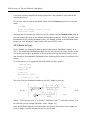
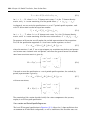
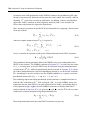
410—Chapter 30. Univariate Time Series Analysis Joint Variance Ratio Tests Since the variance ratio restriction holds for every difference q > 1 , it is common to evaluate the statistic at several selected values of q . To control the size of the joint test, Chow and Denning (1993) propose a (conservative) test statistic that examines the maximum absolute value of a set of multiple variance ratio statistics. The p-value for the Chow-Denning statistic using m variance ratio statistics is bounded from above by the probability for the Studentized Maximum Modulus (SMM) distribution with parameter m and T degrees-of-freedom. Following Chow and Denning, we approximate this bound using the asymptotic ( T = • ) SMM distribution. An second approach is available for variance ratio tests of the i.i.d. null. Under this set of assumptions, we may form the joint covariance matrix of the variance ratio test statistics as in Richardson and Smith (1991), and compute the standard Wald statistic for the joint hypothesis that all m variance ratio statistics equal 1. Under the null, the Wald statistic is asymptotic Chi-square with m degrees-of-freedom. For a detailed discussion of these tests, see Fong, Koh, and Ouliaris (1997). Wild Bootstrap Kim (2006) offers a wild bootstrap approach to improving the small sample properties of variance ratio tests. The approach involves computing the individual (Lo and MacKinlay) and joint (Chow and Denning, Wald) variance ratio test statistics on samples of T observations formed by weighting the original data by mean 0 and variance 1 random variables, and using the results to form bootstrap distributions of the test statistics. The bootstrap pvalues are computed directly from the fraction of replications falling outside the bounds defined by the estimated statistic. EViews offers three distributions for constructing wild bootstrap weights: the two-point, the Rademacher, and the normal. Kim’s simulations indicate that the test results are generally insensitive to the choice of wild bootstrap distribution. Rank and Rank Score Tests Wright (2000) proposes modifying the usual variance ratio tests using standardized ranks of the increments, DY t . Letting r ( DY t ) be the rank of the DY t among all T values, we define the standardized rank ( r 1t ) and van der Waerden rank scores ( r 2t ) : T+1 r 1t = r ( DY t ) – -------------- § 2 (T – 1)(T + 1) -------------------------------------12 (30.59) –1 r 2t = F ( r ( DY t ) § ( T + 1 ) ) In cases where there are tied ranks, the denominator in r 1t may be modified slightly to account for the tie handling.