1
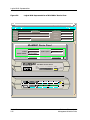
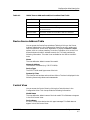
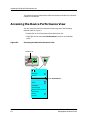
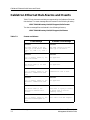
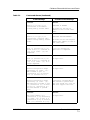
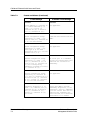
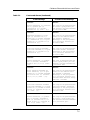
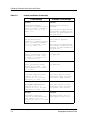
Accessing the Device Performance View
IRBM, IRM2, IRM3 and MiniMMAC Hubs
Table 6-3.
Error Breakdown Pie Chart (Continued)
Statistic
Definition
Giants
The number of frames detected with a size greater than 1518
bytes.
OOW Coll
The number of Out Of Window collisions detected by the hub.
Errors
This button, available only for the IRM3, provides the same information as
the Detail button for IRM2, IRBM, and MiniMMAC hubs.
Frames
This button, available only for the IRM3, displays two pie charts. The Frame
Size pie chart shows the total number of frames, grouped according to their
size in bytes. The Protocol pie chart shows the number of frames per protocol
type.
Scroll to Date-Time
This button allows you to view historical data related to hub performance. For
example, if you set a date and time for two days ago, you can view hub
performance statistics for two days ago.
Change Time Scale
This button allows you to change how time is measured on the line graph in
the hub Performance View. You can choose to display statistics in time blocks
ranging from 1 to 100 hours.
Events
This button accesses the Event Log containing a list of hub-specific network
events. Use the menu or the scroll bars to scroll through the Event Log.
Alarms
This button allows you to access the Alarms View. The Alarms View displays a
list of current network alarms. For information on how to use the Alarms
View, refer to the Enterprise Alarm Manager
9030367 E8
Performance Views
6-5