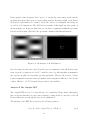
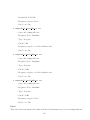
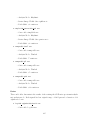
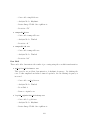
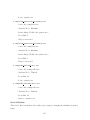
1
One
Dimensional
Two
Dimensional
Time Domain
Frequency Domain
Audio Waveform Display
One Dimensional Fourier Spectrum
Raster Image Display
Two Dimensional Fourier Spectrum
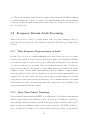
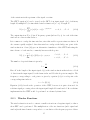
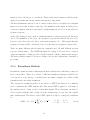
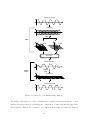
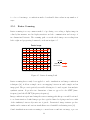
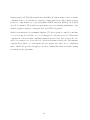
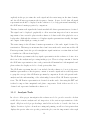
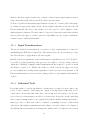
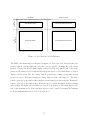
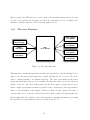
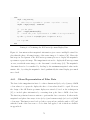
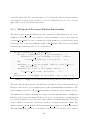
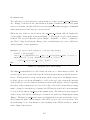
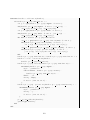
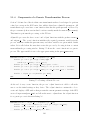
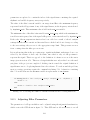
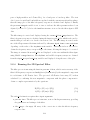
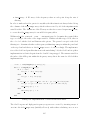
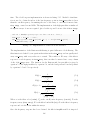
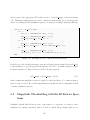
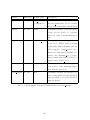
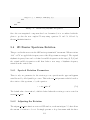
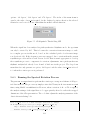
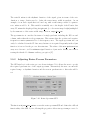
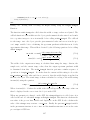
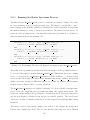
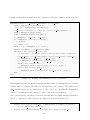
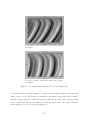
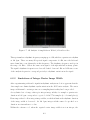
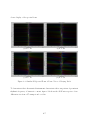
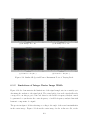
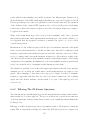
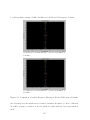
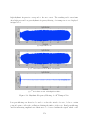
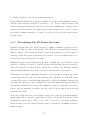
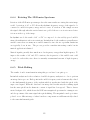
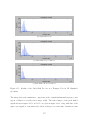
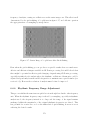
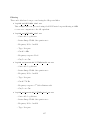
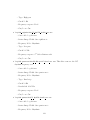
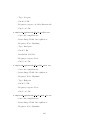
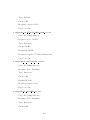
Figure 3.1: Plot Layout for User Interface
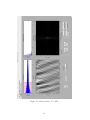
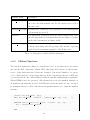
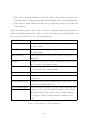
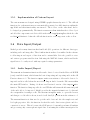
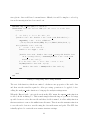
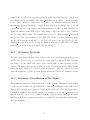
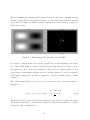
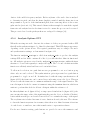
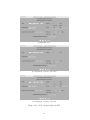
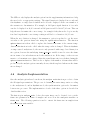
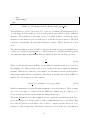
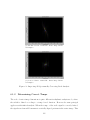
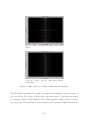
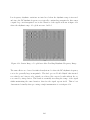
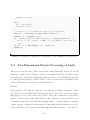
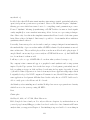
The GUI for the main window is displayed in figure 3.2. Below the four data plots there are
several controls. On the right-hand side there are two panels containing the audio player
(section 3.7) and the 2D spectrum display controls (section 4.4). On the left of the audio
player are the frame selection buttons that allow the user to select which frame of data is
displayed in the plots. The ‘Processing’ button opens the processing pop-up window that
provides access to 2D Fourier signal processing; this is described in chapter 5. The ‘Info’
button opens a pop-up window that displays several signal properties and the ‘Reanalyse’
button opens a pop-up window that allows the user to adjust the initial analysis settings
and redisplay the signal, these features are described in chapter 4. The main window also
has a custom menu and toolbar, which provides access to data I/O, settings and analysis
tools; the implementation is described in section 3.5.
37