1
5.2.2
Calculating Filter Properties Based On The 2D Fourier
Spectrum
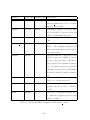
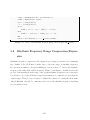
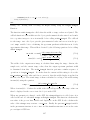
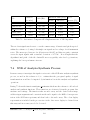
The function calc filter properties is used to determine a series of filter properties
that help to define the range of values that cutoff and bw can take when being adjusted
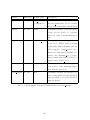
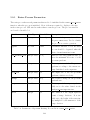
by the user. Table 5.2 shows the variables obtained by this function, which are stored in
the process structure.
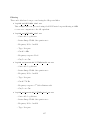
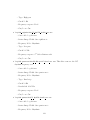
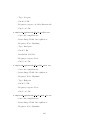
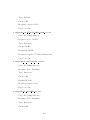
Variable
Description
rhyth freq
2D array of rhythmic frequencies represented by the 2D Fourier
spectrum of each signal frame.
2D array of audible frequencies represented by the 2D Fourier spec-
aud freq
trum of each signal frame.
max rhyth frame The frame number of the 2D spectrum that represents the highest
maximum rhythmic frequency.
max aud frame
The frame number of the 2D spectrum that has the maximum number of points in the audible dimension.
The maximum allowed value of cutoff, the filter’s cutoff frequency,
max cut
in the currently selected frequency axis and also the maximum filter bandwidth, bw. This variable is determined by the maximum
frequency in the appropriate axis represented by the 2D spectrum
of any signal frame.
min freq step
The minimum frequency interval between adjacent bins on the currently selected frequency axis of the 2D spectrum of any signal
frame. This is the minimum value of the bw variable.
Table 5.2: Filter Data Obtained From The 2D Fourier Spectrum
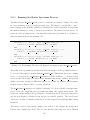
The calc filter properties function determines the frequency arrays corresponding to
the centre of each frequency bin on both axes of the 2D spectrum and stores them in
rhyth freq and aud freq respectively. When the signal analysis is in timbral mode this
needs to be done for every frame, since each has its own 2D spectrum, resulting in 2D
arrays. As these frequency arrays are calculated, the max rhyth frame and max aud frame
121