1
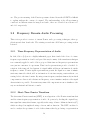
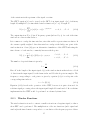
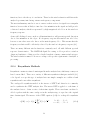
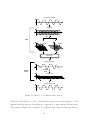
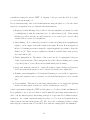
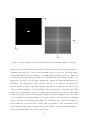
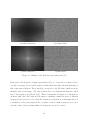
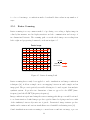
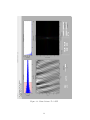
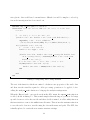
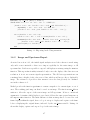
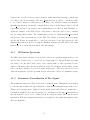
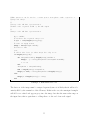
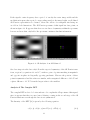
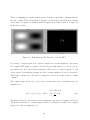
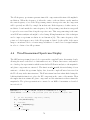
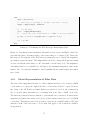
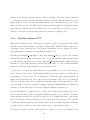
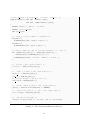
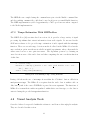
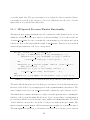
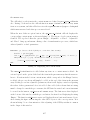
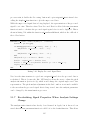
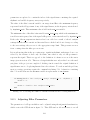
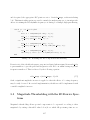
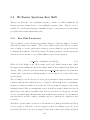
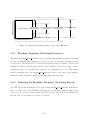
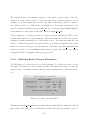
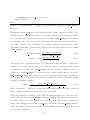
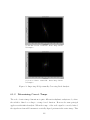
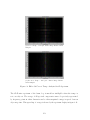
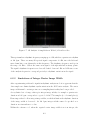
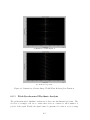
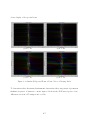
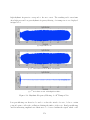
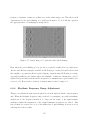
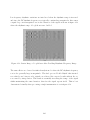
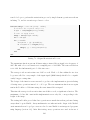
Figure 2.2: Image Display and 2D Fourier Magnitude Spectrum in Matlab, after [16]
Figure 2.3 shows the non-shifted and shifted displays of magnitude and phase information.
Magnitude information becomes clearer when shifted but as you can see, the phase display
is quite unintelligible and as with audio spectrum displays is often not shown. This does
not however mean that phase information is not important in describing an image. As
with audio (section 2.2.5), the phase information contains the structural information of
the image. The importance of phase in the coherence of an image is demonstrated in
[6], this website provides some simple images with their Fourier transform data to help
develop an understanding of the relationship between an image and its Fourier data. The
images in [6] demonstrate a method of displaying the magnitude and phase components
together in a single display, where magnitude is the saturation and phase is the hue of the
colour. Another web demonstration provides a Java applet to demonstrate the relationship
between an image and its Fourier spectrum [15], allowing the user to modify the image or
its spectrum and observe the effects on the other representation. This demonstration also
shows magnitude and phase information in a signal display, this time using brightness to
represent magnitude and chromacity for the phase.
23