1
MAXIM$ER is a registered mark of Arbitron Inc. QUALITAP, MEDIA PROFESSIONAL, and RETAIL SPENDING
POWER and their respective designs are service marks of Arbitron Inc. TAPSCAN, TVSCAN
and their respective designs are registered marks of Tapscan, Inc., Used under license.
SALESCAN is a mark of Media Systems, Inc. ©2001 Arbitron Inc. All rights reserved.
Tapscan User Manual
Table of Contents
Chapter One: Introduction, Installation & Initialization
Introduction........................................................................................................................................................13
Manual and System User Tips ................................................................................................................................13
Obtaining Product Application and Technical Assistance ......................................................................................13
Chapter Two: Setup & Utilities
Setup ..................................................................................................................................................................17
Default Settings.......................................................................................................................................................18
Data Setup...............................................................................................................................................................19
Report Setup ...........................................................................................................................................................22
Path Settings ...........................................................................................................................................................22
Daypart Codes ........................................................................................................................................................23
Utilities...............................................................................................................................................................24
Download Data .......................................................................................................................................................24
Create Average .......................................................................................................................................................26
Setup .......................................................................................................................................................................26
Pseudonyms ............................................................................................................................................................26
Client Stations.........................................................................................................................................................27
Daypart Names, Codes and Rates ...........................................................................................................................28
Manual Adjustments ...............................................................................................................................................29
Non-Rated Stations .................................................................................................................................................29
Chapter Three: Qualitative Adjustments
Qualitative Adjustments.....................................................................................................................................33
Adjustments from QualiTAP ..................................................................................................................................33
Selecting the Qualitative Category(s).................................................................................................................33
Criteria Menu Options .......................................................................................................................................34
Changing the Geographic Focus of the Report ..................................................................................................34
Saving and Retrieving County/Zip Code Groups...............................................................................................35
Manual Adjustments ...............................................................................................................................................35
Building a Manual Adjustment ..........................................................................................................................36
Changing a Saved Manual Adjustment File .......................................................................................................38
Deleting a Manual Adjustment File ...................................................................................................................38
Maximi$er/MediaPro..............................................................................................................................................38
Socioeconomic Data ...............................................................................................................................................39
Chapter Four: Common Options
Common Options ...............................................................................................................................................43
Market Selection.....................................................................................................................................................43
Station List Builder for Multi-Market Reports .......................................................................................................43
Station Lists ............................................................................................................................................................44
Survey Selection .....................................................................................................................................................45
Selecting the Daypart Focus of the Report..............................................................................................................45
Selecting the Demographic Focus...........................................................................................................................46
Stations Selection....................................................................................................................................................47
Station Selection Box..............................................................................................................................................47
Configuring the Station Roster................................................................................................................................47
Combos...................................................................................................................................................................49
TAPSCAN – TABLE OF CONTENTS
Geography.............................................................................................................................................................. 50
Maximi$er/MediaPro ............................................................................................................................................. 52
Qualitative Adjustments ......................................................................................................................................... 52
Estimates ................................................................................................................................................................ 52
Chapter Five: Rankers
Introduction ....................................................................................................................................................... 57
TAPSCAN Ranker ............................................................................................................................................... 58
Establishing the Parameters of the Report.............................................................................................................. 58
Market Selection ............................................................................................................................................... 58
Survey Selection................................................................................................................................................ 58
Selecting the Daypart Focus of the Report ........................................................................................................ 58
Selecting the Demographic Focus ..................................................................................................................... 59
Stations Selection .............................................................................................................................................. 59
Configuring the Station Roster .......................................................................................................................... 59
Combos ............................................................................................................................................................. 59
Geography ......................................................................................................................................................... 59
Maximi$er/MediaPro ........................................................................................................................................ 59
Qualitative Adjustments .................................................................................................................................... 59
Estimates ........................................................................................................................................................... 60
The TAPSCAN Ranker Display................................................................................................................................ 60
Printing a TAPSCAN Ranker.................................................................................................................................... 60
Ranking Summaries........................................................................................................................................... 62
Establishing the Parameters of the Report.............................................................................................................. 62
Market Selection ............................................................................................................................................... 62
Survey Selection................................................................................................................................................ 62
Selecting the Daypart Focus of the Report ........................................................................................................ 62
Geography ......................................................................................................................................................... 63
Maximi$er/MediaPro ........................................................................................................................................ 63
Qualitative Adjustments .................................................................................................................................... 63
Combos ............................................................................................................................................................. 63
Station Selection Box ........................................................................................................................................ 63
Scan All Demos/Age Range Demos Box .......................................................................................................... 63
Estimates ........................................................................................................................................................... 63
The Ranking Summary Display ............................................................................................................................. 64
Printing a Ranking Summary ................................................................................................................................. 64
Multi-Daypart/Multi-Demo Ranker................................................................................................................... 65
Establishing the Parameters of the Report.............................................................................................................. 65
Market Selection ............................................................................................................................................... 65
Survey Selection................................................................................................................................................ 65
Stations Selection .............................................................................................................................................. 65
Configuring the Station Roster .......................................................................................................................... 66
Combos ............................................................................................................................................................. 66
Geography ......................................................................................................................................................... 66
Maximi$er/MediaPro ........................................................................................................................................ 66
Qualitative Adjustments .................................................................................................................................... 66
Estimates ........................................................................................................................................................... 66
Selecting the Demographic Focus ..................................................................................................................... 67
Selecting the Daypart Focus of the Report ........................................................................................................ 67
Creating a Custom Grid..................................................................................................................................... 68
The Multi-Daypart/Multi-Demo Ranker Display ................................................................................................... 68
Printing a Multi-Daypart/Multi-Demo Ranker ....................................................................................................... 69
Cost Per Point (CPP) Based Table .................................................................................................................... 70
Establishing the Parameters of the Report.............................................................................................................. 70
Market Selection ............................................................................................................................................... 70
2
TAPSCAN - TABLE OF CONTENTS
Survey Selection ................................................................................................................................................70
Selecting the Daypart Focus of the Report.........................................................................................................70
Selecting the Demographic Focus......................................................................................................................71
Stations Selection...............................................................................................................................................71
Configuring the Station Roster...........................................................................................................................71
Combos ..............................................................................................................................................................71
Geography..........................................................................................................................................................71
Maximi$er/MediaPro .........................................................................................................................................71
CPP Starting Value/Increment—Step-up Amount and Number of Times .........................................................72
The CPP Rank Table ..............................................................................................................................................72
Printing a CPP Rank Table .....................................................................................................................................72
Cost Per Thousand (CPM) Based Table ............................................................................................................73
Establishing the Parameters of the Report ..............................................................................................................73
Market Selection ................................................................................................................................................73
Survey Selection ................................................................................................................................................73
Selecting the Daypart Focus of the Report.........................................................................................................73
Selecting the Demographic Focus......................................................................................................................74
Stations Selection...............................................................................................................................................74
Configuring the Station Roster...........................................................................................................................74
Combos ..............................................................................................................................................................74
Geography..........................................................................................................................................................74
Maximi$er/MediaPro .........................................................................................................................................74
CPM Starting Value/Increment—Step-up amount and Number of Times .........................................................75
The CPM Rank Table .............................................................................................................................................75
Printing a CPM Rank Table....................................................................................................................................75
Spot Based Table ...............................................................................................................................................76
Establishing the Parameters of the Report ..............................................................................................................76
Market Selection ................................................................................................................................................76
Survey Selection ................................................................................................................................................76
Selecting the Daypart Focus of the Report.........................................................................................................76
Selecting the Demographic Focus......................................................................................................................77
Stations Selection...............................................................................................................................................77
Configuring the Station Roster...........................................................................................................................77
Combos ..............................................................................................................................................................77
Geography..........................................................................................................................................................77
Maximi$er/MediaPro .........................................................................................................................................77
Spot Starting Value/Increment—Step-up amount and Number of Times ..........................................................78
The Spot Rank Table ..............................................................................................................................................78
Printing a Spot Based Table ...................................................................................................................................78
Frequency Based Table......................................................................................................................................79
Establishing the Parameters of the Report ..............................................................................................................79
Market Selection ................................................................................................................................................79
Survey Selection ................................................................................................................................................79
Selecting the Daypart Focus of the Report.........................................................................................................79
Selecting the Demographic Focus......................................................................................................................80
Stations Selection...............................................................................................................................................80
Configuring the Station Roster...........................................................................................................................80
Combos ..............................................................................................................................................................80
Geography..........................................................................................................................................................80
Maximi$er/MediaPro .........................................................................................................................................80
Frequency Starting Value/Increment—Step-up Amount and Number of Times................................................81
The Frequency Rank Table.....................................................................................................................................81
Printing a Frequency Based Table ..........................................................................................................................81
BenchMark.........................................................................................................................................................82
Establishing the Parameters of the Report ..............................................................................................................82
TAPSCAN and the TAPSCAN design are trademarks and registered marks of TAPSCAN, INC.
© 2001 Arbitron Inc. Used under license.
3
TAPSCAN – TABLE OF CONTENTS
Market Selection ............................................................................................................................................... 82
Survey Selection................................................................................................................................................ 82
Selecting the Daypart Focus of the Report ........................................................................................................ 82
Selecting the Demographic Focus ..................................................................................................................... 83
Stations Selection .............................................................................................................................................. 83
Geography ......................................................................................................................................................... 83
Maximi$er/MediaPro ........................................................................................................................................ 83
Combos ............................................................................................................................................................. 83
Designating the BenchMark Station and Bench Spot Level.............................................................................. 83
Designating Which Stations will be Graphed.................................................................................................... 83
The BenchMark Display ........................................................................................................................................ 84
Exclusive Cumes ............................................................................................................................................... 85
Establishing the Parameters of the Report.............................................................................................................. 85
Market Selection ............................................................................................................................................... 85
Survey Selection................................................................................................................................................ 85
Selecting the Daypart Focus of the Report ........................................................................................................ 85
Selecting the Demographic Focus ..................................................................................................................... 86
Stations Selection .............................................................................................................................................. 86
Combos ............................................................................................................................................................. 86
Configuring the Station Roster .......................................................................................................................... 86
Geography ......................................................................................................................................................... 86
Maximi$er/MediaPro ........................................................................................................................................ 86
The Exclusive Cumes Display................................................................................................................................ 87
Profiling a Station’s Audience ............................................................................................................................... 87
Printing an Exclusive Cume Ranker....................................................................................................................... 88
Multi-Market Ranker......................................................................................................................................... 89
Establishing the Report Parameters........................................................................................................................ 89
Station List ........................................................................................................................................................ 89
Selecting a Daypart ........................................................................................................................................... 89
Selecting a Demo............................................................................................................................................... 89
Selecting the Estimates...................................................................................................................................... 90
Default............................................................................................................................................................... 90
The TAPSCAN Ranker Display................................................................................................................................ 90
Printing a TAPSCAN Ranker.................................................................................................................................... 91
Batch Rankers ................................................................................................................................................... 92
Creating a Batch Ranker ........................................................................................................................................ 92
Market Selection ............................................................................................................................................... 93
Survey Selection................................................................................................................................................ 93
Selecting the Daypart Focus of the Report ........................................................................................................ 93
Selecting the Demographic Focus ..................................................................................................................... 93
Stations Selection .............................................................................................................................................. 93
Configuring the Station Roster .......................................................................................................................... 94
Combos ............................................................................................................................................................. 94
Geography ......................................................................................................................................................... 94
Maximi$er/MediaPro ........................................................................................................................................ 94
Qualitative Adjustments .................................................................................................................................... 94
Print Top ........................................................................................................................................................... 94
Estimates ........................................................................................................................................................... 95
Printing (Running) a Batch Ranker ........................................................................................................................ 95
Saving a Batch Ranker Configuration .................................................................................................................... 95
Retrieving a Batch Ranker Configuration .............................................................................................................. 96
Chapter Six: Schedulers
4
Introduction ....................................................................................................................................................... 99
ReachMaster &................................................................................................................................................ 100
TAPSCAN - TABLE OF CONTENTS
Multi-Market Wizard .......................................................................................................................................100
Setting the Parameters of the Schedule (ReachMaster Setup Wizard)..................................................................100
Start Tab...........................................................................................................................................................100
Header Tab.......................................................................................................................................................103
Stations Tab .....................................................................................................................................................104
Dayparts Tab....................................................................................................................................................105
Goals Tab.........................................................................................................................................................106
Estimates Tab...................................................................................................................................................109
Finish ...............................................................................................................................................................110
The ReachMaster Scheduling Worksheet .............................................................................................................110
Windows’ Task Bar Menu Options..................................................................................................................110
Flighting in ReachMaster .................................................................................................................................112
Cloning One Station’s Schedule to Another.....................................................................................................112
Copy Weeks Option .........................................................................................................................................112
Toggling Stations On and Off ..........................................................................................................................113
Billboarding .....................................................................................................................................................113
Allow Ratings Changes ....................................................................................................................................114
Spot Goaling ....................................................................................................................................................115
On-the-fly Schedule Goaling............................................................................................................................116
Saving and Retrieving Daypart Lists................................................................................................................116
Scheduling Window’s Display Tabs ................................................................................................................117
Spectrum Analysis ................................................................................................................................................118
The Snapshots & View Options .......................................................................................................................119
E-commerce ..........................................................................................................................................................119
Printing a ReachMaster Schedule .........................................................................................................................121
Generating a Broadcast Order from a Schedule....................................................................................................123
Saving & Retrieving a ReachMaster Schedule .....................................................................................................123
Saving a Schedule ............................................................................................................................................123
Loading (Retrieving) a Saved Schedule ...........................................................................................................123
SalesSCAN Interface ............................................................................................................................................124
Reach Curves ...................................................................................................................................................126
Establishing the Parameters of the Report ............................................................................................................126
Market Selection ..............................................................................................................................................126
Book Selection .................................................................................................................................................126
Selecting the Daypart Focus of the Report.......................................................................................................126
Selecting the Demographic Focus....................................................................................................................127
Geography........................................................................................................................................................127
Maximi$er/MediaPro .......................................................................................................................................127
Combos ............................................................................................................................................................127
Selecting the Reach Curve’s Station Focus......................................................................................................127
The Reach Curves Display....................................................................................................................................128
Broadcast Orders..............................................................................................................................................129
The Broadcast Order Toolbar ...............................................................................................................................130
Broadcast Orders Setup ........................................................................................................................................131
Advertising Agency Setup................................................................................................................................131
Radio Station Setup..........................................................................................................................................132
Broadcast Orders Agency & Radio Station Database ...........................................................................................133
Radio Stations’ Database .................................................................................................................................133
Agency Database..............................................................................................................................................133
Creating a Broadcast Order...................................................................................................................................134
Top Menu Bar Options ....................................................................................................................................135
Printing a Broadcast Order ...................................................................................................................................135
The Broadcast Orders Tab ...............................................................................................................................136
Calendar Report ...............................................................................................................................................136
Totals ...............................................................................................................................................................136
TAPSCAN and the TAPSCAN design are trademarks and registered marks of TAPSCAN, INC.
© 2001 Arbitron Inc. Used under license.
5
TAPSCAN – TABLE OF CONTENTS
Accounting & Traffic Interfaces .......................................................................................................................... 137
Ad Aid............................................................................................................................................................. 137
Ad Input .......................................................................................................................................................... 137
Adman ............................................................................................................................................................. 137
Admark............................................................................................................................................................ 138
AdWare ........................................................................................................................................................... 138
CBSI................................................................................................................................................................ 139
Clients & Profits.............................................................................................................................................. 139
Control G......................................................................................................................................................... 140
Custom One..................................................................................................................................................... 140
Datatech........................................................................................................................................................... 140
J.D.S. ............................................................................................................................................................... 141
Silent Partners ................................................................................................................................................. 141
Setting Up a Post.................................................................................................................................................. 143
Automatically Setting Up a Post...................................................................................................................... 143
Manually Setting Up a Post............................................................................................................................. 143
Posting Screen...................................................................................................................................................... 144
Post Tab .......................................................................................................................................................... 144
Reconcile tab ................................................................................................................................................... 145
Comparative Summary .................................................................................................................................... 145
Printed reports...................................................................................................................................................... 145
Rate and Revenue............................................................................................................................................ 146
Establishing the Parameters of the Report............................................................................................................ 146
Market Selection ............................................................................................................................................. 146
Book Selection ................................................................................................................................................ 146
Selecting the Daypart Focus of the Report ...................................................................................................... 146
Station Selection Box ...................................................................................................................................... 146
Cost Information.............................................................................................................................................. 147
The Rate and Revenue Display ............................................................................................................................ 147
Chapter Seven: Composition
Introduction ..................................................................................................................................................... 151
Composition Commander................................................................................................................................ 152
Establishing the Parameters of the Report............................................................................................................ 152
Market Selection ............................................................................................................................................. 152
Survey Selection.............................................................................................................................................. 152
Selecting the Daypart Focus of the Report ...................................................................................................... 153
Stations Selection ............................................................................................................................................ 153
Configuring the Station Roster ........................................................................................................................ 153
Combos ........................................................................................................................................................... 153
Geography ....................................................................................................................................................... 153
Maximi$er/MediaPro ...................................................................................................................................... 153
Selecting the Base Demo................................................................................................................................. 153
Selecting the Rank Demo ................................................................................................................................ 154
Defining the Age Cell Breakout per Column .................................................................................................. 154
The Composition Commander Display ................................................................................................................ 154
Table Data Format---Persons vs. Percentages & Average vs. Cume............................................................... 155
Printing a Composition Commander Report ........................................................................................................ 155
Demographic Profiles...................................................................................................................................... 156
Establishing the Parameters of the Report............................................................................................................ 156
Market Selection ............................................................................................................................................. 156
Survey Selection.............................................................................................................................................. 156
Selecting the Daypart Focus of the Report ...................................................................................................... 156
Geography ....................................................................................................................................................... 156
Maximi$er/MediaPro ...................................................................................................................................... 157
6
TAPSCAN - TABLE OF CONTENTS
Selecting the Estimate-base of the Profile........................................................................................................157
Combos ............................................................................................................................................................157
Selecting the Station to Profile.........................................................................................................................157
The Demographic Profile Display ........................................................................................................................157
Population Profiles...........................................................................................................................................158
Establishing the Parameters of the Report ............................................................................................................158
Market Selection ..............................................................................................................................................158
Survey Selection ..............................................................................................................................................158
Geography........................................................................................................................................................158
Maximi$er/MediaPro .......................................................................................................................................158
Selecting the Daypart Focus of the Report.......................................................................................................159
The Population Profile Display.............................................................................................................................159
Chapter Eight: Hour-by-Hour Analysis
Introduction......................................................................................................................................................163
Establishing the Parameters of the Report ............................................................................................................163
Market Selection ..............................................................................................................................................163
Survey Selection ..............................................................................................................................................163
Selecting the Demographic Focus....................................................................................................................163
Geography........................................................................................................................................................163
Combos ............................................................................................................................................................164
Selecting the Station Focus ..............................................................................................................................164
Configuring the Day Display............................................................................................................................164
Hour-by-Hour Display ..........................................................................................................................................164
Chapter Nine: Trenders
Introduction......................................................................................................................................................167
TAPTrend ........................................................................................................................................................168
Establishing the Parameters of the Report ............................................................................................................168
Market Selection ..............................................................................................................................................168
Selecting the Demographic Focus....................................................................................................................168
Geography........................................................................................................................................................168
Combos ............................................................................................................................................................169
Selecting the Station Focus ..............................................................................................................................169
Selecting the Daypart Focus of the Report.......................................................................................................169
Estimate Selection............................................................................................................................................169
Base Book Selection ........................................................................................................................................170
Book Selection .................................................................................................................................................170
The TAPTrend Display.........................................................................................................................................170
Printing a TAPTrend Report.................................................................................................................................170
Multi-Trend......................................................................................................................................................171
Establishing the Parameters of the Report ............................................................................................................171
Market Selection ..............................................................................................................................................171
Selecting the Daypart Focus of the Report.......................................................................................................171
Selecting the Demographic Focus....................................................................................................................171
Geography........................................................................................................................................................172
Stations Selection.............................................................................................................................................172
Configuring the Station Roster.........................................................................................................................172
Base Book Selection ........................................................................................................................................172
Book Selection .................................................................................................................................................172
The Multi-Trend Display ......................................................................................................................................172
Printing a Multi-Trend Report ..............................................................................................................................173
Batch Trenders.................................................................................................................................................174
Creating a Batch Trender......................................................................................................................................174
Market Selection ..............................................................................................................................................175
TAPSCAN and the TAPSCAN design are trademarks and registered marks of TAPSCAN, INC.
© 2001 Arbitron Inc. Used under license.
7
TAPSCAN – TABLE OF CONTENTS
Selecting the Daypart Focus of the Report ...................................................................................................... 175
Selecting the Demographic Focus ................................................................................................................... 175
Geography ....................................................................................................................................................... 175
Stations Selection ............................................................................................................................................ 175
Configuring the Station Roster ........................................................................................................................ 175
Combos ........................................................................................................................................................... 175
Base Book Selection........................................................................................................................................ 176
Print Top ......................................................................................................................................................... 176
Book Selection ................................................................................................................................................ 176
Printing (Running) a Batch Trender..................................................................................................................... 176
Saving a Batch Trender Configuration................................................................................................................. 177
Retrieving a Batch Trender Configuration ........................................................................................................... 177
Chapter Ten: Retail Spending Power
Introduction ..................................................................................................................................................... 181
RSP’s Setup Menu........................................................................................................................................... 182
Establishing the Parameters of the Report............................................................................................................ 182
Market Selection ............................................................................................................................................. 182
Book Selection ................................................................................................................................................ 182
Selecting the Daypart Focus of the Report ...................................................................................................... 182
Selecting the Demographic Focus ................................................................................................................... 182
Stations Selection ............................................................................................................................................ 183
Configuring the Station Roster ........................................................................................................................ 183
Combos ........................................................................................................................................................... 183
Selecting the RSP Category............................................................................................................................. 183
RSP Display .................................................................................................................................................... 184
RSP Reports .................................................................................................................................................... 185
Station Level Reports........................................................................................................................................... 185
RSP Category Profile Report for the Selected Station .................................................................................... 185
RSP Target Demographic Profile Report for Selected Station........................................................................ 186
RSP Bonus Spending Power Report (Pie) for the Selected Station................................................................. 186
RSP Rank Report ............................................................................................................................................ 186
RSP Age Profile Report for the Selected Station ............................................................................................ 186
RSP Category Report for the Selected Station ................................................................................................ 186
Market Level Reports........................................................................................................................................... 186
RSP Category Level Summary Report ............................................................................................................ 186
RSP Market Level Target Demographic Profile Report.................................................................................. 186
RSP Age Profile Report .................................................................................................................................. 186
Other Reports ....................................................................................................................................................... 186
Notes on RSP Methodology ............................................................................................................................ 187
List of Categories ................................................................................................................................................. 188
Chapter Eleven: Charting Reports & Customizing Presentations
Introduction ..................................................................................................................................................... 193
Present IT Presentation Builder ...................................................................................................................... 194
Getting Started—The Start Tab ........................................................................................................................... 194
Cover Sheet Tab................................................................................................................................................... 195
The Remaining Tabs ............................................................................................................................................ 196
Report Header Selection.................................................................................................................................. 197
Cover Sheet ..................................................................................................................................................... 198
Accessing RAB’s Instant Background Data .................................................................................................... 199
Charting a TAPSCAN Report ............................................................................................................................ 200
Chart Examples .................................................................................................................................................... 201
8
TAPSCAN - TABLE OF CONTENTS
Chapter Twelve: Media Terms & Calculations
Glossary ...........................................................................................................................................................207
Media Calculations ..........................................................................................................................................215
Chapter Thirteen: Trouble Shooting
Solutions to Common Problems.......................................................................................................................219
TAPSCAN and the TAPSCAN design are trademarks and registered marks of TAPSCAN, INC.
© 2001 Arbitron Inc. Used under license.
9
Chapter One:
Introduction,
Installation &
Initialization
TAPSCAN User Manual
Introduction
This manual is written to accommodate the latest version of the TAPSCAN Ratings Analysis System—TAPSCAN®.
As you work within TAPSCAN, on-line help is as close as a click of the mouse. Clicking the Help button or pressing
F1 will bring the Help menu to screen with all available topics from which you may research.
Manual and System User Tips
The following are some tips that will enable you to move about the system easily and efficiently, and get the most out
of TAPSCAN:
We hope these tips will help you when working within TAPSCAN; however, if you encounter any stumbling
blocks, please contact Customer Service.
Obtaining Product Application and Technical Assistance
We are working hard to provide you with intuitive ratings analysis software. Additionally, we strive to provide
superior online and print documentation to enable you to work independently in creating the various reports.
However, should you find yourself with a situation that cannot be resolved—or a question that cannot be answered
with the provided tools, please contact our Customer Service Department. All of our support representatives are
eager to assist you.
E-mail
Ask questions and receive detailed answers from the Customer Service Team. Just send electronic mail to
the account listed below. You will receive a reply by e-mail.
[email protected]
Fax
You can fax questions or comments to Customer Service. Simply send a fax to the number listed below.
TAPSCAN Customer Service Fax: 205-977-6214
Telephone
You can talk directly to a Customer Service Representative by phone 24/7. When you call, please be at
your computer.
Customer Service Hotline: 800-543-7300
TAPSCAN and the TAPSCAN design are trademarks and registered marks of TAPSCAN, INC.
© 2001 Arbitron Inc. Used under license.
13
Chapter Two:
Setup &
Utilities
TAPSCAN User Manual
Setup
The Setup portion of TAPSCAN houses essential system configuration settings.
To access this area, click the Setup button on the TAPSCAN toolbar, and the Defaults window will appear—
alternatively, you may click Utilities and select Setup:
Note that this area of TAPSCAN is sectioned in layers, or tabs. Setup’s display will automatically display the Default
Settings tab. To switch to another tab’s display, click on the corresponding tab of area of Setup you wish to enter:
Default Settings
This area of Setup is where you will find settings such as Multiple Users…and other important options that
will determine the way information and options are displayed throughout TAPSCAN.
Data Setup
This portion of Setup houses all options pertaining to the data defaults and data management.
Report Setup
This is where you will go to configure the design for all printed reports.
Path Settings
Enter this area of the system to establish paths to specific data (Instant Backgrounds), relevant systems
(SalesSCAN & Word) and to your Inbox.
Daypart Codes
Create daypart codes used in Schedule Goals in ReachMaster. You may also set up Custom Daypart Names
from this section as well.
TAPSCAN and the TAPSCAN design are trademarks and registered marks of TAPSCAN, INC.
© 2001 Arbitron Inc. Used under license.
17
SETUP AND UTILITIES
Default Settings
This portion of the TAPSCAN System houses important settings that will have an impact on how data is displayed on
the screen. Upon entering the Setup portion of TAPSCAN, this tab will be the displayed.
User Data
This portion of the Defaults Setup screen reflects if the system is currently configured to accommodate
multiple users, and if so, how many logins the current user has accrued thus far.
Options
Configure TAPSCAN for Multiple Users
TAPSCAN may be configured as a multiple user system (required for networks). Choose this option and you
will be asked if you would like to operate TAPSCAN as a multiple user system. Click Yes, and you will be
warned that the system will have to restart. Click Yes again and you will be informed that you must add at
lead one user to the list before entry into the system. Click OK and the following window will appear:
Enter the name and initials of the first user then click OK. The TAPSCAN User Sign On menu will then
open:
You may now log in as the new user, or Add, Change or Delete users from the list. The user list will now
appear every time TAPSCAN is launched.
Show Master Menu upon opening
If you want the TAPSCAN Master Menu to be displayed rather than just the TAPSCAN Task Bar, check this
field. Upon re-entering the system this option will be activated.
Disable Exit warning upon closing TAPSCAN
Typically, upon exiting the system, you will be asked Do you wish to exit TAPSCAN now?--Yes/No. If this
option is turned on, there is no confirmation option and the system will close automatically.
Always have Combos on
If you want the system to default to automatically having station combos turned on, check this box.
Always have Pseudonyms on
If you want the system to default to using any stored station pseudonyms throughout the system in place of
the station call letters, place an “X” in this box.
Always have Custom Daypart Names on
If you want the system to default to using any stored custom daypart names throughout the system in place
of the customary day/time composure, place an “X” in this box.
18
TAPSCAN User Manual
Always export saved ReachMaster schedules to MediaMaster
If you will always export your saved ReachMaster schedules to MediaMaster, place an "X" in this box and the
system will bring up the export option in ReachMaster for you automatically rather than having to manually use
the File/Export option.
Always export saved ReachMaster schedules to SalesSCAN
If you will always export your saved ReachMaster schedules to SalesScan/Control Tower, place an "X" in this
box and the system will bring up the export option in ReachMaster for you automatically rather than having to
manually use the File/Export option.
Always update local client database from network
Since your client database is stored on the same drive where Tapscan is located, if you are using a network and
then disconnect from it, Tapscan can no longer retrieve client database information. You can tell Tapscan to
always save a copy of the client database to your computer each time you exit Tapscan. To enable this feature,
select the "Always update local client database from network' box. Edit client information only when connected
to your network. Otherwise, your changes will not be saved.
Configuration: Radio/Agency
This area of the Options box indicates the mode of operation in which TAPSCAN is configured. How the
system is configured will determine how some of the screens throughout the system will be displayed.
Data Setup
This area of Setup is where you may set the data defaults and perform various data management tasks. Click on the
Data Setup tab and the following window will appear:
Data Defaults Area
These settings will determine the
configuration
each
reports
corresponding setup window.
Data Management Options
The buttons located in this area of Data
Setup
allow
you
to
perform
miscellaneous task that will enhance
various aspects concerning the data on
which TAPSCAN operates.
Data Defaults
Data Drive
Stores the drive setting where the TAPSCAN data is stored. To change this setting, click the arrow key of
this field, then select the appropriate drive. The system will then search the new drive destination for the
TAPDATA subdirectory.
Default Market
If you are using multiple markets, you may change the market to which the system will automatically default
by clicking on the arrow key of this field, then making the correct modification
TAPSCAN and the TAPSCAN design are trademarks and registered marks of TAPSCAN, INC.
© 2001 Arbitron Inc. Used under license.
19
SETUP AND UTILITIES
Default Book
To change the book to which the setup window will automatically default, click the arrow key of this field.
A listing of all available books for the current market will then be displayed. Double-click on the desired
book; alternatively, you may single-click on that line then click OK.
Demo Button
To change the target demographic to which the reports’ setup window will default, click the Demo button.
The Demo Selection window will then appear. Select the demo in one of the following ways:
Click on the desired gender, start age, end age, then click OK;
Double-click on a demo in the list of demos in the Favorite Demos window.
Qualitative Data
This setting is where you will select the path where the QualiTAP or TargetOne qualitative data resides.
Data Management
Creating an Average (book)
This is where you can create an averaged book (book where several surveys have been averaged together).
Click this button and the Create Average window will then be displayed:
Selecting the Books to Average
You may average up to four books. Make your book
selection in one of the following ways:
• If the books you wish to average are listed in a
contiguous order, drag the cursor over those books, then
select Add;
• If the books are not listed in contiguous order, click on
each of the different components while pressing the
Control key. Afterwards, click the Add button.
Once the books to be averaged have been selected, click the Create Average button.
Creating Combos
Station combos may be created, deleted, edited and turned on/off at any place throughout the system where
there is a Combos button or selection. Click on Combos and the Setup Combos window appears.
Use/Don't Use Combo Options
Click on Use Combos for this Run to
include them in your analysis. Click on
Don't Use Combos for Run to turn them
off.
20
Combos Pages Window
• This area of Combos Setup displays information about each combo page.
• The “#” column represents the number of the combo page, as recognized by TAPSCAN.
• The Combo Page Name displays the name of the combo page. You may customize the
name of a combo page by clicking the Name Page button.
• The Count column displays how many different combo combinations are included on the
corresponding combo page.
TAPSCAN User Manual
Clone Page Button
This option lets you copy, or “clone,” a
combo page. Highlight the combo page to be
copied and click this button. You will then
be prompted to enter the page number where
the newly cloned combo page will reside.
Input that number and click the OK button.
Highlight the combo page you want to be
the default when combo pages are turned
on, then place an X in the Default Page
field.
Combos Window
This area displays the created combos contained
within the highlighted combo page.
Use these buttons to establish the actual
combos of the corresponding Combo Page.
See the below table for an explanation of
each button.
Button
Name Page
Action
Clone Page
This option lets you copy, or clone, as combo page. Highlight the combo page to be copied and click
this button. You will then be prompted to enter the page number where the new combo page will
reside. Enter that number, then click the OK button.
Add Combo
Click this button to add a combo to the currently highlighted Combo Page. This will bring the Create
a Combo window to screen:
At this window, identify each station to be included in this
combo by highlighting each, then clicking Add. Once all
stations have been selected, give the combo a name in this
window’s Name field. Remove selected stations by
highlighting each selected item and clicking Delete. There is
no limit to the number of stations that can be included in a
combo. Click OK once the correct combo configuration has
been obtained. You will then be taken back to the Setup
Combos window where you will see that combo and its
components displayed in the Combos box.
Delete Combo
To delete a combo from the currently highlighted Combo Page, highlight that line and click Delete.
Name Combo
If you would like to rename a combo, highlight that line and click this button. You may assign a name
of 15 characters or less.
Clear Combo
Clicking this button will IMMEDIATELY erase all combos from the highlighted Combo Page.
Click this button to change the name of the currently highlighted combo page.
Download Button
Download books into the system using this option. Once you click this button, you will be brought to
TAPSCAN’s Download Wizard. See Chapter One for a walk-through of this process.
Delete Button
To delete a book from the TAPSCAN data subdirectory, click this button. A listing of all books currently
loaded into the system will appear. Single-click on the book you wish to delete, then click Delete. If you
have multiple markets and want to delete a specific survey from all the markets you have, you can save time
by clicking on the box next to Delete selected book(s) from all markets.
TAPSCAN and the TAPSCAN design are trademarks and registered marks of TAPSCAN, INC.
© 2001 Arbitron Inc. Used under license.
21
SETUP AND UTILITIES
Report Setup
The Report Setup tab allows you to specify certain settings for printing in TAPSCAN.
This option allows you to customize your printed reports with a graphical “TAPSCAN” logo that will print at
the bottom of the report.
Fine-tune
the
report
display
configuration by turning on all desired
options. Do this by placing an “X” in
each option you wish to turn on.
You have the choice between using the default
(Standard) header that will result in "TAPSCAN"
being printed in the top-left corner of all reports, or
using a custom bitmap of your company's logo. To
use a custom bitmap, click on the Bitmap button.
When you make this selection, a Bitmap Directory
button will appear. Click on this button to select the
path that contains your custom bitmap. Now click
on the down arrow of the field above and a drop
down list will appear listing all the bitmap files that
are 16 colors or less, in the selected directory. Click
on the appropriate file and the system will establish
this as the header bitmap. To make selection easier,
the bitmap image will be displayed as a file is
Click on the option you wish to use, then click OK.
Path Settings
This is the area of the system where you will establish paths to other data and systems.
Button
Download Directory
Function
M Street Data
Holds the path to the M Street data. To set or change this path, click on this button then
select the correct drive and directory.
Inbox
The Inbox feature of TAPSCAN will allow you to store data in a compressed format. This
will enable you to store historical data in a smaller amount of less hard disk space than if
stored in the TAPSCAN data directory.
This is the directory into which data is downloaded. This is usually set to the TAPSCAN
Data Directory (tapdata/three digit market code). If you wish to change this, click this
button and make the appropriate edit.
Upon the initialization of the TAPSCAN System, the system will check the Inbox to see if a
compressed file resides in that directory. If a file is found, you will be given the
opportunity to download that file(s):
To download the file, click the Install Data Now button and you will be taken to the
Download Wizard where you will download the data. Clicking Keep Going will not
22
TAPSCAN User Manual
download the file, nor will it remove the file from the Inbox.
Instant Background
If you subscribe to the Instant Background data, you will set the path to that data by
clicking this button. Select the correct drive and directory by either double-clicking on
each, or single-clicking on each then clicking the OK button.
MediaMaster
If you lease the MediaMaster system from TAPSCAN, set the path for the system with this
button. Select the correct drive and directory by either double-clicking on each, or singleclicking on each then clicking the OK button.
Microsoft Word
Directory
This is where you establish the path to Microsoft’s Word directory. Just as when setting
any of the above paths click this button. Then select the correct drive and directory by
either double-clicking on each, or single-clicking on each then clicking the OK button.
If you are configured for a Radio Station, there will be two paths included that are not applicable to
agencies:
Holds the path to your SalesSCAN data. To set or change this path, click on this
SalesSCAN Directory
button then select the correct drive and directory by either double-clicking on each,
or single-clicking on each then clicking the OK button. This path must be set to
import clients for ReachMaster or to export schedules and orders.
GridONE Directory
E-Commerce Directory
If you lease the GridONE system from TAPSCAN, this is the path to your GridONE
system files. Select the path as with the others. This path must be set to use the
GridONE interface with ReachMaster.
This path should point to the tapwin folder where Tapscan is installed. See the Ecommerce section in Chapter 6 to learn how to setup this feature.
Daypart Codes
This section of setup establishes the dayparts to be used in the Schedule Goals option in ReachMaster.
Add brings up the Daypart
Selection window. Then enter a
code and a name.
Assign brings up the Custom Daypart
Name window. You do not have to
assign dayparts to use the Schedule
Goals option in ReachMaster.
TAPSCAN and the TAPSCAN design are trademarks and registered marks of TAPSCAN, INC.
© 2001 Arbitron Inc. Used under license.
23
SETUP AND UTILITIES
Utilities
The Utilities portion of TAPSCAN houses other important system settings (including some of the same options
available at the Setup window). To access this area of the system, click the Utilities option listed directly on the
Windows’ menu bar. This will open the menu of all available Utilities options:
Highlight the area of Utilities you wish to enter.
Download Data
This is where you download books into TAPSCAN. After selecting this option, the Download Wizard will appear:
TAPSCAN will proceed to the Download Wizard; this is where you will identify where data will be stored and
download all survey books (TAPSCAN will support multiple data drives as well as multiple markets placed on the
same drive.) If you have different markets assigned to individual users, you may wish to store each individual user's
markets on unique drives.
IMPORTANT: If the desired drive is a network drive, the user establishing the data drive for the
first time must have RIGHTS to create files on that drive's root directory.
The Download Wizard will walk you through each step of the downloading process.
Identifying Where the Data is…
Step one will be to identify the drive that contains the data disk. Do
this in one of the following ways:
• If the data disk is loaded into drive A, click the Drive A button.
• If the data disk is loaded into the B drive, click the Drive B button.
• If the data is loaded on a different drive, such as a network drive, or
if downloading from your TAPCONNECT download directory
(tapcon\download), click the Browse button, identify the drive
and directory where the data resides, then click the OK button.
After you have made the correct response, the system will list all surveys available for downloading in the middle
portion of the Download Wizard window. Identify the survey(s) to be downloaded in one of the following ways:
Highlight the survey you wish to download then click the Next button;
If more than one survey is listed and you wish to download all, click on Select All, then click Next;
If more than one survey is listed and you wish to select multiple books that are listed consecutively,
click on the first selection, and while holding down the mouse button, drag the cursor over the other
consecutively listed selections. Click Next once you are done;
24
TAPSCAN User Manual
If more than one survey is listed and you wish to select multiple books that are NOT listed in
consecutive order, click on the first selection, then, holding down the Control key, single-click on
each other desired selection. Afterwards, click the Next button.
The next window is where you identify the type of data being loaded and enter the path where it will be stored.
The Store Data portion of the Download Wizard controls if and, if so, how the data is stored. More than likely, you
will want to keep the default of both options being selected since this is the most efficient way to save data and all
corresponding files.
Market Organizer
The system installation program defaults to this option being selected. The use of Market Organizer is
strongly recommended for the most successful transfer and organized storage of multiple market’s data.
Market Organizer refers to having all data located in one central directory. Within the TAPSCAN/DATA
subdirectory, each market’s data will be housed in a unique subdirectory identified (named) by the three
unique numerical digits of its market code. If you subscribe to one market, this option should not be used—
remove the check mark.
Store Data
This option lets you store or back-up the actual data file(s) which you are downloading. Using this option is
the exact same as storing data on a data disk; however, instead of using the physical disk, you will be
storing the file(s) onto a drive and directory. Note: This option is for the storage of ratings book files only,
not saved data such as Packages and Orders. Also, these files are stored in the same manner as when they
are shipped (a compressed file). If you use TapConnect and download from the C:\tapcon\download, DO
NOT use that path to store data.
Erase files after download (hard drives only)
This option does not effect you if you are NOT downloading data from another internal drive such as a
network drive or a TAPCONNECT download directory such as tapcon\download. If this option is
activated, upon completion of downloading data into your TAPSCAN data subdirectory, the system will
erase the parent file.
For example: Let’s say I am downloading a file (which contains a ratings book) from the TAPCONNECT
server to my computer’s c:\tapconnect\download subdirectory.
After the transfer is complete, I will then have a “Zip” file (a compressed file containing multiple files
within itself) residing within my computer’s c:\tapcon\download subdirectory. As it stands, this compressed
file is a non-viable file (not usable). It will stay this way until its contents are extrapolated (decompressed).
So now I download this information from the c:\tapcon\download subdirectory into my TAPSCAN data
subdirectory. Now I have the viable, workable data loaded into my TAPSCAN data subdirectory, as well as
the compressed file that still resides in my c:\tapcon\download subdirectory. At this point, this file is simply
taking up valuable disk space. If this option is turned on, this compressed file will be erased upon
completion of downloading its contents into TAPSCAN. THIS OPTION WILL NOT ERASE ANY FILES
CONTAINED ON AN EXTERNAL DISK (disk contained within the A or B drive). If you wish for the
TAPSCAN and the TAPSCAN design are trademarks and registered marks of TAPSCAN, INC.
© 2001 Arbitron Inc. Used under license.
25
SETUP AND UTILITIES
compressed file to be stored, use the Store Data option activated on this screen. Establishing a Store Data
directory is highly recommended for TapConnect clients.
Once you are ready to download the files(s), click Download. The survey(s) will then be copied into your data
subdirectory. Repeat this procedure for all the books and/or markets that you desire to install.
Note: Use the TapMedia button when you want to download new surveys from the TapMedia Web site. After
downloading, click the Refresh button to list the new surveys.
Create Average
This is where you can create an averaged book. (Same as selecting the Create Average option within Setup—Data
Defaults.)
Click this button and the Create Average window will then be displayed:
Selecting the Books to Average
You may average up to four books. Make your book selection in
one of the following ways:
If the books you wish to average are listed in a contiguous
order, drag the cursor over those books, then select Add.
If the books are not listed in contiguous order, click on each
of the different components while pressing the Control key.
Afterwards, click the Add button.
Once the books to be averaged have been selected, click the Create Average button.
Setup
Selecting this option will bring you to the TAPSCAN Defaults window:
Please refer to the previous Section in this chapter, Setup, for a complete walk-through of all options available in this
portion of TAPSCAN.
Pseudonyms
This portion of TAPSCAN is where you can assign pseudonyms (nick-names) to be used in place of radio station call
letters. For example, station KIII-FM may be renamed to The EDGE.
After choosing this option, the Station Pseudonym Setup window will appear:
26
TAPSCAN User Manual
The Original column reflects the station’s actual call letters as they are
listed in the ratings book. The Pseudonym column lists how the
station will be listed on TAPSCAN reports when this options is turned
on.
Click OK once you are finished making all revisions to the Station
Pseudonym setup. Clicking Cancel will erase all unsaved work.
Use these buttons to perform all maintenance to the
Pseudonym database.
Button
Add
Functions
To add a station Pseudonym, click Add. The Customize Station Name window will then
appear:
If you need to modify the market or station, click the arrow key in that field and make the
appropriate selection. Click the arrow next to the station field and a listing of all stations will
appear. Select your station, then type in the desired name to be used in the Pseudonym field.
Click OK and the station and its corresponding pseudonym will be added to the list.
Delete
If you want to delete a previously entered Pseudonym, highlight that line and click Delete.
Clear
Clicking this button will immediately erase all recorded pseudonyms.
“Use Pseudonyms on
All Runs”
With this option turned on, all pseudonyms will be used throughout TAPSCAN rather than the
former call letter counterparts. Place an X in this field’s box to activate this option.
Client Stations
This option will allow you to identify the station to be highlighted on the screen and on the printed reports. Choose
this option and the Establish Client Stations window will appear:
Make the appropriate market and book selection by clicking on each field’s arrow key.
The client station assignments will only be valid for the established market and book.
Host Stations Box
The area will list all stations designated as the Host or
focal point of each report. You may change these
assignments as needed by using the buttons listed in this
area of the window.
Choose the client stations to use as the focus of the various reports (referred to as the Host station{s}) by either
double-clicking on each of the station from the station roster, or by highlighting the station on the roster and clicking
the Add button. To remove a station from the Host Stations box, highlight the station (in the Host box) and click
Delete. Clicking Clear will remove all selected Host Station designations.
Click OK once you have completed your work.
TAPSCAN and the TAPSCAN design are trademarks and registered marks of TAPSCAN, INC.
© 2001 Arbitron Inc. Used under license.
27
SETUP AND UTILITIES
Daypart Names, Codes and Rates
You now have the option of customizing the names of specific dayparts such as Morning Drive Time, Total Week,
and so forth. Once in place and activated, these may be used within the following programs:
Ranking Summaries
Demographic Profiles
ReachMaster
Reach Curves
TAPTrend
Broadcast Orders
After selecting the Daypart Names, Codes and Rates option from the Utilities menu, the Daypart Name Setup
window will be displayed:
Daypart—The daypart to be renamed
Identifies which daypart will be renamed, then
replaced with the “New Daypart Name” designation.
New Daypart Name
What the newly revised daypart will be referred
to when the Daypart Names option is turned on.
Station—The station assignment
Displays the station to which the
newly named daypart will be
attached
“Use Active Custom Names…”
Option
If you wish for the system to default
to the custom daypart names being
turned on, place an X in this field’s
box.
Code
These codes will be used in
the Schedule Goals option
in ReachMaster.
Rate
Enter rates to be loaded
into ReachMaster.
If any dayparts have previously been renamed, they will be listed on this window. Use the buttons located on the
right of this window to perform the various actions.
Adding a Daypart Name
Click the Add button and the Customize Daypart Name window will be opened:
“Market,” “Book” and “Station” Fields
All customized daypart names are market,
book and station specific. This means you
must identify the specific market, book and
station to which this daypart name will be
assigned.
Make these assignments by
clicking on the key found in the right portion
of each of these fields, scrolling until the
correct selection appears, then single-clicking
on that line.
Click the Daypart button so that you may identify the daypart. Once back at the Customize Daypart Name
window, type the name by which you would like this daypart to be known in the Daypart Name field, then
click the OK button. You will be brought back to the Daypart Name Setup window where that customized
daypart will now be listed. You will continue to define all daypart names for each station, each book and
each market that you wish to customize in this same manner. Once all daypart names you will be ready to
use the daypart names in the above mentioned modules; however, before you exit the Daypart Name Setup
window, make sure the Use active custom daypart names on all runs box is checked.
Editing a Daypart Name
If you wish to edit a previously entered daypart name, click on the line you wish to edit and select Edit.
This will open the Customize Daypart Name window. Highlight the field you wish to modify and make the
appropriate edit. Click the OK button once all edits have been made.
28
TAPSCAN User Manual
Deleting a Daypart Name
To delete a previously entered daypart name, highlight the entry you wish to erase and click the Delete
button. The entry will then be removed from the Daypart Names listing.
Clearing the Daypart Names List
If you wish to delete all daypart names on the Daypart Names listing, simply click the Clear button;
however, keep in mind, ALL DAYPART NAMES WILL IMMEDIATELY BE DELETED.
Once all daypart name customizing is complete, click the OK button. You will then have access to those customized
daypart names upon entering any of the modules that recognize customized daypart names and selecting a station and
survey to which customized daypart names are attached.
Manual Adjustments
If you would like to import qualitative or ethnic factors from another source other than QualiTAP or Target ONE,
you may manually input that into the system then incorporate those factors into most TAPSCAN reports via the
Manual Adjustments option. Please refer to the next chapter of this manual, Qualitative Adjustments for a walkthrough of how to create a Manual Adjustment.
Non-Rated Stations
You can add a station not included in the ratings data for scheduling purposes in ReachMaster. When you select this
option, the Non-Rated Stations window appears. From this screen you will select the market to which the station will
be added. Select add, edit, delete and clear to perform station maintenance.
Click Add and the Non-Rated Station Data window will
appear. For each station you need to enter a name (either a
pseudonym or the call letters), the call letters and band
indicator. You will also have to assign dayparts for which the
station will be available.
Click Edit and the Non-Rated Station Data window will
appear. Click on the field of information you want to edit, or
use the add/delete buttons for dayparts.
To remove a station from the roster, highlight that station and
click Delete. To remove all the stations, click Clear.
Click Close to exit.
Adding a Station
Click Add and the Non-Rated Station Data window will appear:
For each station you need to enter a name (this can be either a
pseudonym or the station’s call letters) and the call letters and
band indicator.
You will have to assign dayparts for which the station will be
available. Add them individually or you may use the daypart
lists you have saved with the Load List button.
Click OK once you have entered all the information to return to the Non-Rated Stations window and the new
station will be listed. Click Cancel to return to the Non-Rated Stations window without adding the station.
TAPSCAN and the TAPSCAN design are trademarks and registered marks of TAPSCAN, INC.
© 2001 Arbitron Inc. Used under license.
29
Chapter Three:
Qualitative
Adjustments
TAPSCAN User Manual
Qualitative Adjustments
You may incorporate qualitative characteristics into virtually any report within TAPSCAN. This portion of the manual
focuses on how to establish these factors. You will select the particular adjustment you wish to use for each report at
the report’s setup menu—Adjustments or Qualitative button.
Adjustments from QualiTAP
If you want to use data from QualiTAP, you must have that qualitative data stored within a QTDATA subdirectory.
To access the area of the system where you will build the qualitative adjustments, go to any report that has an
Adjustments or Qualitative button at its setup menu, click that button, then select the QualiTAP button. The
Criteria Setup screen will then be displayed:
Selecting the Qualitative Category(s)
The first step in building criteria is to identify the desired classification. Do this by single-clicking on that
line. To scroll through the various classifications, use the up and down arrow keys, located on the right side
of the classification window.
Once you have made your classification selection, you will see the category fields reflect those qualitative
aspects that are contained therein. Now single-click on the category question (top portion of the category
box) which contains the qualitative characteristics you wish to include in the qualitative definition. Once
the lower category window displays the desired criteria, you will be ready to make the actual criteria
selections. Do this in one of the following manners:
Double-click on the desired qualitative line;
Drag the cursor over a group of selections, then click the Add button.
After you have made the initial criteria selection, the Criteria box will reflect that selection. If you are through
defining the target group of people, click the OK button; to continue to define your target, you will use the “And,”
“Or” or “Not” options.
TAPSCAN and the TAPSCAN design are trademarks and registered marks of TAPSCAN, INC.
© 2001 Arbitron Inc. Used under license.
33
QUALITATIVE ADJUSTMENTS
Criteria Menu Options
Three key buttons located at the bottom of the Criteria screen are the “And,” “Or” and “Not” buttons:
The Not option lets you exclude a
particular qualitative aspect.
The “And” option lets you further
define your target criteria. This will
reduce the number of respondents.
The “Or” option lets you broaden the
qualitative scope which will result in
an increase in respondents.
Other options available on this toolbar will enable you to perform various functions:
Geo---Defines the geographic area to be
analyzed. (See below for a full explanation.)
Load---Allows you to retrieve
previously saved qualitative criteria.
Save---Allows you to save
criteria so that you may use it
again.
Delete---To delete a qualitative statement from the
defined criteria, highlight the un-needed line in the
criteria box then click this button.
Search---Enter a key word and the system
will search the entire database for all
classifications and categories that contain that
word.
The Traffic Light
The Traffic Light will be green as long as your respondent base is large enough
for the system to calculate accurate estimates. The light will change to yellow if
your respondent base is low; however, the system will allow you to continue
with the criteria. If the respondent base drops below 35, the light will change
to red, and you will not be allowed to continue until you broaden the
respondent base.
Changing the Geographic Focus of the Report
It is at the Criteria Selection window where you may redefine the geographic focus of the report. Click the
Geo button, and you will be brought to the Geographic Definition screen:
In the Available Survey Areas box, double-click on the area you wish to use (i.e. DMA or Metro), and you
will be brought back to the report’s setup window. If you wish to select specific counties or zip codes as the
report’s geographic benchmark, single-click on the appropriate button. This will bring the components of
that selection to the lower left box, along with the number of respondents each contains. You are now ready
to select which counties or zip codes you wish to include. You may do this in one of the following ways:
34
TAPSCAN User Manual
Double-click on each component;
Drag the cursor over a group of selections and then click the Add button.
As you make each selection, you will see that component(s) move to the right box, indicating it has been
selected. If you wish to remove (deselect) a previously chosen component(s), highlight that selection, then
click the Remove button. It will then be moved back to the left box.
The respondent count in the bottom right corner will reflect the number of actual people who live in the
respective county/zip code and participated in the actual survey. The respondent count must be 35 or above
to be operational.
Saving and Retrieving County/Zip Code Groups
If you want to save a selected group of counties or zip codes, identify all components to be saved, then click
the Save button. The system will then prompt you to enter a description for this geography. Click the OK
button, and you will be brought into the Description field where the cursor will be in the open edit mode.
Now type a description for this geographic area, and press Enter, or click the OK button.
To retrieve saved criteria, click the Load button at the Geography Definition screen. The system will
display all previously saved geographic definitions. Double-click on the desired area, or highlight that line,
and click the OK button.
Once the desired criteria have been established, click the OK button and you will be prompted to give the
criteria a name. Input the name, such as “People w/HH Income of 100K,” or “Household subscribes to
Cable,” then press the Tab key to be brought to the Body of Description field. Here you may assign a more
detailed description of this qualitative criteria so that other users may know exactly of what qualitative
factors the criteria is comprised. Click the OK button once you have input this information and you will be
brought back to the Qualitative Definition Menu where you will see that criteria listed. Highlight that line,
then click OK. Once back at the setup screen, you will see the Qualitative field reflect your selection.
Manual Adjustments
If you would like to import qualitative or ethnic factors from another source other than QualiTAP or Target ONE,
you may manually input that into the system then incorporate those factors into most TAPSCAN reports via the
Manual Adjustments option. Before you can create a manual adjustment you will need to have the data to be input
from the outside source prepared and in hand.
There are two ways in which you may enter this portion of the system:
1) From the setup menu of a TAPSCAN report, click the Qualitative or Adjustment button. This will bring the
Manual Adjustment Selection window where all previously created manual adjustments will be listed. To use a
saved adjustment, highlight that line and click the OK button. To add (build) a new adjustment, click New.
This will bring you to the Manual Adjustments Wizard (see the following section);
2) Click the Utilities option on the Windows menu bar, then select Manual Adjustments. If there are any
previously created manual adjustments, the Manual Adjustment Selection window will appear listing the saved
adjustments. If there are no saved manual adjustments on file, you will be taken to the Manual Adjustments
Wizard (the following screen).
Manual Adjustments Menu
TAPSCAN and the TAPSCAN design are trademarks and registered marks of TAPSCAN, INC.
© 2001 Arbitron Inc. Used under license.
35
QUALITATIVE ADJUSTMENTS
• Click New to create a new adjustment.
• Click on Edit to change a previously created adjustment.
• To delete a previously created adjustment, highlight that
line and click the Delete button.
• To use a saved adjustment, highlight that line and click
OK.
Building a Manual Adjustment
You will build a manual adjustment at the Manual Adjustments Wizard screen:
“Market” and “Book” Buttons
As this screen indicates, the first step in building a
manual adjustment is to designate the market and book
to which this adjustment will be attached. Do this by
click the Market and Book button at this screen.
The “Next” Button
Once the correct settings are reflected and you are ready to move to
the next step, click the Next button.
After you click the Next button, the window will appear where you will input all label information for this
adjustment.
This screen is comprised of several
different fields. Move from field to
field by either pressing the Tab key, or
by single-clicking on the field to edit.
The Description Field
You will input a description of the adjustment in this field. This description will not print on any report—it
will be used to differentiate this adjustment from other adjustments when retrieving an adjustment file.
Enter this text then move to the Source field.
The Source Field
Here you will enter the source of this information, such as Scarborough, Arbitron, etc. This line will print
on the printed report generated; therefore, be as clear and concise as possible. After this field is complete,
you will move to the Adjustment Labels area by clicking Next.
36
TAPSCAN User Manual
The Adjustment Labels
This area also will be displayed on the printed report when this adjustment is used; so once again, you will
want to be succinct. Type in the appropriate description such as People Who Have a Household Income
Level of $50,000 or More, or People who shop at Smiths Grocery and drive a Honda. You may use up to
20 lines for this customized description. After you have completed the description, click the Next button.
Assigning the Adjustments Percentages
When creating a manual adjustment, you have two primary areas that must be covered before the
adjustment can be used:
1) You must furnish the percentage of the population that fits the adjustment;
2) You must furnish the percentage of each station’s audience that meets the criteria of the adjustment.
You do not have to include all stations listed on the Station Menu, only those stations you need to use
within Multi-Rank; however for every station that you wish to be available for use within your ranker
when using this adjustment, you must input a percentage!!!
Entering the Population Adjustment
The screen where you will enter the adjustment to the TOTAL population will now be displayed:
The Population Adjustment will reflect what PERCENTAGE of the total population meets the criteria
of the adjustment. Enter this information in one of two ways:
Enter a global population percentage adjustment
Enter the population adjustment per individual age/gender cell.
Once the correct percentages are assigned, click the Next button. You may also use the Back button
to go back one screen.
Entering the Station Adjustment
Now you will be brought to a window displaying the station roster along side the individual age/gender
cells:
TAPSCAN and the TAPSCAN design are trademarks and registered marks of TAPSCAN, INC.
© 2001 Arbitron Inc. Used under license.
37
QUALITATIVE ADJUSTMENTS
This is where you enter what percentage of each station’s audience (which will be included in the
adjustment) which meets the criteria of the adjustment. You must enter this information for EACH
station.
Click on the first station you wish to define, then input the information in the same manner as when
entering the population percentages:
Enter a global station percentage adjustment
Enter the station adjustment per individual age/gender cell.
Afterwards, click on the next station you wish to define and enter the information in the same manner.
Remember you must assign percentages to every station you wish to be available for use when using
this adjustment.
When creating a manual adjustment, remember the resulting Persons estimate on any report
in which this adjustment file is used will always be smaller than the pure (unadjusted) Arbitron
numbers. This is because you are decreasing the size of the population; however, the
Ratings estimate may be increased or decreased depending upon what percentage of that
stations audience meets the adjustment criteria when compared with the percentage of the
population that meets the adjustment. If 60 percent of a stations audience meets the criteria,
but only 45 percent of the overall population the adjustment, the stations rating will be
increased. However, using the same population percentage but looking at a station with a
percentage of 33 percent, the rating will decrease since the station falls below the average.
Once all station information has been entered, click the Finish button and you will be taken to the
Available Manual Adjustments listing where you will see that adjustment listed. It is now available for use
throughout the system. Manual adjustments are activated by selecting the Qualitative button at a reports
setup screen or the report displays header.
Changing a Saved Manual Adjustment File
If you need to change a previously created manual adjustment file, at the Available Manual Adjustments
window, highlight the file to modify then click Edit. This will bring the Manual Adjustment Wizard to
screen where you will go to the page holding the information which needs to be changed by accessing the
Next and Back buttons, then revise the information as when previously entered. Once complete click the
Finish button. If you wish this file to be added as an additional adjustment rather than overriding the
original adjustment, make sure you give the file a unique Description name (done of first page of the
Adjustment Wizard display).
Deleting a Manual Adjustment File
To delete an adjustment file, at the Available Manual Adjustments, highlight the file to delete then click
Delete. You will be prompted to confirm the action. Select Yes and the file will be erased from the
Manual Adjustment database.
Maximi$er/MediaPro
Use this option to select qualitative criteria available with the Maximi$er/MediaPro data. Click on the Maximi$er
button (for stations) or MediaPro button (for agencies) and the Respondent System – Criteria Selection Menu will
appear:
38
TAPSCAN User Manual
Specify the geography to be used in your scan by clicking on the Geography button. The system will bring up the
Geographic Selection screen that lists standard areas (Metro, TSA, DMA) and available counties. Click on the ZIP
Codes button if you wish to use ZIP Codes. Click on the area you wish to use then click OK.
Socioeconomic data is included with all Respondent data books Summer 99 or later. If the market is not rated by
Scarborough® or Retail Direct®, the qualitative diary data can be selected. Click on the desired Classification and
its Categories will appear. Click on the desired Category and its available selections (punches) will appear.
Highlight the selection(s) you wish then click Add. The selection will appear in the criteria box.
You may add an AND or OR relationship with additional criteria. Choose the selection you wish then click AND (or
OR) then Add. The additional criteria will then appear in the criteria box.
***Notice the Traffic Light on the top right corner of the screen. The light will be green as long as your respondent
base is large enough. The light will change to yellow if your respondent base is low but large enough to continue.
The light will turn red if your respondent count becomes too low (1-34) and you will not be allowed to continue until
you broaden your base.
Selected Criteria may be deleted by highlighting it in the criteria box then clicking Remove.
Selected Criteria may also be saved for later use by clicking on Save. Load will retrieve previously saved criteria.
You may search for criteria throughout the entire database by clicking on Search. You will be given a listing of all
categories, classes and punches that contain the search criteria.
Click OK when you are ready to return to the previous screen and your selections will load for the program you are
using.
Socioeconomic Data
Use the Criteria button to determine the listening habits of different groups of people based on their household
income, level of education, number of children and household size, when using a 1999 Fall Summary book or later.
To add criteria, select the desired category to list its subcategories. Highlight the subcategories you want then click
ADD. The selections are added to the criteria definition box to the left of the traffic light.
TAPSCAN and the TAPSCAN design are trademarks and registered marks of TAPSCAN, INC.
© 2001 Arbitron Inc. Used under license.
39
QUALITATIVE ADJUSTMENTS
Next, you can add additional categories, using an AND/OR relationship. Select another category and its
subcategories, then click AND (or OR). The additional subcategories are added to the criteria box, and have a direct
relationship to your first selection. When you use OR, the respondents are grouped together. When you use AND,
the second group is extracted from the first group.
For example, let's say a client wants to advertise a minivan, and we know that consumers who own minivans earn
$50K+ and have 2+ children. You would select Household Income and highlight both "$50,000-$74,000" and
"$75,000+", then click ADD. Next, you would select Number of Children in Household and highlight "TWO
Children" and "THREE plus children" then click AND. The resulting criteria definition would be households whose
income is $50,000 or more and have 2 or more children.
***Notice the Traffic Light on the top right corner of the screen. The light will be green as long as your respondent
base is large enough. The light will change to yellow if your respondent base is low but large enough to continue.
The light will turn red if your respondent count becomes too low (1-34) and you will not be allowed to continue until
you broaden your base.
Selected Criteria may be deleted by highlighting it in the criteria box then clicking Remove.
Selected Criteria may also be saved for later use by clicking on Save. Load will retrieve previously saved criteria.
Click OK when you are ready and your selections will load for the program you are using.
40
Chapter Four:
Common
Options
TAPSCAN User Manual
Common Options
When setting the parameters for TAPSCAN programs, many options are setup the same for all programs. These are
explained in detail in this section. The rest of the manual will refer to this section in the “Setting the Parameters”
section for each program.
Market Selection
If you are using multiple markets, you may click the Market button to change to a different market.
Highlight the desired market and click OK or you may simply double-click on its label.
Station List Builder for Multi-Market Reports
From the Station List Builder window, you can create new multi-market station lists or modify previously saved
ones to use as the selected stations for a Multi-Market Ranker or Multi-Market ReachMaster Schedule. In
addition, you can select different summary books, one per market, for your Station List.
Respondent data cannot be used with multi-market Rankers or
ReachMaster schedules.
To open the Station List Builder window, select Multi-Market Station Lists from the Utilities menu or click
Add while viewing the Multi-Market Station Lists window.
TAPSCAN and the TAPSCAN design are trademarks and registered marks of TAPSCAN, INC.
© 2001 Arbitron Inc. Used under license.
43
COMMON OPTIONS
Use the search engine to select stations by any combination of market, format, top stations, or owner. To
modify a saved list, you must open the saved list first by clicking Load, highlighting the description, and then
clicking Open.
To start selecting your stations, use the four tabs: Market, Formats, Rank, and Ownership, to define your search.
When finished, click the Start Search button.
In order to view the Ownership information, the MStreet data must be
installed and its path setup. See the Report Setup section in chapter two.
The stations matching your criteria are displayed by Station, Calls, Market, Book, Format, and Owner. You can
sort the information by clicking its column header. The latest book you have automatically used for each
selected market.
•
•
•
•
•
•
•
To search for a station by its call letter, click the Call Letter Search button and enter the call in a
WXXXFM format.
To add more stations, complete another search. If necessary, use the Clear Search Criteria
button to remove the previous search criteria.
To delete a selected station, highlight the station, then click Delete.
To delete all selected stations, click Clear.
To select a different book (one book per market), highlight a market's station, click the Book
button or right-click the mouse. The same book must be used for all selected stations in the
market.
To save a list, enter a description in the 'Description' box, then click Save.
To close the Station List Builder window, click OK.
Station Lists
The process of selecting stations for multi-market reports is different than selecting stations for a single-market
report. Since multi-market station lists can become quite lengthy, it is necessary to create the station list first,
then save it with a description (like you would a file), so the list can be selected.
44
TAPSCAN User Manual
From the Multi-Market Station Lists window, you can add a new group of stations, delete a group you no longer
need, or select a group to use on a Multi-Market Ranker or a Multi-Market Schedule.
Survey Selection
To switch to a different survey book, click the Book button and make the appropriate selection.
Highlight the desired survey and click OK or you may simply double-click on its label.
Selecting the Daypart Focus of the Report
To define the daypart upon which the report will be based, click on Daypart. This will bring you to the
Daypart Selection Menu:
TAPSCAN and the TAPSCAN design are trademarks and registered marks of TAPSCAN, INC.
© 2001 Arbitron Inc. Used under license.
45
COMMON OPTIONS
Selecting a Standard Daypart
Define a standard daypart by clicking on the pre-defined starting/ending day and the beginning and ending
times within the Standard Daypart portion of this window.
After the daypart is defined, click on OK
and you will be taken back to the Setup
screen.
Favorite Dayparts
If you would like to select a pre-defined
daypart from within the Favorite Daypart
box, simply highlight that daypart and
click OK. Alternatively, you may doubleclick on a single daypart.
Click on Add to Favs to add a defined
daypart to the favorite dayparts window.
To delete a favorite daypart, highlight
that daypart from within the Favorite
Daypart box and click Delete Fav.
Manually Defining Dayparts—Non-Standard Dayparts
Click on the start day, end day, select the start time and end time. You may also
manually input the daypart using the following syntax:
•
M =
Monday
•
TU =
Tuesday
•
W =
Wednesday
•
TH =
Thursday
•
F
=
Friday
•
SA =
Saturday
•
SU =
Sunday
•
Use 15, 30, 45 for quarter-hour breaks
•
Use A for AM, P for PM, N for Noon, M for Midnight
Selecting the Demographic Focus
To change the current demo setting, click on Demo. This takes you to the Demo Selection Menu:
Click OK when the selection is complete.
Click on Add to Favs to add a defined daypart to
the favorite dayparts window. To delete a favorite
daypart, highlight that daypart from within the
Favorite Daypart box and click Delete Fav.
46
TAPSCAN User Manual
Here you will select the gender, and the beginning and ending age cells of the demographic target. The
twenty-one age break can be used in Rankers, Schedulers and Composition, when the multi-market is not
selected. You may select a demo two ways:
Click on the desired gender, start age, end age and then click OK.
Double-click on a demo in the list of demos in the Favorite Demos window.
Stations Selection
This is where you will select which stations you want included on multiple-station reports. The system will
default to all stations being included. If you wish to keep this selection, you do not need to make any
changes. However, to select specific stations to be included, click on the Stations button and the Station
Selection window will appear:
Available Stations Box
Selected Stations Box
Reflects what stations are Reflects which stations have been
available for selection.
selected for inclusion on the report.
Making the Station Selection
You will first need to move all pre-selected stations from the
Selected box to the Available box. Do this by clicking the Clear
button. Now make your station selection by doing one of the
following:
• Double-click on each station (in the Available Stations box) to
be included in the ranker.
• Highlight each station to be used by clicking on the station
once, and then click Add.
• Drag the mouse cursor over a range of available stations. This
will highlight all of the “included” stations. Click Add and all
highlighted stations will be added to the selected list.
• Hold the Ctrl button down and click on individual stations to be
included. Click Add and all the highlighted stations will be
added to the selected list.
• Click Select All to choose all stations in the Available box.
• When using Respondent data, click In the Book to select all
rated stations.
• To remove a station from the Selected box, highlight the station
and click Delete.
Click the OK button and you will be taken back to the Setup screen.
Station Selection Box
To select the station for single-station profile reports, click the Station bar and a drop-down list of stations
will be brought to screen. Locate and click on the station that will be the focus of the report.
Configuring the Station Roster
This is where you will select how the station list on this ranker is displayed. Click on Rosters and the
Roster Selection setup will appear:
TAPSCAN and the TAPSCAN design are trademarks and registered marks of TAPSCAN, INC.
© 2001 Arbitron Inc. Used under license.
47
COMMON OPTIONS
Display ALL Simulcasts, Combos and Components
By using this Station Roster selection, the following will be displayed on the report:
a. All stations that simulcast during the defined daypart (regardless if the simulcast or either of its
components are used in a created combo)
b. Created Combos
c. Each Component of all simulcasts and combos (In other words, each individual station that is
included in all simulcasts and created combo)
Display Simulcasts and Combos
This is the most frequently used selection. This option suppresses the components of each simulcast
and combo to be shown apart from it counterpart(s). This is the system default. If this selection is used,
the following will be displayed on the report:
a. Simulcasts (if not used within a Combo)
b. Created Combos
Display Components of Simulcast and Combos
This option will suppress all simulcasts and created combos and show AM and FM components
separately.
Display ONLY Simulcasts, no Combos
Regardless of Combo Page selection, using this option will suppress all created combos.
Display ONLY Combos and NO other Stations
Only CREATED combos (not simulcasts) will be displayed on the report. Make your choice by
clicking on that selection, then confirm your selection by clicking OK.
48
TAPSCAN User Manual
Combos
You will activate combos by clicking the Combos button. It is also in this area that you may perform any
needed combo maintenance. Click on Combos or Edit Combos and the Combo setup will be displayed:
Use/Don't Use Combo Options
Click on Use Combos for this Run to
include them in your analysis. Click on
Don't Use Combos for Run to turn them
off.
Combos Pages Window
This area of Combos Setup displays information about each combo page:
• The “#” column represents the number of the combo page, as recognized by
TAPSCAN.
• The “Combo Page Name” displays the name of the combo page. You may
customize the name of a combo page by clicking the Name Page button.
• The “Count” column displays how many different combo combinations are
included on the corresponding combo page.
Clone Page Button
This option lets you copy, or “clone,” a
combo page. Highlight the combo page to
be copied and click this button. You will
then be prompted to enter the page number
where the newly cloned combo page will
reside. Input that number and click the OK
button.
Highlight the combo page you want to be
the default when combo are turned on,
then place an X in the Default Page field.
Use these buttons to establish the actual
combos of the corresponding Combo
Page. See the table below for an
explanation of each button.
Combos Window
Displays the created combos contained
within the highlighted combo page.
Establishing Combos
Button
Action
Add Combo
Delete Combo
Name Combo
Clear Combo
Click this button to add a combo to the currently highlighted Combo Page. This will bring
the Create a Combo window to screen:
At this window, identify each station to be included
in this combo by highlighting each, then clicking
Add. Once all stations have been selected, give the
combo a name in this window’s Name field.
Remove selected stations by highlighting each
selected item and clicking Delete. There is no
limit to the number of stations that can be included
in a combo. Click OK once the correct combo
configuration has been obtained.
You will then be taken back to the Setup Combos window where you will see that combo
and its components displayed in the Combos box.
To delete a combo from the currently highlighted Combo Page, highlight that line and click
the Delete button.
If you would like to rename a combo, highlight that line and click this button. You may
assign a name of 15 characters or less.
Clicking this button will IMMEDIATELY erase all combos from the currently highlighted
Combo Page.
After your selection is complete, select OK to be taken back to the Setup screen.
TAPSCAN and the TAPSCAN design are trademarks and registered marks of TAPSCAN, INC.
© 2001 Arbitron Inc. Used under license.
49
COMMON OPTIONS
Geography
Click on the Geography button to select the geographic area for your analysis. When using summarybased data, the Geographic Selection menu will appear:
Click on the area you wish to cover in your analysis and then click OK.
If you are using Maximi$er/MediaPro data, you can select counties or ZIP codes to establish custom areas
in addition to Metro, TSA or DMA areas. When you click on the Geography button, the Respondent
System – Geographic Selection Menu will appear:
You may select from four survey areas by clicking on the appropriate label in the Available Survey Areas
box in the upper-left corner of the window: Metro, TSA, DMA or User Defined Area.
To create a User Defined area based on counties, select the Available Counties several ways:
1) Double-click on a county.
2) Click once on a county and then click Add.
3) Click and drag the mouse to highlight consecutive counties then click Add.
4) Press and hold the Ctrl key then click on counties in the list to highlight them then click Add.
To remove a county from the Selected Counties list, highlight that county and click Delete. To remove all
selected counties, click Clear.
After you have selected the survey area, you will need to enter a description. Click on the Custom
Description field and type in your description.
50
TAPSCAN User Manual
After you have created a User Defined Area, you can save it by clicking on Save. You will need to enter a
description of the saved file. Also, you have the option to make this saved selection the default by clicking
on Save as Default. If you had loaded a saved schedule, made changes and saved again, you may replace
the previously saved selections by clicking on Replace Existing File. Once you have entered your
description and chosen the appropriate options, click OK. To exit without saving your selections, click
Cancel.
To load a previously saved User Defined Area, click on Load. Highlight the desired selection and click
OK. If you need to review the counties included in a saved file, highlight that file and click on the Info
button.
If you wish to define a custom area based on ZIP codes or to include some individual ZIP codes in your
geography in addition to the selected counties, click on the ZIP Codes button (see instructions below).
Make your selections, click OK and you will return to the Geographic Selection menu.
Once you have made your selection and entered a description, click OK to return to the Setup screen. To
exit without selecting Maximi$er/MediaPro geography, click Cancel.
Zip Codes
When you choose to define the area of your analysis based on ZIP codes, click on the ZIP Codes button.
This will bring up the Respondent System – ZIP Code Selection Menu.
To create a User Defined area, select the Available ZIP Codes several ways:
1) Double-click on a ZIP code.
2) Click once on a ZIP code and then click Add.
3) Click and drag the mouse to highlight consecutive ZIP codes then click Add.
4) Press and hold the Ctrl key then click on ZIP codes in the list to highlight them then click Add.
You may have all ZIP codes displayed in the Available ZIP Codes list or you can narrow the scope by only
including the ZIP codes of an individual county. To list all ZIP codes, click on the arrow button of the pick
list on the right (it defaults to Display ZIP Codes by County) and then click on Display All ZIP Codes.
To display only ZIP codes of a specific county, select Display ZIP Codes by County, then click on the
arrow button of the Counties pick list and click on the desired county.
To remove a ZIP code from the Selected ZIP Codes list, highlight that ZIP code and click Delete. To
remove all selected ZIP codes, click Clear.
TAPSCAN and the TAPSCAN design are trademarks and registered marks of TAPSCAN, INC.
© 2001 Arbitron Inc. Used under license.
51
COMMON OPTIONS
The Manual Entry field allows you hand-enter ZIP codes. Just click on this field and type in the desired
ZIP codes separated by commas.
After you have selected the survey area, you will need to enter a description. Click on the Description
field and type in your description.
After you have created a User Defined Area, you can save it by clicking on Save. You will need to enter a
description of the saved file. Also, you have the option to make this saved selection the default by clicking
on Save as Default. If you had loaded a saved schedule, made changes and saved again, you may replace
the previously saved selections by clicking on Replace Existing File. Once you have entered your
description and chosen the appropriate options, click OK. To exit without saving your selections, click
Cancel.
To load a previously saved User Defined Area, click on Load. Highlight the desired selection and click
OK. If you need to review the ZIP codes or counties included in a saved file, highlight that file and click on
the Info button.
Once you have made your selection and entered a description, click OK to return to the Geographic
Selection screen. To exit without selecting ZIP Codes, click Cancel.
Maximi$er/MediaPro
Use this option to select qualitative criteria available with the Maximi$er/MediaPro data. Click on the
Maximi$er button (for stations) or MediaPro button (for agencies) and the Respondent System – Criteria
Selection Menu will appear from which you may select the desired criteria.
For a walk-through of the actual selection of Maximi$er/MediaPro qualitative data, please refer to
Chapter 3, Qualitative Adjustments.
Qualitative Adjustments
This option allows you to merge qualitative information with pure radio data. Click Qualitative and you
will be prompted to select the type of adjustment you wish to use:
Click the QualiTAP button if you wish to use
qualitative factors from QUALITAP.
Click the Manual button if you wish to incorporate
manually created qualitative adjustments in the
report.
If you are currently using qualitative adjustments,
you may disable them by clicking the Turn off
button.
Select the type of adjustment to use and the Qualitative Definition Menu will appear listing all previouslycreated qualitative adjustments. Highlight the adjustment you wish to use and click OK.
For a walk-through of the actual creation of a QualiTAP or Manual adjustment, please refer to
Chapter 3, Qualitative Adjustments.
Estimates
You can select which estimates will be displayed on the report with this option. After selecting Estimates,
the TAPSCAN Estimate Selection menu will be displayed.
52
TAPSCAN User Manual
This box reflects the estimates that are available for selection.
Use these action buttons to configure
the report’s layout to your
This box reflects those estimates that have been
chosen for inclusion on the report.
To accept the default estimate selection, simply press OK. To re-select the estimate selection, click on
Clear. This will move all selected estimates back to the Available box. You are now ready to select the
estimates you wish to use on the report:
Estimates may be selected in multiple ways:
Double-click on the estimate. You will then see it move from the Available box to the Include box.
Click once on the estimate, then click Add.
Click and drag the mouse to highlight consecutive estimates, then click Add.
Press and hold the Ctrl key, click on all estimates to be included, then click Add.
If you want to insert an estimate in front of a previously selected estimate, click on the estimate (in the
Include box) where you wish to place the new estimate, highlight the estimate to insert from the
Available box, then click the Insert button.
To remove a previously selected estimate from the Include box, highlight that estimate and click the
Delete button. This will move the estimate back to the Available box.
Note the TAPSCAN Ranker and Batch Rankers have an extra field on the estimate selection menu to select
the estimate by which the report will be ranked. Click on the Ranked By field and a drop-down list of
estimates will be displayed. Click on the estimate you want.
When your selection is complete, select OK, and you will be taken back to the Setup screen.
TAPSCAN and the TAPSCAN design are trademarks and registered marks of TAPSCAN, INC.
© 2001 Arbitron Inc. Used under license.
53
Chapter Five:
Rankers
TAPSCAN User Manual
Introduction
A Ranker is a report that shows station RANKINGS ... In other words, how stations within the specified geographic
area rank against each other within different dayparts and demographic targets. These reports give you the quickest
snap-shot of radio listening activity within a specified market.
TAPSCAN Rankers are versatile and easy to create. They also give you many different perspectives of ratings
analysis that will result in the most precise research and presentations possible. TAPSCAN works with quarter-hour
data and offers options such as:
Non-standard dayparts including quarter and half hour increments
Ability to measure a station’s exclusivity
Build and store batch rankers
Benchmark comparisons
Combo capabilities of up to seven stations
Reverse CPP/CPM analysis
Activate the Rankers portion of the system by clicking on the Rankers button from the TAPSCAN Menu and the
Ranker Selection Menu will appear listing the various Ranker options available to you:
The following section will review the different ranker reports.
TAPSCAN and the TAPSCAN design are trademarks and registered marks of TAPSCAN, INC.
© 2001 Arbitron Inc. Used under license.
57
RANKERS
TAPSCAN Ranker
TAPSCAN Ranker allows you to take one specific daypart and analyze its performance in multiple estimates in a rank
table format. TAPSCAN has been configured so that you may easily and quickly get to any module. For example, in
this section of the system you may press Enter three times and a total week ranker will be displayed.
Enter TAPSCAN Ranker in one of the following three ways:
Click File, New, TAPSCAN Ranker
From the TAPSCAN Toolbar click Rankers then select TAPSCAN Ranker
From the Master Menu, click Rankers then select TAPSCAN Ranker
The Ranker Setup menu will then appear:
The Ranker Setup is where you
will set the specifications of your
ranker. Do this by utilizing the
various buttons on this screen.
The following is a review of each
button’s function.
Save & Load Options
Report configurations may be saved and
retrieved by accessing the Save and
Load buttons.
After the desired
configuration is obtained, click Save,
give the setup a unique name, then click
OK. Next time you are in this report and
wish to retrieve this configuration, once
at the Setup menu, click Load and select
that configuration.
Establishing the Parameters of the Report
For detailed instructions on these options, refer to Chapter Four, Common Options.
Market Selection
If you are using multiple markets, you may click the Market button to change to a different market.
Survey Selection
To switch to a different survey book, click the Book button and make the appropriate selection.
Selecting the Daypart Focus of the Report
To define the daypart upon which this ranker will be based, click on Daypart. This will bring you to the
Daypart Selection Menu.
Select Standard dayparts by clicking on the days, the start time and the end time and then click OK.
To select Non-Standard dayparts, select a start and end day, start and end time and then click OK.
Choose a favorite daypart by single-clicking on it and then OK or simply double-click on its label.
58
TAPSCAN User Manual
Selecting the Demographic Focus
To change the current demo, click on Demo which takes you to the Demo Selection Menu. Select the
gender, and the beginning and ending age cells of the demographic target in one of the following ways:
Click on the desired gender, start age, end age and then click OK.
Double-click on a demo in the list of demos in the Favorite Demos window.
Stations Selection
This is where you will select which stations will be included on the report. The system defaults to all
stations being included. If you want to select specific stations to be included, click on the Stations button
and the Station Selection window will appear. You may either highlight stations in the Selected box you do
not want included and click Delete, or you may click Clear to remove all selected stations and start from
scratch. To select, highlight stations in the Available box and click Add. Once your selections are
complete, click the OK button and you will be taken back to the Ranker Setup screen.
Configuring the Station Roster
This is where you will select how the station list on this ranker is displayed. Click on Rosters and the
Roster Selection setup will appear. Make your choice by clicking on the appropriate selection, then confirm
your selection by clicking OK.
Combos
You will activate combos by clicking the Combos button. It is also in this area that you may perform any
needed combo maintenance. Click on Combos and the Combo setup will be displayed. Choose either to
“Use Combos for this run” or “Don’t Use Combos for this run” by clicking on the appropriate
button. Select which set of combos to use by clicking on the Combo Page Name.
You may perform combo maintenance with the Add, Delete, Name and Clear buttons as well.
After your selection is complete, select OK to be taken back to the Ranker Setup screen.
Geography
Click Geography to change to a different survey area---Metro, TSA, DMA or a User Defined area with
Maximi$er/MediaPro data.
Maximi$er/MediaPro
Select the Maximi$er (for stations) or MediaPro (for agencies) button to select qualitative criteria
available with the Maximi$er/MediaPro data.
For a walk-through of selecting Maximi$er/MediaPro data, please refer to Chapter Three, Qualitative
Adjustments.
Qualitative Adjustments
This option allows you to merge qualitative information with pure radio data. Click Qualitative and you
will be prompted to select the type of adjustment you wish to use.
Click the QualiTAP button if you wish to use qualitative factors from QualiTAP.
Click Manual if you wish to incorporate manually created qualitative adjustments in the report.
If you are currently using qualitative adjustments, you may disable them by clicking Turn off.
TAPSCAN and the TAPSCAN design are trademarks and registered marks of TAPSCAN, INC.
© 2001 Arbitron Inc. Used under license.
59
RANKERS
Select the type of adjustment to use and the Qualitative Definition Menu will appear listing all previously
created qualitative adjustments. Highlight the adjustment you wish to use and click OK.
For a walk-through of creating an adjustment, please refer to Chapter Three, Qualitative Adjustments.
Estimates
You can select which estimates will be displayed on this ranker with this option. After selecting
Estimates, the TAPSCAN Estimate Selection menu will be displayed. To accept the default estimate
selection, simply press OK. To re-select the estimate selection, click on Clear. You may now select the
estimates by highlighting them in the Available box and clicking on Add or Insert. Remove individual
estimates from the Selected list with the Delete button. To select the estimate by which the report will be
ranked, click on the Ranked By field and click on the desired estimate.
When your selection is complete, select OK, and you will be taken back to the Ranker Setup screen.
The TAPSCAN Ranker Display
Once all of the Ranker criteria have been appropriately set, select OK, and the TAPSCAN Ranker will be displayed.
TAPSCAN Ranker Display
To change any of the pre-selected report parameters, click
on the corresponding button located here in the report’s
header, or click the Edit option on the Windows task bar.
You can resize each column by placing the cursor in the
estimate column’s header, then dragging the cursor to the
desired format.
You may automatically re-rank the report by doubleclicking on the estimate’s column header. Alternatively,
click the Rank button and make your selection.
If you have multiple reports open simultaneously, you can switch to another display by clicking Window, then
select another display. You also may view them on the same screen at the same time by using the Tiling and
Cascading options, also located by clicking the Windows option.
Printing a TAPSCAN Ranker
There are multiple graphing (charting) configurations available. For a detailed walk-through of
these options, please refer to Chapter Eleven.
To print this report, click the Print button on the TAPSCAN Tool Bar, or click File and select Print. This will bring
the Station Print Selection window to screen:
60
TAPSCAN User Manual
Here you will identify those stations to be included on the printed report. The system will default to all stations
being selected. To change this click Clear, then select the stations to be included. Notice also that you have the
option to identify a specified ranking number of stations to be printed by clicking Print Top. When you are ready
to print, click OK, and the Print Job window will appear indicating your report is being processed.
TAPSCAN and the TAPSCAN design are trademarks and registered marks of TAPSCAN, INC.
© 2001 Arbitron Inc. Used under license.
61
RANKERS
Ranking Summaries
The Ranking Summary is an excellent place to start if you want to quickly uncover a specific station’s rank within
particular dayparts and demographics. This program allows you to select both a target demographic and specific
dayparts. The system will scan all demo combinations contained within that target demo, and will tell you where
your station, or the specified station, ranks in each different demo combination for each different daypart selected.
Enter Ranking Summaries in one of the following three ways:
Click File, New, Ranking Summaries
Click on Rankers from the toolbar then select Ranking Summaries
From the Master Menu, click Rankers then select Ranking Summaries
The Ranking Summaries Setup menu will then appear where you will set the parameters of the report:
The Ranker Setup is where you
will set the specifications of your
ranker. Do this by utilizing the
various buttons on this screen.
The following is a review of each
button’s function.
Establishing the Parameters of the Report
For detailed instructions on these options, refer to Chapter Four, Common Options.
Market Selection
If you are using multiple markets, you may click the Market button to change to a different market.
Survey Selection
To switch to a different survey book, click the Book button and make the appropriate selection.
Selecting the Daypart Focus of the Report
To define the daypart upon which this report will be based, click on Daypart. This will bring you to the
Daypart Selection Menu.
62
Select Standard dayparts by clicking on the days, the start time and the end time and then click OK.
To select Non-Standard dayparts, select a start and end day, start and end time and then click OK.
Choose a favorite daypart by either single-clicking on it and then clicking OK or you may simply
double-click on its label.
TAPSCAN User Manual
Geography
Click Geography to change to a different survey area---Metro, TSA, DMA or a User Defined area with
Maximi$er/MediaPro data.
Maximi$er/MediaPro
Select the Maximi$er (for stations) or MediaPro (for agencies) button to select qualitative criteria
available with the Maximi$er/MediaPro data.
For a walk-through of selecting Maximi$er/MediaPro data, please refer to Chapter Three, Qualitative
Adjustments.
Qualitative Adjustments
This option allows you to merge qualitative information with pure radio data. Click Adjustment and you
will be prompted to select the type of adjustment you wish to use:
Click the QualiTAP button if you wish to use qualitative factors from QualiTAP.
Click the Manual button if you wish to incorporate manually created qualitative adjustments in the
report.
If you are currently using qualitative adjustments, you may disable them by clicking the Turn off
button.
Select the type of adjustment to use and the Qualitative Definition Menu will appear listing all previously
created qualitative adjustments. Highlight the adjustment you wish to use and click OK.
For a walk-through of creating an adjustment, please refer to Chapter Three, Qualitative Adjustments.
Combos
You will activate combos by clicking the Combos button. It is also in this area that you may perform any
needed combo maintenance. Choose either to “Combos On” or “Combos Off” by clicking on the
appropriate button. Click on Edit Combos and the Combo setup will be displayed. Select which set of
combos to use by clicking on the Combo Page Name.
You may perform combo maintenance with the Add, Delete, Name and Clear buttons as well.
After your selection is complete, select OK to be taken back to the Setup screen.
Station Selection Box
Click the Station bar and the station listing will be brought to screen. Find and click on the station that will
be the focus of this report.
Scan All Demos/Age Range Demos Box
Choose either Scan All Demos or Age Range for your report. Choosing Age Range will allow you to
specify a particular age range as opposed to the system scanning all the demos.
Estimates
You can select which estimates will be displayed on this ranker with this option. After selecting
Estimates, the TAPSCAN Estimate Selection menu will be displayed. To accept the default estimate
selection, simply press OK. To re-select the estimate selection, click on Clear. You may now select the
TAPSCAN and the TAPSCAN design are trademarks and registered marks of TAPSCAN, INC.
© 2001 Arbitron Inc. Used under license.
63
RANKERS
estimates by highlighting them in the Available box and clicking on Add or Insert. Remove individual
estimates from the Selected list with the Delete button.
When your selection is complete, select OK, and you will be taken back to the Setup screen.
The Ranking Summary Display
Once all of the Summary report’s criteria have been appropriately set, select OK, and the data will be displayed:
Ranking Summary Display
To change any of the pre-selected
report parameters, click on the
corresponding button located here in
the report’s header, or click the Edit
option on the Windows task bar.
If you have multiple reports open simultaneously, you can switch to another display by clicking Window, then
select another display. You also may view them on the same screen at the same time by using the Tiling and
Cascading options, also located by clicking the Windows option. In addition, you may copy data to the
Windows’ clipboard by highlighting the data to be copied, clicking Edit, then Copy.
To instantly produce a market ranker for the current daypart, demo and estimate, simply double-click on a
rank number!
Printing a Ranking Summary
There are multiple graphing (charting) configurations available. For a detailed walk-through of these
options, please refer to Chapter Eleven.
To print this report, click the Print button on the TAPSCAN Tool Bar, or click File and select Print. This will bring
the Station Print Selection window to screen:
Here you will identify those stations to be included on the printed report. The system will default to all stations
being selected. To change this click Clear, then select the stations to be included. Notice also that you have the
option to identify a specified ranking number of stations to be printed by clicking Print Top. When you are ready
to print, click OK, and the Print Job window will appear indicating your report is being processed.
64
TAPSCAN User Manual
Multi-Daypart/Multi-Demo
Ranker
This is the most informative ranker available in the system. This report allows you to display multiple dayparts and
estimates all on one page. This is an ideal ranker to access after a data book release to get an overall idea of how the
stations compare to each other in multiple dayparts and estimates.
You will launch the Multi-Daypart/Multi-Demo Ranker in one of the following ways:
Click File, New, Rankers and select Multi-Daypart/Multi-Demo
Click Rankers on the toolbar then select Multi-Daypart/Multi-Demo
From the Master Menu, click Rankers then select Multi-Daypart/Multi-Demo
The Multi-Daypart/Multi-Demo Ranker Setup Menu will then be brought to screen:
The Multi-Daypart/Multi-Demo
Setup is where you will
configure the ranker. Do this by
utilizing the various buttons on
this screen. The following is a
review of
each
button’s
function.
Establishing the Parameters of the Report
For detailed instructions on these options, refer to Chapter Four, Common Options.
Market Selection
If you are using multiple markets, you may click the Market button to change to a different market.
Survey Selection
To switch to a different survey book, click the Book button and make the appropriate selection.
Stations Selection
This is where you will select which stations will be included on the report. The system defaults to all
stations being included. If you want to select specific stations to be included, click on the Stations button
and the Station Selection window will appear. You may either highlight stations in the Selected box you do
not want included and click Delete, or you may click Clear to remove all selected stations and start from
TAPSCAN and the TAPSCAN design are trademarks and registered marks of TAPSCAN, INC.
© 2001 Arbitron Inc. Used under license.
65
RANKERS
scratch. To select, highlight stations in the Available box and click Add. Once your selections are
complete, click the OK button and you will be taken back to the Ranker Setup screen.
Configuring the Station Roster
This is where you will select how the station list on this ranker is displayed. Click on Rosters and the
Roster Selection setup will appear. Make your choice by clicking on the appropriate selection, then confirm
your selection by clicking OK.
Combos
You will activate combos by clicking the Combos button. It is also in this area that you may perform any
needed combo maintenance. Click on Combos and the Combo setup will be displayed. Choose either to
“Use Combos for this run” or “Don’t Use Combos for this run” by clicking on the appropriate
button. Select which set of combos to use by clicking on the Combo Page Name.
You may perform combo maintenance with the Add, Delete, Name and Clear buttons as well.
After your selection is complete, select OK to be taken back to the Ranker Setup screen.
Geography
Click Geography to change to a different survey area---Metro, TSA, DMA or a User Defined area with
Maximi$er/MediaPro data.
Maximi$er/MediaPro
Select the Maximi$er (for stations) or MediaPro (for agencies) button to select qualitative criteria
available with the Maximi$er/MediaPro data.
For a walk-through of selecting Maximi$er/MediaPro data, please refer to Chapter Three, Qualitative
Adjustments.
Qualitative Adjustments
This option allows you to merge qualitative information with pure radio data. Click Qualitative and you
will be prompted to select the type of adjustment you wish to use.
Click the QualiTAP button if you wish to use qualitative factors from QualiTAP.
Click Manual if you wish to incorporate manually created qualitative adjustments in the report.
If you are currently using qualitative adjustments, you may disable them by clicking Turn off.
Select the type of adjustment to use and the Qualitative Definition Menu will appear listing all previously
created qualitative adjustments. Highlight the adjustment you wish to use and click OK.
For a walk-through of creating an adjustment, please refer to Chapter Three, Qualitative Adjustments.
Estimates
You can select which estimates will be displayed on this ranker with this option. After selecting
Estimates, the TAPSCAN Estimate Selection menu will be displayed. To accept the default estimate
selection, simply press OK. To re-select the estimate selection, click on Clear. You may now select the
estimates by highlighting them in the Available box and clicking on Add or Insert. Remove individual
estimates from the Selected list with the Delete button.
66
TAPSCAN User Manual
When your selection is complete, select OK, and you will be taken back to the Ranker Setup screen.
Selecting the Demographic Focus
You can select up to 20 demos for your analysis. You can establish a list of demos several ways:
You may add demos individually by clicking on Add. This takes you to the Demo Selection Menu.
Here you will select the gender, and the beginning and ending age cells of the demographic target. Do
this in one of the following ways:
¾ Click on the desired gender, start age, end age and then click OK.
¾ Double-click on a demo in the list of demos in the Favorite Demos window.
¾ Once you have defined all your demos, you may save them for future retrieval by clicking on Save
List. This will bring up the Save Demo List screen, at which you will type in a description of the list
of demos and then click OK. You will then be brought back to the Setup screen.
If you have previously saved a demo list, you can retrieve that list by clicking on Load List. (This
prompt will not be available if you have not previously saved a daypart list.) After clicking on this
button, the Demo List menu will appear. Select the demo list to be used by either clicking on that list
and clicking on the list and clicking OK, or simply double-clicking on that list. You will then be taken
back to the Setup screen.
¾ To remove a selected daypart from the list, highlight the daypart and click Delete. To remove all
the selected dayparts, click Clear.
¾ When you select dayparts individually or by loading a saved list, the first demo in the list will be
applied to all dayparts. You may access the other demos at the display screen with the Demo
option, and they as well will be applied to all dayparts.
You can create a custom grid and assign a different demo to each daypart with the Grid Setup option.
See section k (below), Creating a Custom Grid for detailed instructions.
Selecting the Daypart Focus of the Report
You can select up to 18 dayparts for your analysis. There are several ways to establish the list of dayparts
to be included on the analysis:
To define dayparts individually, click on Add. This will bring you to the Daypart Selection Menu:
¾ Select Standard dayparts by clicking on the days, the start time and end time and then click OK.
¾ To select Non-Standard dayparts, select a start and end day, start and end time and then click OK.
¾ Choose a favorite daypart by single-clicking on it and then OK or simply double-click on its label.
¾ Once you have defined all your dayparts, you may save them for future retrieval by clicking on Save
List. This will bring up the Save Daypart List screen, at which you will type in a description of
these dayparts. Once that label is entered, click on OK, and you will be brought back to the Setup
screen.
Load List - If you have previously defined and saved a daypart list, you can retrieve that list here.
(This prompt will not be available for use if you have not previously saved a daypart list.) After
clicking on this button, the Daypart List menu will appear. Identify the daypart list to be used by either
clicking on that list and clicking OK, or simply double-clicking on that list. You will then be returned
to the Setup screen.
You can load a pre-established list of 18 standard dayparts by clicking on the Standard button.
You can create a custom grid and assign selected demos and dayparts with the Grid Setup option.
See the next section for detailed instructions.
To remove a selected daypart from the list, highlight the daypart and click Delete. To remove all the
selected dayparts, click Clear. This does not apply to the Grid Setup.
TAPSCAN and the TAPSCAN design are trademarks and registered marks of TAPSCAN, INC.
© 2001 Arbitron Inc. Used under license.
67
RANKERS
Creating a Custom Grid
You can create a custom grid by clicking on the Grid Setup button. This will bring up the Grid Setup
window:
Click on a box and the Daypart
Selection window will come up,
followed by the Demo Selection
window. You do not have to fill
in each box.
Click Save to retain your
custom grid. Make sure you
enter a clear description.
The Options allow you to set either a different demo for each box or
the same for all. If you choose a different demo for each box, the
Demo Selection will come up after the Daypart Selection for each
box. If you choose to have the same demo for all boxes, the Demo
Selection will come up after the Daypart Selection only for the first
box you select. The demo you select there will be applied to all
boxes
To load a saved grid, click
on the description in the
Grid Selection box.
When your grid setup is complete, select OK, and you will be taken back to the Ranker Setup screen.
The Multi-Daypart/Multi-Demo Ranker Display
Once all of the Ranker criteria have been appropriately set, select OK, and the ranker will be displayed:
Multi-Daypart/Multi-Demo Ranker Display
To change any of the pre-selected
report parameters, click on the
corresponding button located here in
the report’s header, or click the Edit
option on the Windows task bar.
If you have multiple reports open simultaneously, you can switch to another display by clicking Window, then
select another display. You also may view them on the same screen at the same time by using the Tiling and
Cascading options, also located by clicking the Windows option.
Double-click on any ranking box instantly produce a chart for the daypart, demo, and estimates! Also...
single-estimate Multi-Daypart/Multi-Demo Ranker printed reports have a bar chart in each box.
68
TAPSCAN User Manual
Printing a Multi-Daypart/Multi-Demo Ranker
There are multiple graphing (charting) configurations available. For a detailed walk-through of these
options, please refer to Chapter Eleven.
To print this report, click the Print button on the TAPSCAN Tool Bar, or click File and select Print. This will bring
the Station Print Selection window to screen:
Here you will identify those stations to be included on the printed report. The system will default to all stations
being selected. To change this click Clear, then select the stations to be included. Notice also that you have the
option to identify a specified ranking number of stations to be printed by clicking Print Top. When you are ready
to print, click OK, and the Print Job window will appear indicating your report is being processed.
TAPSCAN and the TAPSCAN design are trademarks and registered marks of TAPSCAN, INC.
© 2001 Arbitron Inc. Used under license.
69
RANKERS
Cost Per Point (CPP)
Based Table
This rank table allows you to setup multiple columns with a specified CPP as the benchmark for each, then see the
resulting rates each station would need to charge in order to meet this CPP. You control the values and step-up
increments of the different CPP’s.
To launch the CPP Based Table, do one of the following:
Click File, New, CPP Based Table
From the TAPSCAN Toolbar click Rankers then select CPP Based Table
From the Master Menu, click Rankers then select CPP Based Table
The CPP Table Setup menu will then appear:
The CPP Table Setup is where you will
set the specifications of the report. Do
this by utilizing the various buttons on
this screen. The following is a review of
each button’s function.
This is the area of the Setup
window where you will establish
the benchmark factors to be used
on the table—in other words, the
CPP amounts to be used.
Establishing the Parameters of the Report
For detailed instructions on these options, refer to Chapter Four, Common Options.
Market Selection
If you are using multiple markets, you may click the Market button to change to a different market.
Survey Selection
To switch to a different survey book, click the Book button and make the appropriate selection.
Selecting the Daypart Focus of the Report
To define the daypart upon which this report will be based, click on Daypart. This will bring you to the
Daypart Selection Menu.
70
TAPSCAN User Manual
Select Standard dayparts by clicking on the days, the start time and the end time and then click OK.
To select a Non-Standard daypart, you need to select a start day, end day, start time and end time and
then click OK.
Choose a favorite daypart by either single-clicking on it and then clicking OK or you may simply
double-click on its label.
Selecting the Demographic Focus
To change the current demo setting, click on Demo. This takes you to the Demo Selection Menu. Here
you will select the gender, and the beginning and ending age cells of the demographic target. Do this in one
of the following ways:
Click on the desired gender, start age, end age and then click OK.
Double-click on a demo in the list of demos in the Favorite Demos window.
Stations Selection
This is where you will select which stations will be included on the report. The system defaults to all
stations being included. If you want to select specific stations to be included, click on the Stations button
and the Station Selection window will appear. You may either highlight stations in the Selected box you do
not want included and click Delete, or you may click Clear to remove all selected stations and start from
scratch. To select, highlight stations in the Available box and click Add. Once your selections are
complete, click the OK button and you will be taken back to the Setup screen.
Configuring the Station Roster
This is where you will select how the station list on this report is displayed. Click on Rosters and the
Roster Selection setup will appear. Make your choice by clicking on the appropriate selection, then confirm
your selection by clicking OK.
Combos
You will activate combos by clicking the Combos button. It is also in this area that you may perform any
needed combo maintenance. Click on Combos and the Combo setup will be displayed. Choose either to
“Use Combos for this run” or “Don’t Use Combos for this run” by clicking on the appropriate
button. Select which set of combos to use by clicking on the Combo Page Name.
You may perform combo maintenance with the Add, Delete, Name and Clear buttons as well.
After your selection is complete, select OK to be taken back to the Setup screen.
Geography
Click Geography to change to a different survey area---Metro, TSA, DMA or a User Defined area with
Maximi$er/MediaPro data.
Maximi$er/MediaPro
Select the Maximi$er (for stations) or MediaPro (for agencies) button to select qualitative criteria
available with the Maximi$er/MediaPro data.
For a walk-through of selecting Maximi$er/MediaPro data, please refer to Chapter Three, Qualitative
Adjustments.
TAPSCAN and the TAPSCAN design are trademarks and registered marks of TAPSCAN, INC.
© 2001 Arbitron Inc. Used under license.
71
RANKERS
CPP Starting Value/Increment—Step-up Amount and Number of Times
Start Value
Click on this to establish the starting CPP amount.
Increment
Increment is the amount to increase the CPP values for
each column.
# of Times
# of Times is the number of columns to use.
The CPP Rank Table
Once all of the CPP Table criteria have been set, click OK and the CPP spreadsheet will be displayed:
CPP Table Display
To change any of the pre-selected
report parameters, click on the
corresponding button, located here in
the report’s header, or click the Edit
option on the Windows task bar.
There are multiple columns of CPP
values that are not visible. Click the
arrow keys to scroll through the
different columns.
If you have multiple reports open simultaneously, you can switch to another display by click Window and selecting
another report. Also, you may view multiple report at the same time by accessing the Tiling and Cascading option—
also located within the Windows option.
Printing a CPP Rank Table
There are multiple graphing (charting) configurations available. For a detailed walk-through of
these options, please refer to Chapter Eleven.
To print this report, click the Print button on the TAPSCAN Tool Bar, or click File and select Print. This will bring
the Station Print Selection window to screen:
Here you will identify those stations to be included on the printed report. The system will default to all stations
being selected. To change this click Clear, then select the stations to be included. Notice also that you have the
option to identify a specified ranking number of stations to be printed by clicking Print Top. When you are ready
to print, click OK, and the Print Job window will appear indicating your report is being processed.
72
TAPSCAN User Manual
Cost Per Thousand
(CPM) Based Table
This rank table allows you to setup multiple columns with a specified CPM as the benchmark for each, then see the
resulting rates each station would need to charge in order to meet this CPM. You control the values and step-up
increments of the different CPM’s.
To launch the CPM Based Table, do one of the following:
Click File, New, CPM Based Table
From the TAPSCAN Toolbar click Rankers then select CPM Based Table
From the Master Menu, click Rankers then select CPM Based Table
The CPM Table Setup menu will then appear:
The CPM Table Setup is where you will
set the specifications of the report. Do
this by utilizing the various buttons on
this screen. The following is a review of
each button’s function.
This is the area of the Setup
window where you will establish
the benchmark factors to be used
on the table—in other words, the
CPM amounts to be used.
Establishing the Parameters of the Report
For detailed instructions on these options, refer to Chapter Four, Common Options.
Market Selection
If you are using multiple markets, you may click the Market button to change to a different market.
Survey Selection
To switch to a different survey book, click the Book button and make the appropriate selection.
Selecting the Daypart Focus of the Report
To define the daypart upon which this report will be based, click on Daypart. This will bring you to the
Daypart Selection Menu.
TAPSCAN and the TAPSCAN design are trademarks and registered marks of TAPSCAN, INC.
© 2001 Arbitron Inc. Used under license.
73
RANKERS
Select Standard dayparts by clicking on the days, the start time and the end time and then click OK.
To select Non-Standard dayparts, select a start and end day, start and end time and then click OK.
Choose a favorite daypart by single-clicking on it and then OK or simply double-click on its label.
Selecting the Demographic Focus
To change the current demo setting, click on Demo. This takes you to the Demo Selection Menu. Here
you will select the gender, and the beginning and ending age cells of the demographic target. Do this in one
of the following ways:
Click on the desired gender, start age, end age and then click OK.
Double-click on a demo in the list of demos in the Favorite Demos window.
Stations Selection
This is where you will select which stations will be included on the report. The system defaults to all
stations being included. If you want to select specific stations to be included, click on the Stations button
and the Station Selection window will appear. You may either highlight stations in the Selected box you do
not want included and click Delete, or you may click Clear to remove all selected stations and start from
scratch. To select, highlight stations in the Available box and click Add. Once your selections are
complete, click the OK button and you will be taken back to the Setup screen.
Configuring the Station Roster
This is where you will select how the station list on this report is displayed. Click on Rosters and the
Roster Selection setup will appear. Make your choice by clicking on the appropriate selection, then confirm
your selection by clicking OK.
Combos
You will activate combos by clicking the Combos button. It is also in this area that you may perform any
needed combo maintenance. Click on Combos and the Combo setup will be displayed. Choose either to
“Use Combos for this run” or “Don’t Use Combos for this run” by clicking on the appropriate
button. Select which set of combos to use by clicking on the Combo Page Name.
You may perform combo maintenance with the Add, Delete, Name and Clear buttons as well.
After your selection is complete, select OK to be taken back to the Setup screen.
Geography
Click Geography to change to a different survey area---Metro, TSA, DMA or a User Defined area with
Maximi$er/MediaPro data.
Maximi$er/MediaPro
Select the Maximi$er (for stations) or MediaPro (for agencies) button to select qualitative criteria
available with the Maximi$er/MediaPro data.
For a walk-through of selecting Maximi$er/MediaPro data, please refer to Chapter Three, Qualitative
Adjustments.
74
TAPSCAN User Manual
CPM Starting Value/Increment—Step-up amount and Number of Times
Start Value
Click on this to establish the starting CPM amount.
Increment
The amount to increase the CPM amount for each
column.
# of Times
# of Times is the number of columns to use.
The CPM Rank Table
Once all of the CPM Table criteria have been set, click OK and the CPM spreadsheet will be displayed:
CPM Table Report
To change any of the pre-selected report
parameters, click on the corresponding button,
located here in the report’s header, or click the
Edit option on the Windows task bar.
There are multiple columns of CPM
values that are not visible. Click the
arrow keys to scroll through the
different columns.
If you have multiple reports open simultaneously, you can switch to another display by click Window and selecting
another report. Also, you may view multiple report at the same time by accessing the Tiling and Cascading option—
also located within the Windows option.
Printing a CPM Rank Table
There are multiple graphing (charting) configurations available. For a detailed walk-through of
these options, please refer to Chapter Eleven.
To print this report, click the Print button on the TAPSCAN Tool Bar, or click File and select Print. This will bring
the Station Print Selection window to screen:
Here you will identify those stations to be included on the printed report. The system will default to all stations
being selected. To change this click Clear, then select the stations to be included. Notice also that you have the
option to identify a specified ranking number of stations to be printed by clicking Print Top. When you are ready
to print, click OK, and the Print Job window will appear indicating your report is being processed.
TAPSCAN and the TAPSCAN design are trademarks and registered marks of TAPSCAN, INC.
© 2001 Arbitron Inc. Used under license.
75
RANKERS
Spot Based Table
This rank table allows you to setup multiple columns with a specified SPOT level as the benchmark for each, then
see the resulting reach if aired on the various stations during a specified daypart. You control the values and step-up
increments of the different Spot levels.
To launch the Spot Based Table, do one of the following:
Click File, New, Spot Based Table
From the TAPSCAN Toolbar click Rankers then select Spot Based Table
From the Master Menu, click Rankers then select Spot Based Table
The Spot Table Setup menu will then appear:
The Spot Table Setup is where you will
set the specifications of the report. Do
this by utilizing the various buttons on
this screen. The following is a review of
each button’s function.
This is the area of the Setup
window where you will establish
the benchmark factors to be used
on the table—in other words, the
Spot amounts to be used.
Establishing the Parameters of the Report
For detailed instructions on these options, refer to Chapter Four, Common Options.
Market Selection
If you are using multiple markets, you may click the Market button to change to a different market.
Survey Selection
To switch to a different survey book, click the Book button and make the appropriate selection.
Selecting the Daypart Focus of the Report
To define the daypart upon which this report will be based, click on Daypart. This will bring you to the
Daypart Selection Menu.
76
TAPSCAN User Manual
Select Standard dayparts by clicking on the days, the start time and the end time and then click OK.
To select Non-Standard dayparts, select a start and end day, start and end time and then click OK.
Choose a favorite daypart by either single-clicking on it and then clicking OK or you may simply
double-click on its label.
Selecting the Demographic Focus
To change the current demo setting, click on Demo. This takes you to the Demo Selection Menu. Here
you will select the gender, and the beginning and ending age cells of the demographic target. Do this in one
of the following ways:
Click on the desired gender, start age, end age and then click OK.
Double-click on a demo in the list of demos in the Favorite Demos window.
Stations Selection
This is where you will select which stations will be included on the report. The system defaults to all
stations being included. If you want to select specific stations to be included, click on the Stations button
and the Station Selection window will appear. You may either highlight stations in the Selected box you do
not want included and click Delete, or you may click Clear to remove all selected stations and start from
scratch. To select, highlight stations in the Available box and click Add. Once your selections are
complete, click the OK button and you will be taken back to the Setup screen.
Configuring the Station Roster
This is where you will select how the station list on this report is displayed. Click on Rosters and the
Roster Selection setup will appear. Make your choice by clicking on the appropriate selection, then confirm
your selection by clicking OK.
Combos
You will activate combos by clicking the Combos button. It is also in this area that you may perform any
needed combo maintenance. Click on Combos and the Combo setup will be displayed. Choose either to
“Use Combos for this run” or “Don’t Use Combos for this run” by clicking on the appropriate
button. Select which set of combos to use by clicking on the Combo Page Name.
You may perform combo maintenance with the Add, Delete, Name and Clear buttons as well.
After your selection is complete, select OK to be taken back to the Setup screen.
Geography
Click Geography to change to a different survey area---Metro, TSA, DMA or a User Defined area with
Maximi$er/MediaPro data.
Maximi$er/MediaPro
Select the Maximi$er (for stations) or MediaPro (for agencies) button to select qualitative criteria
available with the Maximi$er/MediaPro data.
For a walk-through of selecting Maximi$er/MediaPro data, please refer to Chapter Three, Qualitative
Adjustments.
TAPSCAN and the TAPSCAN design are trademarks and registered marks of TAPSCAN, INC.
© 2001 Arbitron Inc. Used under license.
77
RANKERS
Spot Starting Value/Increment—Step-up amount and Number of Times
Start Value
Click on this to establish the starting Spot amount.
Increment
Increment is the amount to increase the Spot levels per
columns.
# of Times
# of Times is the number of columns to use.
The Spot Rank Table
Once all of the Spot Table criteria have been set, click OK and the Spot spreadsheet will be displayed:
Spot Based Table Report
To change any of the pre-selected
report parameters, click on the
corresponding button, located here in
the report’s header, or click the Edit
option on the Windows task bar.
There are multiple columns of Spot
values that are not visible. Click the
arrow keys to scroll through the
different columns.
If you have multiple reports open simultaneously, you can switch to another display by clicking Window and
selecting another report. Also, you may view multiple report at the same time by accessing the Tiling and
Cascading option—also located within the Window option.
Printing a Spot Based Table
There are multiple graphing (charting) configurations available. For a detailed walk-through of
these options, please refer to Chapter Eleven.
To print this report, click the Print button on the TAPSCAN Tool Bar, or click File and select Print. This will bring
the Station Print Selection window to screen:
Here you will identify those stations to be included on the printed report. The system will default to all stations
being selected. To change this click Clear, then select the stations to be included. Notice also that you have the
option to identify a specified ranking number of stations to be printed by clicking Print Top. When you are ready
to print, click OK, and the Print Job window will appear indicating your report is being processed.
78
TAPSCAN User Manual
Frequency Based Table
This rank table allows you to setup multiple columns with a specified Frequency level as the benchmark for each,
then see the resulting reach if aired on the various stations during a specified daypart. You control the values and
step-up increments of the different Frequency levels.
To launch the Frequency Based Table, do one of the following:
Click File, New, Frequency Based Table
From the TAPSCAN Toolbar click Rankers then select Frequency Based Table
From the Master Menu, click Rankers then select Frequency Based Table
The Frequency Table Setup menu will then appear:
The Frequency Table Setup is where you
will set the specifications of the report.
Do this by utilizing the various buttons
on this screen. The following is a review
of each button’s function.
This is the area of the Setup
window where you will establish
the benchmark factors to be used
on the table—in other words, the
Frequency amounts to be used.
Establishing the Parameters of the Report
For detailed instructions on these options, refer to Chapter Four, Common Options.
Market Selection
If you are using multiple markets, you may click the Market button to change to a different market.
Survey Selection
To switch to a different survey book, click the Book button and make the appropriate selection.
Selecting the Daypart Focus of the Report
To define the daypart upon which this report will be based, click on Daypart. This will bring you to the
Daypart Selection Menu.
TAPSCAN and the TAPSCAN design are trademarks and registered marks of TAPSCAN, INC.
© 2001 Arbitron Inc. Used under license.
79
RANKERS
You can select Standard dayparts by clicking on the days, the start time and the end time and then click
OK.
To select a Non-Standard daypart, you need to select a start day, end day, start time and end time and
then click OK.
Choose a favorite daypart by either single-clicking on it and then clicking OK or you may simply
double-click on its label.
Selecting the Demographic Focus
To change the current demo setting, click on Demo. This takes you to the Demo Selection Menu. Here
you will select the gender, and the beginning and ending age cells of the demographic target. Do this in one
of the following ways:
Click on the desired gender, start age, end age and then click OK.
Double-click on a demo in the list of demos in the Favorite Demos window.
Stations Selection
This is where you will select which stations will be included on the report. The system defaults to all
stations being included. If you want to select specific stations to be included, click on the Stations button
and the Station Selection window will appear. You may either highlight stations in the Selected box you do
not want included and click Delete, or you may click Clear to remove all selected stations and start from
scratch. To select, highlight stations in the Available box and click Add. Once your selections are
complete, click the OK button and you will be taken back to the Setup screen.
Configuring the Station Roster
This is where you will select how the station list on this report is displayed. Click on Rosters and the
Roster Selection setup will appear. Make your choice by clicking on the appropriate selection, then confirm
your selection by clicking OK.
Combos
You will activate combos by clicking the Combos button. It is also in this area that you may perform any
needed combo maintenance. Click on Combos and the Combo setup will be displayed. Choose either to
“Use Combos for this run” or “Don’t Use Combos for this run” by clicking on the appropriate
button. Select which set of combos to use by clicking on the Combo Page Name.
You may perform combo maintenance with the Add, Delete, Name and Clear buttons as well.
After your selection is complete, select OK to be taken back to the Setup screen.
Geography
Click Geography to change to a different survey area---Metro, TSA, DMA or a User Defined area with
Maximi$er/MediaPro data.
Maximi$er/MediaPro
Select the Maximi$er (for stations) or MediaPro (for agencies) button to select qualitative criteria
available with the Maximi$er/MediaPro data.
For a walk-through of selecting Maximi$er/MediaPro data, please refer to Chapter Three, Qualitative
Adjustments.
80
TAPSCAN User Manual
Frequency Starting Value/Increment—Step-up Amount and Number of
Times
Start Value
Click on this to establish the starting Frequency amount.
Increment
The amount to increase the Frequency level per
column.
# of Times
# of Times is the number of columns to use.
The Frequency Rank Table
Once all of the Frequency Table criteria have been set, click OK and the Frequency spreadsheet will be displayed:
Frequency Based Table Report
To change any of the pre-selected
report parameters, click on the
corresponding button, located here in
the report’s header, or click the Edit
option on the Windows task bar.
There are multiple columns of
Frequency values that are not visible.
Click the arrow keys to scroll
through the different columns.
If you have multiple reports open simultaneously, you can switch to another display by click Window and selecting
another report. Also, you may view multiple report at the same time by accessing the Tiling and Cascading option—
also located within the Windows option.
Printing a Frequency Based Table
There are multiple graphing (charting) configurations available. For a detailed walk-through of
these options, please refer to Chapter Eleven.
To print this report, click the Print button on the TAPSCAN Tool Bar, or click File and select Print. This will bring
the Station Print Selection window to screen:
Here you will identify those stations to be included on the printed report. The system will default to all stations
being selected. To change this click Clear, then select the stations to be included. Notice also that you have the
option to identify a specified ranking number of stations to be printed by clicking Print Top. When you are ready
to print, click OK, and the Print Job window will appear indicating your report is being processed.
TAPSCAN and the TAPSCAN design are trademarks and registered marks of TAPSCAN, INC.
© 2001 Arbitron Inc. Used under license.
81
RANKERS
BenchMark
BenchMark offers a unique analysis perspective—you select a specific station, designate a precise spot level and
then see the resulting reach potential. In addition, the system also calculates the number of spots each other station
in the market must air to achieve (or surpass) the reach of the BenchMark station.
To launch BenchMark, do one of the following:
Click File, New, Rankers and select BenchMark
From the TAPSCAN Toolbar click Rankers then select BenchMark
From the Master Menu, click Rankers then select BenchMark
The BenchMark Setup menu will then appear:
Establish all criteria for the BenchMark report
by utilizing the various setting on the setup
window.
Bench Spots reflects the number of spots to be
aired on the BenchMark station.
The station noted in this box reflects the
BenchMark station.
Establishing the Parameters of the Report
For detailed instructions on these options, refer to Chapter Four, Common Options.
Market Selection
If you are using multiple markets, you may click the Market button to change to a different market.
Survey Selection
To switch to a different survey book, click the Book button and make the appropriate selection.
Selecting the Daypart Focus of the Report
To define the daypart upon which this report will be based, click on Daypart. This will bring you to the
Daypart Selection Menu.
Select Standard dayparts by clicking on the days, the start time and the end time and then click OK.
82
TAPSCAN User Manual
To select Non-Standard dayparts, select a start and end day, start and end time and then click OK.
Choose a favorite daypart by single-clicking on it and then OK or simply double-click on its label.
Selecting the Demographic Focus
To change the demo setting, click on Demo. This takes you to the Demo Selection Menu where you select
the gender and the beginning and ending age cells of the demographic target. Do this in one of the
following ways:
Click on the desired gender, start age, end age and then click OK.
Double-click on a demo in the list of demos in the Favorite Demos window.
Stations Selection
This is where you will select which stations will be included on the report. The system defaults to all
stations being included. If you want to select specific stations to be included, click on the Stations button
and the Station Selection window will appear. You may either highlight stations in the Selected box you do
not want included and click Delete, or you may click Clear to remove all selected stations and start from
scratch. To select, highlight stations in the Available box and click Add. Once your selections are
complete, click the OK button and you will be taken back to the Setup screen.
Geography
Click Geography to change to a different survey area---Metro, TSA, DMA or a User Defined area with
Maximi$er/MediaPro data.
Maximi$er/MediaPro
Select the Maximi$er (for stations) or MediaPro (for agencies) button to select qualitative criteria
available with the Maximi$er/MediaPro data.
For a walk-through of selecting Maximi$er/MediaPro data, please refer to Chapter Three, Qualitative
Adjustments.
Combos
You will activate combos by clicking the Combos On button. Conversely, you may disable combos by
clicking on the Combos Off button.
You may select which combo page to use or perform any needed combo maintenance with the Edit
Combos button. This will bring up the Combo setup. After your selection is complete, select OK to be
taken back to the Setup screen.
Designating the BenchMark Station and Bench Spot Level
Select the Bench station at the bottom of the window above the Edit Combos button. Then specify the
number of spots to be aired on the bench station by clicking the Bench Spots field.
Designating Which Stations will be Graphed
Here you will specify the number of stations to be included in the BenchMark comparison graph. Click on
the arrow and a drop down list of numbers will appear. Click on the number of stations you want included
in the graph.
TAPSCAN and the TAPSCAN design are trademarks and registered marks of TAPSCAN, INC.
© 2001 Arbitron Inc. Used under license.
83
RANKERS
The BenchMark Display
Once all of the criteria have been appropriately set, click OK and the BenchMark report will be displayed:
BenchMark Table Display
To change any of the pre-selected
report parameters, click on the
corresponding button, located here in
the report’s header, or click the Edit
option on the Windows task bar.
Change the graphical format by
clicking on Chart, then making a
selection from the various graph type
options.
There are additional columns of information including
Reach, Frequency and GRP attainment. Click the
arrow key to bring these columns to screen.
If you have multiple reports open simultaneously, you can switch to another display by click Window and selecting
another report. Also, you may view multiple report at the same time by accessing the Tiling and Cascading
option—also located within the Windows option. Note that the options to copy data to the clipboard are here as
well.
To print this report, click the Print button on the TAPSCAN Toolbar, or click File and selection Print. The Print
Job window will appear indicating your report is being processed.
84
TAPSCAN User Manual
Exclusive Cumes
Exclusive Cumes allows you to analyze a radio station’s audience duplication and exclusivity.
Enter Exclusive Cumes in one of the following three ways:
Click File, New, Exclusive Cumes
From the TAPSCAN Toolbar click Rankers then select Exclusive Cumes
From the Master Menu, click Rankers then select Exclusive Cumes
The Exclusive Cume Setup menu will then appear:
The Exclusive Cume Setup is where you
will set the specifications of your ranker.
Do this by utilizing the various buttons
on this screen. The following is a review
of each button’s function.
Establishing the Parameters of the Report
For detailed instructions on these options, refer to Chapter Four, Common Options.
Market Selection
If you are using multiple markets, you may click the Market button to change to a different market.
Survey Selection
To switch to a different survey book, click the Book button and make the appropriate selection.
Selecting the Daypart Focus of the Report
There are only 5 dayparts for which Exclusive Cume data is available (Monday – Friday 6am-10am, 10am3pm, 3pm-7pm, 7pm-Midnight and Monday – Sunday 6am-Midnight). To define the daypart upon which
this report will be based, click on the arrow button for the Daypart field and these 5 dayparts will be listed.
Click on the daypart of your choice.
TAPSCAN and the TAPSCAN design are trademarks and registered marks of TAPSCAN, INC.
© 2001 Arbitron Inc. Used under license.
85
RANKERS
Selecting the Demographic Focus
To change the current demo setting, click on Demo. This takes you to the Demo Selection Menu. Here
you will select the gender, and the beginning and ending age cells of the demographic target. Do this in one
of the following ways:
Click on the desired gender, start age, end age and then click OK.
Double-click on a demo in the list of demos in the Favorite Demos window.
Stations Selection
This is where you will select which stations will be included on the report. The system defaults to all
stations being included. If you want to select specific stations to be included, click on the Stations button
and the Station Selection window will appear. You may either highlight stations in the Selected box you do
not want included and click Delete, or you may click Clear to remove all selected stations and start from
scratch. To select, highlight stations in the Available box and click Add. Once your selections are
complete, click the OK button and you will be taken back to the Setup screen.
Combos
You will activate combos by clicking the Combos button. It is also in this area that you may perform any
needed combo maintenance. Click on Combos and the Combo setup will be displayed. Choose either to
“Use Combos for this run” or “Don’t Use Combos for this run” by clicking on the appropriate
button. Select which set of combos to use by clicking on the Combo Page Name.
You may perform combo maintenance with the Add, Delete, Name and Clear buttons as well.
After your selection is complete, select OK to be taken back to the Setup screen.
Configuring the Station Roster
This is where you will select how the station list on this report is displayed. Click on Rosters and the
Roster Selection setup will appear. Make your choice by clicking on the appropriate selection, then confirm
your selection by clicking OK.
Geography
Click Geography to change to a different survey area---Metro, TSA, DMA or a User Defined area with
Maximi$er/MediaPro data.
Maximi$er/MediaPro
Select the Maximi$er (for stations) or MediaPro (for agencies) button to select qualitative criteria
available with the Maximi$er/MediaPro data.
For a walk-through of selecting Maximi$er/MediaPro data, please refer to Chapter Three, Qualitative
Adjustments.
86
TAPSCAN User Manual
The Exclusive Cumes Display
Click OK once all settings have been established and the Exclusive Cumes display will appear showing each stations
pure Cume numbers, as well as the number and percentage of exclusive listeners:
Exclusive Cumes Table Display
The system will default to the data ranked
upon Exclusive Cume Persons. To change
this sort, click the Rank button. You may
also change the other parameters of the
report by clicking the corresponding button
within the header of the display, or by
clicking the Edit option on the Windows
menu bar, then making the appropriate
selection.
To copy information directly from the displayed report to the Windows Clipboard, drag the cursor over the data to
be copied. As you do this, the system will highlight the identified information. After all needed information has
been highlighted, click the Edit button located on the Windows Toolbar, and select Copy. The information will
then be copied immediately to the Clipboard, and may now be placed in another document.
If you have multiple modules open, don’t forget that the cascading and tiling options are available by clicking on the
Window option on the Windows menu bar.
Profiling a Station’s Audience
Within Exclusive Cumes, you have the option of analyzing a radio station’s total vs. exclusive cume audience broken
out by single age cell and gender. To access this report, click the Profile button, located in the header portion of the
report; alternatively, you may simply double-click on the station’s row you wish to profile. You will see the ranker
display immediately change to the graphical format showing the revised data:
Notice that the Profile button
has now changed to Ranker.
This is how you will switch
back to the rank table format;
click the Ranker button and
you will be taken back to the
multi-station report.
You may change the graphical format by clicking the Chart option on the Windows menu bar, then selecting
another graph type. Also, click the Station button to change the station focus of the analysis.
TAPSCAN and the TAPSCAN design are trademarks and registered marks of TAPSCAN, INC.
© 2001 Arbitron Inc. Used under license.
87
RANKERS
Printing an Exclusive Cume Ranker
There are multiple graphing (charting) configurations available. For a detailed walk-through of these
options, please refer to Chapter Eleven.
To print either the Exclusive Cume Report or the Station Profile do one of the following, click the Print button on
the TAPSCAN Tool Bar, or click File and select Print. If you are printing the Station Profile report, the report will
immediately be sent to the printer. If printing an Exclusive Cumes report, you will be presented with the Station
Print Selection window:
Here you will identify those stations to be included on the printed report. The system will default to all stations
being selected. To change this click Clear, then select the stations to be included. Notice also that you have the
option to identify a specified ranking number of stations to be printed by clicking Print Top. When you are ready
to print, click OK, and the Print Job window will appear indicating your report is being processed.
88
TAPSCAN User Manual
Multi-Market Ranker
TAPSCAN Ranker allows you to take one specific daypart and analyze its performance in multiple estimates in a rank
table format comparing stations from different markets. To setup your Ranker, click the Rankers button or select
File > New > Ranker to open the Ranker Selection window, then click the Multi-Market Ranker button.
You must use a Summary Book in order to complete a multi-market ranker.
Establishing the Report Parameters
For detailed instructions on these options, refer to Chapter Four, Common Options.
Station List
The process of selecting stations for a multi-market Ranker is different than selecting stations for a singlemarket Ranker. Since multi-market station lists can become quite lengthy, it is necessary to create the
station list first, then save it with a description (like you would a file), so the list can be selected. From the
Multi-Market Station Lists window, you can add a new group of stations, delete a group you no longer need,
or select a group to use on a Multi-Market Ranker or a Multi-Market Schedule.
Selecting a Daypart
To define the daypart upon which this ranker will be based, click on Daypart. This will bring you to
the Daypart Selection Menu.
Select Standard dayparts by clicking on the days, the start time and the end time and
then click OK.
To select Non-Standard dayparts, select a start and end day, start and end time and
then click OK.
Choose a favorite daypart by single-clicking on it and then OK or simply doubleclick on its label.
Selecting a Demo
To change the current demo, click on Demo which takes you to the Demo Selection Menu. Select the
gender, and the beginning and ending age cells of the demographic target in one of the following ways:
TAPSCAN and the TAPSCAN design are trademarks and registered marks of TAPSCAN, INC.
© 2001 Arbitron Inc. Used under license.
89
RANKERS
Click on the desired gender, start age, end age and then click OK.
Double-click on a demo in the list of demos in the Favorite Demos window.
Selecting the Estimates
You can select which estimates will be displayed on this ranker with this option. After selecting
Estimates, the TAPSCAN Estimate Selection menu will be displayed. To accept the default estimate
selection, simply press OK. To re-select the estimate selection, click on Clear. You may now select
the estimates by highlighting them in the Available box and clicking on Add or Insert. Remove
individual estimates from the Selected list with the Delete button. To select the estimate by which the
report will be ranked, click on the Ranked By field and click on the desired estimate.
Default
If you want to make your selections default, click the Default button.
When finished, click OK to view the Multi-Market Ranker.
The TAPSCAN Ranker Display
After completing the Multi-Market Ranker Setup, the Ranker is displayed, you may wish to change someone of the
pre-set criteria. Do this by clicking on each option's corresponding button located in the ranker's header;
alternatively, you may click the Edit option on the Windows' task bar.
•
•
•
90
Click the Demo button to re-select the target demo;
To reconfigure the daypart-focus of the report, click Daypart;
Re-select what estimates are being displayed by selecting Estimates
TAPSCAN User Manual
In order to view the Ownership information for a Multi-Market Ranker, Mstreet®
data must be installed and its path setup.
You may also copy data to the clipboard by highlighting the data to be copied and clicking Edit, Copy. Click on
View, then click Full Screen to remove the header and see more of the data table. If you have multiple reports open
simultaneously, you can switch to another display by clicking Window, then select another display. You also may
view them on the same screen at the same time by using the Tiling and Cascading options, also located by clicking
the Windows option.
Printing a TAPSCAN Ranker
To print this report, click the Print button on the TAPSCAN Tool Bar, or click File and select Print. The stations are
ranked by the estimate you select while viewing the ranker.
TAPSCAN and the TAPSCAN design are trademarks and registered marks of TAPSCAN, INC.
© 2001 Arbitron Inc. Used under license.
91
RANKERS
Batch Rankers
This Ranker program gives you the ability to batch print several different rankers at one time. This portion of
TAPSCAN is to allow you to store frequently-used multiple ranker formats so they may be quickly retrieved and
printed. You may save as many Batch Ranker configurations as you wish for future retrieval…this means you input
the parameters of the Batch Ranker run one time only, and may automatically access that setup at any time and as
often as needed!
Enter Batch Rankers in one of the following ways:
Click the Rankers button located on the TAPSCAN Tool Bar, then select Batch Rankers;
Click File, New, Rankers then select Batch Rankers;
From the Master Menu, click Rankers then select Batch Rankers.
This will bring the Batch Ranker window to screen:
Description Field
Enter the name of the Batch Report. This is the name
given to the report when saved.
Add Line Button
Click this button to add a line to the batch report.
Edit Line Button
To change a previously entered line of a batch
report, highlight the line then click this button.
Remove Line /Clear Buttons
If you would like to delete a line from a batch
report, highlight that line and click this button.
The line will then be removed from the report.
Clicking the Clear button will immediately erase
all lines contained within the current batch report.
This area of the Batch Rankers
main window will display all
pertinent information about each
component of the current batch
ranker.
Load Batch Button
Click this button to retrieve a previously saved
batch report.
Delete Batch Button
If you would like to delete a previously saved batch
report, click this button. A listing of all stored batch
reports will be displayed. Click on the report you wish
to delete and click OK.
Save Batch Button
To save the current batch configuration, click this
button, then give the batch report a name.
Creating a Batch Ranker
You may have as many rankers assigned to a Batch Ranker run as you desire; however, you must enter the
parameters of each of those rankers individually. Start by first deciding whether or not you wish to use the use the
Use Most Recent Book option.
What is the “Used Most Recent Book” Option?
Since Batch Rankers may be stored for long periods of time, and since books are released at various
times of the year, assigning a specific book to a batch ranker configuration may render the ranker obsolete
upon the release of another book. Turning this option on ensures that the latest (most recent) survey
loaded onto your PC/network will be used on the report. If a specific book is desired for a report, make
sure this option’s box is not checked prior to adding the ranker to the configuration.
92
TAPSCAN User Manual
Activate the Used Most Recent Book option by placing a check in the box to the left of this options label. If you
wish to assign a different book, you will do this at the Ranker Setup window (next section).
Next click the Add Line button and you will be taken to the Ranker Setup window:
This is where you will set all parameters of this specific ranker. For detailed instructions on these options, refer to
Chapter Four, Common Options.
Market Selection
If you are using multiple markets, you may click the Market button to change to a different market.
Survey Selection
To switch to a different survey book, click the Book button and make the appropriate selection.
Selecting the Daypart Focus of the Report
To define the daypart upon which this report will be based, click on Daypart. This will bring you to the
Daypart Selection Menu.
Select Standard dayparts by clicking on the days, the start time and the end time and then click OK.
To select Non-Standard dayparts, select a start day and end day, start time and end time and then click
OK.
Choose a favorite daypart by either single-clicking on it and then clicking OK or you may simply
double-click on its label.
Selecting the Demographic Focus
To change the current demo setting, click on Demo. This takes you to the Demo Selection Menu. Here
you will select the gender, and the beginning and ending age cells of the demographic target. Do this in one
of the following ways:
Click on the desired gender, start age, end age and then click OK.
Double-click on a demo in the list of demos in the Favorite Demos window.
Stations Selection
This is where you will select which stations will be included on the report. The system defaults to all
stations being included. If you want to select specific stations to be included, click on the Stations button
and the Station Selection window will appear. You may either highlight stations in the Selected box you do
not want included and click Delete, or you may click Clear to remove all selected stations and start from
TAPSCAN and the TAPSCAN design are trademarks and registered marks of TAPSCAN, INC.
© 2001 Arbitron Inc. Used under license.
93
RANKERS
scratch. To select, highlight stations in the Available box and click Add. Once your selections are
complete, click the OK button and you will be taken back to the Setup screen.
Configuring the Station Roster
This is where you will select how the station list on this report is displayed. Click on Rosters and the
Roster Selection setup will appear. Make your choice by clicking on the appropriate selection, then confirm
your selection by clicking OK.
Combos
You will activate combos by clicking the Combos button. It is also in this area that you may perform any
needed combo maintenance. Click on Combos and the Combo setup will be displayed. Choose either to
“Use Combos for this run” or “Don’t Use Combos for this run” by clicking on the appropriate
button. Select which set of combos to use by clicking on the Combo Page Name.
You may perform combo maintenance with the Add, Delete, Name and Clear buttons as well.
After your selection is complete, select OK to be taken back to the Setup screen.
Geography
Click Geography to change to a different survey area---Metro, TSA, DMA or a User Defined area with
Maximi$er/MediaPro data.
Maximi$er/MediaPro
Select the Maximi$er (for stations) or MediaPro (for agencies) button to select qualitative criteria
available with the Maximi$er/MediaPro data.
For a walk-through of selecting Maximi$er/MediaPro data, please refer to Chapter Three, Qualitative
Adjustments.
Qualitative Adjustments
This option allows you to merge qualitative information with pure radio data. Click Qualitative and you
will be prompted to select the type of adjustment you wish to use.
Click the QualiTAP button if you wish to use qualitative factors from QualiTAP.
Click the Manual button to incorporate manually created qualitative adjustments in the report.
If you are currently using qualitative adjustments, you may disable them by clicking Turn off.
Select the type of adjustment to use and the Qualitative Definition Menu will appear listing all previously
created qualitative adjustments. Highlight the adjustment you wish to use and click OK.
For a walk-through of creating an adjustment, please refer to Chapter Three, Qualitative Adjustments.
Print Top
This option is where you may specific a specific number of stations to print upon running the batch ranker.
The system will default to “All Stations.” To keep this setting, you need not click this button. To specify a
top number, click this button, then enter in the number of stations to print.
94
TAPSCAN User Manual
Estimates
You can select which estimates will be displayed on this ranker with this option. After selecting
Estimates, the TAPSCAN Estimate Selection menu will be displayed. To accept the default estimate
selection, simply press OK. To re-select the estimate selection, click on Clear. You may now select the
estimates by highlighting them in the Available box and clicking on Add or Insert. Remove individual
estimates from the Selected list with the Delete button. To select the estimate by which the report will be
ranked, click on the Ranked By field and click on the desired estimate.
When your selection is complete, select OK, and you will be taken back to the Setup screen.
After all settings have been established, click OK and you will be taken back to the Batch Rankers setup window:
The title box will keep count of how many ranker reports are contained within the current batch ranker.
You will see that ranker run is now listed
in the mid-portion of this window: The
Market, Survey, Daypart and Demo
fields will be displayed on the window;
however, by using the scroll bar located
at the bottom of the window, you can
review the other settings of the ranker.
Continue to add individual rankers to this batch ranker configuration in this same manner. If you need to edit a
previously entered ranker, highlight that line and click the Edit button; alternatively, you may simply double-click on
that line.
Delete a ranker entry out of the batch ranker configuration by highlighting the line you wish to remove then clicking
the Remove Line button. Clicking Clear All will erase all displayed ranker entries.
Printing (Running) a Batch Ranker
Once the Batch Ranker is appropriately configured, you may print the series of reports by clicking the Run button.
The system will process the data for all recorded rankers and promptly send the information to the printer.
Saving a Batch Ranker Configuration
You may save a Batch Ranker configuration so that it may be retrieved at a later date and processed by clicking the
Save Batch button. This will bring the following window to view:
TAPSCAN and the TAPSCAN design are trademarks and registered marks of TAPSCAN, INC.
© 2001 Arbitron Inc. Used under license.
95
RANKERS
•
•
•
•
If this is the first time to save a Batch Ranker, select either Replace current batch or Save as new batch,
click OK, input the name under which the original Batch Ranker was saved and click OK.
If you retrieved a saved Batch Ranker then made revisions to its setup, and would like for this revised
configuration to replace the former, select Replace current batch and click OK.
If you have previously saved a Batch Ranker, and would like to save this new configuration while keeping all
other saved runs intact, check the Save as new batch setting, click OK, input a unique name and click OK.
Clicking Don’t save batch will not save the current configuration to the hard disk.
Retrieving a Batch Ranker Configuration
Once a Batch Ranker configuration has been saved, it may be retrieved at any time. To retrieve a saved setup, at the
Batch Rankers window click Load Batch. This will bring a listing of all saved Batch Rankers. Highlight the
desired setup and click OK. You will return to the Batch Ranker window with all previously saved ranker setups
displayed. From this point you may print the batch ranker by selecting Print, or make any modifications to the
ranker configurations then re-save.
96
Chapter Six:
Schedulers
TAPSCAN User Manual
Introduction
The scheduling programs within TAPSCAN are where you will input specific schedule information, then ascertain the
resulting reach and frequency, CPP/CPM, Gross Impressions and so forth. Traditional and non-traditional
scheduling options include:
Billboarding
Flighting
On-the-fly goaling
Automatic Broadcast Order Generation
Quarter-hour daypart options
One-step OES Scheduling
As within the Rankers portion of TAPSCAN, each of the different schedule programs offer a unique perspective when
performing any type of broadcast analysis.
To enter into this portion of the system, click on the Scheduler button; alternatively, you may click File, New and
select Schedulers. This will bring the Scheduler Selection menu to screen where you will select which program
you wish to access. Depending on whether your system is configured for a radio station or advertising agency, you
will see a different menu.
Scheduler Selection for Radio Stations
Scheduler Selection for Advertising Agencies
This portion of the TAPSCAN Manual will review each of these scheduling programs. MediaMaster and Schedule-IT
are programs available under separate lease agreements. Call your Arbitron Sales Representative for details.
TAPSCAN and the TAPSCAN design are trademarks and registered marks of TAPSCAN, INC.
© 2001 Arbitron Inc. Used under license.
99
SCHEDULERS
ReachMaster &
Multi-Market Wizard
ReachMaster, TAPSCAN’s primary scheduling program, is where you will input an actual client schedule and
uncover, not only the reach attainment on a targeted audience, but also the resulting CPP/CPM, GRP and Gross
Impression accumulation, as well as all other applicable estimates. Since ReachMaster and the Multi-Market Wizard
operate almost identically, they are both covered and their differences explained in this section.
You can enter ReachMaster in one of the following ways:
Click File, New, Schedulers and select ReachMaster;
Click the Schedulers button on the toolbar then select ReachMaster;
From the Master Menu, click Schedulers then ReachMaster.
You can enter Multi-Market Wizard in one of the following ways:
Click File, New, Schedulers and select Multi-Market Wizard;
Click the Schedulers button on the toolbar then select Multi-Market Wizard;
From the Master Menu, click Schedulers then Multi-Market Wizard.
You will be taken to the Setup screen of ReachMaster.
Setting the Parameters of the Schedule (ReachMaster Setup
Wizard)
The ReachMaster Setup Wizard is configured with separate tabs to walk you through all the steps to setting up your
schedule. When completing a multi-market setup, the header tab has a button named “Station List” and the Station
tab is removed. Refer to Chapter Four, Common Options for detailed instructions on some * options.
Start Tab
If you have previously
saved a schedule, you may
retrieve that campaign by
clicking the Load button.
See section 3b.5 for
complete details on this
option.
Once you have filled
out all the tabs, click
on the Finish button
to go to the Schedule
Editing screen.
Exit ReachMaster at
any time by clicking
on the Cancel button.
100
Click the Next button after you have
entered all the appropriate information for
each tab. You will advance to the next tab.
TAPSCAN User Manual
Client/Campaign Name
Schedule Duration—Setting the Flight Dates of the Schedule
This portion of the window allows you to specify the length of the schedule and employ the Multi-Week
Cume Factors. If you set specific schedule dates, ReachMaster will load active rate cards from GridONE.
There are various ways in which you may set the number of weeks of the schedule.
If you do not need to input specific start and end
dates, enter the number of weeks manually by
placing the cursor in this field and entering that
number.
To base the number of weeks on the
broadcast calendar, click this button. Read
explanation below for details on this
option.
To input exact beginning and
ending dates, click the Dates
button, or the Start and End
buttons. This will bring the
Broadcast Calendar to screen
(see below).
Mutli-Week Cume Factors
If you are building a multiple week schedule, you have the option of utilizing
Multi-Week Cume Factors. If these are turned on, the system will take into
consideration when calculating the schedule’s effectiveness that each week
of the campaign will reach different people. (There is a cap of four weeks.)
Base # of Weeks on Broadcast Calendar
If you use a broadcast calendar to select your schedule flight dates, you may set the system to calculate the
number of weeks based on broadcast weeks rather than the actual number of days. Thus a schedule from
Wednesday to Tuesday will register as 2 weeks rather than one. Note that some dayparts may not be
available to assign spots in the first and last weeks of the schedule, as some of those days are not available
for scheduling. For example, if the first week of the schedule includes Thursday through Sunday, a Monday
through Wednesday daypart cannot be used for scheduling since Monday, Tuesday and Wednesday are not
included in the schedule for that week. Click in the box to turn this option on or off.
The Broadcast Calendar
Once you click on the Dates, Start Date or End Date button, the Broadcast Calendar will appear:
Designate the starting/ending dates by clicking on the day and then clicking OK or by double-clicking on
that specific date. The system will automatically assign this as the starting/ending date, depending upon
which selection is being made. Click on the Year and Month buttons (located at the bottom of the window)
to switch to another time period. You may also click on a month shown to the left of the calendar and the
calendar month display will change.
GridONE Rates
ReachMaster will load rate cards from GridONE. If your sales manager uses GridONE to establish your
station’s rate cards, ReachMaster will load the appropriate rate card for the time period selected for your
TAPSCAN and the TAPSCAN design are trademarks and registered marks of TAPSCAN, INC.
© 2001 Arbitron Inc. Used under license.
101
SCHEDULERS
schedule. You MUST select specific dates for the schedule duration as opposed to just entering a number
of weeks (The schedule dates must coincide with an active rate card in GridONE). This allows
ReachMaster to load the correct rate card for the desired period. Once you set the schedule start and end
dates, “GridONE Rates Active!” will be listed on the Start tab to indicate the rates have been loaded.
To have ReachMaster load the GridONE rates, you must first set the path for the rate card files in
Setup/Path Settings.
Each time you set up a schedule and use the GridONE rates, ReachMaster will check for the most recent
updates of the rate cards. However, if you load a previously saved schedule or if the sales manager updates
the rate cards while you are preparing a schedule, you can load the new rates yourself. There will be
another option listed under File on the Windows task bar called Refresh Rates from GridONE. Click
on this option to update the rates in a schedule.
Once you have filled out the necessary information, click Next to move to the Header tab.
102
TAPSCAN User Manual
Header Tab
Notice the difference between the single and multi-market Header tabs. There are only two options available for
a multi-market schedule—Station List and Demos.
Single Market Schedule - Header Tab
Multi-Market Schedule – Header Tab
For detailed instructions on these options, refer to Chapter Four, Common Options.
Market Selection (single market)
If you are using multiple markets, you may click the Market button to change to a different market.
Station List (multi-market)
The process of selecting stations for multi-market reports is different than selecting stations for a single-market
report. Since multi-market station lists can become quite lengthy, it is necessary to create the station list first,
then save it with a description (like you would a file), so the list can be selected. From the Multi-Market Station
Lists window, you can add a new group of stations, delete a group you no longer need, select books for each
market, or select a group to use on a Multi-Market Schedule.
Book Selection (single market)
To switch to a different survey book, click the Book button and make the appropriate selection.
Selecting the Demographic Focus
To change the demo setting, click on Demo which takes you to the Demo Selection Menu. Here you
select the gender, the beginning and ending age cells of the demographic target in one of the following
ways:
Click on the desired gender, start age, end age and then click OK.
Double-click on a demo in the list of demos in the Favorite Demos window.
Geography (single market)
Click Geography to change to a different survey area---Metro, TSA, DMA or a User Defined area with
Maximi$er/MediaPro data.
Maximi$er/MediaPro (single market)
Select the Maximi$er (for stations) or MediaPro (for agencies) button to select qualitative criteria
available with the Maximi$er/MediaPro data.
For a walk-through of selecting Maximi$er/MediaPro data, please refer to Chapter Three, Qualitative
Adjustments.
TAPSCAN and the TAPSCAN design are trademarks and registered marks of TAPSCAN, INC.
© 2001 Arbitron Inc. Used under license.
103
SCHEDULERS
Incorporating Qualitative Factors into the Schedule (single market)
This option allows you to merge qualitative information with pure radio data. Click Qualitative and you
will be prompted to select the type of adjustment you wish to use.
Click the QualiTAP button if you wish to use qualitative factors from QualiTAP.
Click the Manual button to incorporate manually created qualitative adjustments in the report.
If you are currently using qualitative adjustments, you may disable them by clicking Turn off.
Select the type of adjustment to use and the Qualitative Definition Menu will appear listing all previously
created qualitative adjustments. Highlight the adjustment you wish to use and click OK.
For a walk-through of creating an adjustment, please refer to Chapter Three, Qualitative Adjustments.
Once you have made your selections, click Next to move to the Stations tab.
Stations Tab
Selecting the Stations for Inclusion on the Schedule (single markets only)
You may select stations for your schedule in a variety of ways:
1) Click on the Select button and choose your stations from a roster of all stations in the market;
2) Click on Default to use stations which have previously been established as your default;
3) Click on the Top button—this will allows you to select the top number of stations in the market based on
a specific daypart and demo. If this option is selected, the Top Stations Select menu will be displayed
where you will designate the specified top number to use.
Once you have made your selections, click Next to move to the Dayparts tab.
OES Button—Optimum Effective Scheduling
What is an OES Schedule?
Optimum Effective Scheduling, referred to as “OES,” embraces the concept that a schedule obtaining a
higher frequency yields greater, or optimal, results. TAPSCAN makes creating an OES schedule easy since
you only have to set one parameter—the station(s) selection. The average weekly frequency of an OES
schedule will be around 4.2. The effective reach will be slightly more than half of your cume and about twothirds of your total reach. The Monday-Sunday, 6am-12m daypart will automatically be assigned to an OES
schedule. You may modify this daypart if needed—however you must use a daypart or a combination of
dayparts, which cover at least the Monday-Friday 6am-7pm daypart.
To quickly generate an OES schedule, click this button and the Optimum Effective Scheduling window will
be opened:
104
TAPSCAN User Manual
Station selection box
Note the station selection box…this field will reflect if a station selection has been made. If you want to
select a specific station that is not necessarily a Top Station, make that selection prior to activating the
OES option. Clicking the arrow key in this field will bring the following choices to screen:
Click on the line of the station selection you wish to use.
Use up and down arrows to scroll through more options.
You will be brought back to the Optimum Effective
Scheduling window where that selection will be
displayed.
Click the OK button and you will be taken directly to the ReachMaster schedule worksheet where you will
see the resulting OES schedule. You can then make the rate (cost) assignments if needed. NOTE: If you
modify the spot levels in any way, the OES schedule will be negated. Click Cancel and you
will return to the Stations tab.
Dayparts Tab
Selecting the Dayparts for the Schedule
Dayparts may be selected in two ways: The Add or Load List options.
Add
Click the Add button and you will be taken to the Daypart Selection Menu.
You can select Standard dayparts by clicking on the days, start time and end time and then click OK.
To select Non-Standard dayparts, select start day, end day, start time and end time and then click OK.
Choose a favorite daypart by either single-clicking on it and then clicking OK or you may simply
double-click on its label.
TAPSCAN and the TAPSCAN design are trademarks and registered marks of TAPSCAN, INC.
© 2001 Arbitron Inc. Used under license.
105
SCHEDULERS
Repeat these steps until all dayparts are defined.
For detailed instructions on this option, refer to Chapter Four, Common Options.
Load List
If you have previously defined and saved a daypart list, you can retrieve that list here. (This prompt will not
be available for use if you have not previously saved a daypart list.) After clicking on this button, the
Daypart List menu will appear. Identify the daypart list to be used by either clicking on that list and
clicking OK, or simply double clicking on that list. You will then be returned to the Dayparts tab.
Save List
To activate the Load List option, you must first save a dayparts list. To do this, create the dayparts to be
saved by utilizing the Add option. Once back at the Setup menu, you can save those dayparts by clicking
on Save List. This will bring to screen the Save Daypart List screen, and you will type in a description of
these dayparts (i.e.: Drive Times). Once that label is entered, click on OK, and you will be brought back to
the Setup screen. You will now notice the Load List option is now available.
Delete/Clear
Remove any one daypart from the selected list by highlighting it and clicking Delete. Clear will remove
all selected dayparts.
Once you have made your selections, click Next to move to the Goals tab.
Goals Tab
You can specify detailed goals to guide you as you create schedules in ReachMaster. Once you start
entering a schedule at the ReachMaster Schedule Worksheet, you can track how well your schedule is
meeting your goals by viewing the Goals tab at the top of the worksheet screen. The system will report
goals versus actual totals and the difference between them.
Setting goals to guide your scheduling in ReachMaster is optional. To set these goals, follow these steps:
1) Check the Use goals for this campaign box. This will enable the rest of the goaling setup options
on the screen.
2) You must then specify the daypart codes to be used (daypart codes are established in Setup, see
Chapter Two, Setup, Section 5) with the Add, Delete and Clear buttons.
3) Click on Specify your Campaign Goals and the Schedule Goals screen will appear from which
you will enter your goals:
106
TAPSCAN User Manual
You can set goals for:
• specific dayparts
• globally for each week
• globally for the total
schedule
Enter the information on
the appropriate lines.
See
below
for
instructions.
Setting the Goals
Click on any grid box to set a goal. Use the Tab or Enter keys or the mouse to move around the grid.
Daypart Grid Boxes
Type in goals for individual dayparts for GRP’s, % of weekly GRP’s, CPP, Cost or % of weekly Cost.
Weekly Total Grid Boxes
Type in weekly goals for GRP’s, CPP, Cost and % of total campaign Cost.
Campaign Total Grid Boxes
Enter goals for the entire campaign for GRP’s, CPP or Cost.
You can use goaling features in combination, such as entering a goal for % of weekly GRP’s and a weekly
goal for GRP’s and the system will assign the proper GRP’s per daypart for you. If you enter Weekly or
Campaign Total goals with no individual or weekly percentage guidelines, the system will assign the goals
evenly over the period.
Description
If you want to save this set of goals, you will need to enter a description then click OK.
Clear Goals
This button will wipe out ALL the goals you have entered. You will be asked to confirm before the system
removes the information.
Copy Weeks
This option lets you copy the goals from one week to one or more other weeks in the campaign. You can
the goals from one or several dayparts at once. Once you have set up the goals you want copied, click the
Copy weeks button. The Copy Weeks window will come up:
Type in the number
of the weeks to
which the goals are
to be copied in the
TO Week(s) field.
Type in the number of the week
that has the information to be
copied in the Copy from
week field.
If you want the goals to
be copied to all weeks,
click the All Other
Weeks button.
To select the Dayparts from which the goals are to be copied, highlight just one daypart, or to select
multiple dayparts:
TAPSCAN and the TAPSCAN design are trademarks and registered marks of TAPSCAN, INC.
© 2001 Arbitron Inc. Used under license.
107
SCHEDULERS
1) To select consecutively listed dayparts, hold down the mouse button and drag the mouse over all
the desired dayparts.
2) To select non-consecutively listed dayparts, hold down the Ctrl key and click on each daypart.
3) To select all the dayparts, click the Select All button.
Once you have selected the weeks and dayparts to be copied, click the Copy button.
Lock Goal
Once you have set your GRP, CPP or Cost goals, you can lock one of them so the system will not change
them as you manipulate the other two. For example, if you lock the GRP goals and then change CPP goals,
the system will change the Cost figures to match and leave the GRP goals alone. Conversely, if you change
the Cost goals the system will re-calculate the CPP goals to match. If you wish to disable the locks
completely, click the Clear Lock button.
View
You can toggle the screen display between the listing of all dayparts by week (All Dayparts) and a weekly
total screen at which you can set a week on hiatus (Totals/Hiatus).
To select a week for hiatus, highlight that week and then click the ON HIATUS button. The goals for that
week will be blanked out. Note however, the system will retain the goals you had for that week if you wish
to take if off hiatus. To take a week off hiatus, highlight that week and click the OFF HIATUS button. All
the goals you had entered for that week will now be displayed.
Load
To load a previously saved schedule goal scheme, click on the Load button. All the goaling schemes you
have saved will be listed. Click on the description of the schedule goaling scheme you want and click OK,
or you can simply double-click on the description.
Save
To save the current schedule goaling scheme, click Save. If you have not entered a description you will be
prompted to do so and then you will have to click Save again. Once the goaling scheme has been saved you
will see the message “This goaling scheme has been saved.” Click OK to return to the goaling grid.
OK
When you are satisfied with your goals, click OK to return to the ReachMaster Setup Wizard Goals tab.
Cancel
To exit the Schedule Goals screen and ignore any changes, click Cancel to return to the ReachMaster
Setup Wizard Goals Tab.
NOTE: The goals option will not be available at the Schedule Worksheet if you did not specify to Use
Goals in the ReachMaster Setup Wizard.
Once you have defined your goals, click Next to move to the Estimates tab.
108
TAPSCAN User Manual
Estimates Tab
This area of the ReachMaster Setup Wizard reflects how the scheduling worksheet will be configured (i.e.
what estimates will be displayed and in what order).
Layout
To hand-pick the estimates for the schedule worksheet, click the Layout button. This will bring the
TAPSCAN Estimate Selection for ReachMaster window to screen:
Use these buttons to
configure the desired
worksheet layout.
The Available Estimates box list
all those estimates that may be
selected.
The Include box reflects those
estimates that have been selected thus
far.
Button
Add
Function
Insert
When adding an estimate, the estimate is added to the bottom of the estimate selection list---this
means when at the scheduling worksheet, the estimate will appear at the end of the worksheet table.
Using this option lets you insert an estimate so that it may be placed in the exact area of the
worksheet desire. First, highlight the estimate which the new estimate will be placed in front of, click
the estimate to be inserted, then click the Insert button.
Delete
Removes selected estimates from the Include box meaning they will no longer be included on the
schedule worksheet. Simply highlight the estimate to be removed (in the Include box), and then click
Delete.
Clear
Removes all selected estimates from the Include box. You will then reselect all desired estimates.
Choose this option to add estimates to the Include box. Select estimates by double-clicking on the
desired estimate, or by highlight the estimate and clicking the Add button.
Click the OK button once the estimate selection has been made and you will return to the Estimates tab.
Default
If you would like to have the current group of estimates as the ReachMaster layout default, click the
Default button. Each time you use ReachMaster, these will be the estimates displayed.
TAPSCAN and the TAPSCAN design are trademarks and registered marks of TAPSCAN, INC.
© 2001 Arbitron Inc. Used under license.
109
SCHEDULERS
Finish
Once you have completed setting all the parameters, you may either click on the Finish tab at the top of the
window or the Finish button at the bottom of the window and you will advance to the ReachMaster
Schedule Worksheet.
The ReachMaster Scheduling Worksheet
Once all schedule parameters have been set, click OK and you will be taken to the ReachMaster Schedule Editing
window. The ReachMaster Schedule Editing window is used for both single and multi-market schedules and is
divided into two parts. The upper section of the screen is devoted to schedule descriptions and evaluations, accessed
by different tabs. The lower section is where you will input the actual schedule or make changes to an automatically
generated schedule.
For a multi-market schedule, click the
market list to select your other markets.
When changing markets, save your
schedule when prompted or all
estimates for the previous market are
deleted.
There will be no spots
assigned unless you
invoked OES scheduling.
There will be no rates assigned
unless you defined daypart names
with rates in Utilities or have
GridONE with an active rate card.
This is the body of the worksheet. It
is here that you will input/edit the
specific schedule details. Simply
click on the Spot and Rate columns
and input the appropriate spot
level/rate
for
that
particular
daypart/station. Move from field to
field by clicking on a different field,
or by pressing the Arrow keys.
Note the various worksheets of the lower section are represented by tabs- located at the bottom of the
window; the tabs are provided for each station and the market's totals. When completing a multi-market
schedule, an additional worksheet is provided to display the multi-market totals (MM Totals). Click on a
specific tab to change to that display.
Windows’ Task Bar Menu Options
Use the File option to perform various file functions:
This is where you will save the currently displayed dayparts so
that they may be viewed upon accessing the Dayparts Tab.
Create a new Broadcast Order from your schedule. You must
save your schedule first.
If you imported your rates from GridONE and an updated rate
card has become available since creating your schedule, click
this button and the updated rates will be imported into your
schedule.
Export your schedule to SalesScan, TvSCAN or MediaMaster
with just a click. These paths must have been established in
Setup for these options to be available
110
TAPSCAN User Manual
Access the Edit option to change most of the pre-set schedule parameters:
To copy the worksheet’s data to
the Windows’ Clipboard, highlight
the data to be copied, then select
this option.
These are the same settings as in the
ReachMaster Setup Wizard. Modify any setting
in the same manner as when previously
established.
To change some of the on-screen display options, select the View menu on the Windows’ task bar:
Use this option to select the
dayparts listed on the Dayparts
tab.
The Goal Column Options lets
you choose which goals will be
displayed on the Goals tab.
These day selections change the
information displayed on the
Hourly tab.
Toggle a Full-Screen with no
header tabs displayed.
Toggle the Goals tab to display
individual dayparts or totals
with hiatus information
To change, add or delete a daypart, click the Daypart setting on the Windows’ task bar:
Accessing these options allows you to perform any needed
maintenance to the daypart list for the current station.
Assign a daypart a “nick-name” with this option. This is the same
option as is available in the Utilities portion of TAPSCAN.
Change the selected station configuration by clicking Stations:
Add stations with this option. You will
have to assign dayparts to the new
station.
Remove the current station from the
schedule with the Delete option.
Add a Non-Rated station to the schedule with
this option. This is the same option as is
available in the Utilities portion of TAPSCAN
Clicking on the Schedule option will display other preset configuration settings that you may modify:
If this is a multi-week schedule, toggle
the Cume Factors on and off here. If a
check mark is placed to the left of this
field, the factors are turned on.
Edit your schedule goals here. This is
the same screen as in the Setup
Wizard. This option will not be
available if you did not specify goals
in setup.
Get detailed instructions on these
options in the following sections.
Enable schedule flighting by clicking this
option. See below for detailed instructions.
Configure the schedule for OES attainment
by selecting this option. The system will
then automatically generate an OES
schedule for the current station. (*You
must have a daypart or a combination of
dayparts that at least comprise MondayFriday 6am-7pm.)
This option lets you toggle between whole
dollars and dollars/cents increments.
To eliminate the Billboard column, remove
the check mark from the Use Billboards
field.
TAPSCAN and the TAPSCAN design are trademarks and registered marks of TAPSCAN, INC.
© 2001 Arbitron Inc. Used under license.
111
SCHEDULERS
Flighting in ReachMaster
If you are building a multiple week campaign, but each week does not contain identical spot levels or rates,
you will need to flight the schedule. If each week has the same spot levels and/or rates, it is easier to input
that amount outside the flighting environment since assigning a rate/spot level at the ReachMaster Schedule
Editing screen will assign that level/amount to all weeks of the schedule.
Schedules may be flighted by choosing Schedule, then Show Flighting. This will bring to screen a
week-by-week display of the schedule:
This example is a three-week
schedule—after clicking on Show
Flighting, all three weeks are
now visible on the worksheet.
Now you can input each week's spots and rates. Once the information has been entered, you may keep the
worksheet in the flighting display, or you may go back into Schedule, then remove the check mark next to
the Show Flighting option. You will then be brought back to the worksheet where only week one will be
visible. You will notice that all dayparts which have been flighted will display an asterisk (*) in the Spots
column. This indicates inconsistent spot levels for that particular daypart.
Cloning One Station’s Schedule to Another
This is a great shortcut if you are using the same dayparts, rates or spot levels for any or all stations
participating in the campaign. Click on Cloning, and the Schedule Cloning setup will be displayed:
You will now identify the station’s schedule to be copied and where you wish to copy it. You also have
your choice of what is to be copied: Dayparts Only, Dayparts and Spots, Dayparts and Rates, or Dayparts,
Spots and Rates. Once the proper settings have been input, click OK.
Copy Weeks Option
If you would like to copy a particular week of a schedule to a different week(s) of the same or different
station’s schedule, you will access the Copy Weeks feature of ReachMaster, located within the Schedule
option on the Windows’ task bar. This will bring the Copy Weeks window to screen:
112
TAPSCAN User Manual
Copy from Week
Designate which week of the current schedule (the one displayed on the
screen upon accessing this option) you wish to copy by entering that
number in this field. Example: Week One—enter “1” –Week Two—
enter “2” and so forth.
Click the Copy button once you are ready
to proceed with copying the week.
Copy to Designation
Input the number of the week(s) to where the
designated week will be copied in this field.
Make your entries in the 1,2,3, etc. format.
Alternatively, you may click the All Other
Weeks button if you wish to copy the week
to all other weeks of the station’s schedule.
Select which stations will receive the designated week’s schedule in this window. Make your selection in one of the
following ways:
To copy the schedule to only one station, single-click on that station, then click Copy.
To clone the schedule to multiple stations listed in continuous order, drag the cursor over the stations and click
Copy.
To copy the schedule to multiple stations not listed in a continuous order, single-click on each selection while
pressing the Ctrl key, then click Copy.
To automatically select all stations to receive the schedule, click the Select All button, then click Copy.
Clicking Clear will erase all station selections so that you may re-select.
Toggling Stations On and Off
You can turn stations on and off of the campaign without deleting the schedule by accessing the Toggle
option. Click Schedules and select Toggle Stations On/Off. The Toggle Stations window will then
be opened:
Click on the ON/OFF box next to the station to be
turned off/on. Once the correct toggle setting has
been input, click OK, and you will be taken back
to the ReachMaster worksheet. The campaign
totals will now reflect the revised schedule’s
achievement.
Billboarding
Billboarding is the capability to increase or decrease the Average Rating by giving credit for promotional
and news sponsorship spots. Billboards may be used in ReachMaster by clicking in the Billboard field,
next to the Daypart’s column; afterwards, input the desired adjustment.
One hundred (100) is the full rating value—110 will increase the rating by 10 percent—80 will yield an
average rating decreased by 20 percent.
NOTE: Billboarding only affects the average rating, whether increase or decrease; cume rating
will not be altered.
Proper billboarding can be accomplished two ways:
TAPSCAN and the TAPSCAN design are trademarks and registered marks of TAPSCAN, INC.
© 2001 Arbitron Inc. Used under license.
113
SCHEDULERS
The rating value can be increased with no increase in the spot level. (Spot level will only reflect those
advertisements paid by the client.)
Example: The advertiser is paying for three 60 second spots during Morning Drive. However,
in addition to the three paid spots, opening and closing news sponsorships will be included.
For this example, the spot level will stay at three, but the billboard value will be increased.
The rating value can be decreased and all promotional announcements/mentions and/or news
sponsorships are entered on a separate line than the paid commercials.
Example: The advertiser has purchased a promotional package containing spots to be aired
in several different dayparts. This package also includes 20 promotional spots that will air
sometime during the week (M-F 6A-12M). The schedule will be input showing the schedule
spots and costs as the package includes, and the promotional announcements will be
represented in an entry of the M-F 6A-12M daypart showing the 20 spots at no charge. The
difference between these promotional spots and the paid spots is that the Billboard value will
be decreased since these are promotional announcements and not "pure" commercials.
Allow Ratings Changes
This option will allow you to configure ReachMaster so that Average or Cume ratings or persons may be
changed (edited). This gives you the ability to estimate numbers according to a specific rationale.
Activating the Option
To turn this option on, at the ReachMaster worksheet, click Schedule, and place a check mark by (clickon) the Allow ratings changes option. The worksheet will then be configured to accept changes in
Average and Cume numbers. NOTE: While both Average and Cume numbers may be modified, but
changing one does NOT automatically change the other. For example, if you change the Average rating, the
original Cume rating will not be overwritten. If you wish for the Cume rating to be changed also, you must
hand input that estimate as well. Cume numbers may be estimated beyond a specific station’s total week
cume; however, they cannot be modified to a number higher than the selected target demographic’s total
population.
“What is ‘Estimating’?”
Basically, anytime you manipulate the published rating of a daypart it is considered to be estimating.
Estimating is only needed in specific situations such as a radio station’s change of formats, or the growth or
decline of a radio program’s popularity. However, in radio analysis, this feature is used primarily for sports
programming since, traditionally, this type of programming has the potential to radically change the size and
composition of a radio station’s regular listening audience.
NOTE: All estimated dayparts are marked as such on the screen and on all printed reports—the
system places a “*” symbol next to the daypart definition, indicating the rating/persons number
has been changed by the user. There is also a notation on the printed report stating what this
notation indicates.
“Why is it necessary to include a rationale when I estimate?”
Since estimating is simply a judgment call on the part of the person generating the report and is often
considered to be a “gray area,” it is imperative that you include the rationale explaining why you have
changed the rating. You may do this by:
• Generating a Cover Sheet detailing the estimating rationale;
• Using the ReachMaster label fields (they appear once you go to print);
• Typing the rationale in your word processor and including it with the ReachMaster schedule printout.
“What if I change a daypart’s estimate, but then wish to go back to the original number?”
There are three ways in which you may revert a daypart’s estimated rating to the original rating:
114
TAPSCAN User Manual
•
•
•
Use the Change Daypart option and re-select the same daypart;
Delete the daypart, then re-add the daypart (click Daypart, then select Add a daypart);
Turn off the Allow ratings changes option; however, this will revert all estimated dayparts back to
the original ratings.
Spot Goaling
Access this feature in one of the following ways:
At the ReachMaster worksheet, click Schedule, then select Spot Goaling Method.
Right-click, select Schedule and select Spot Goaling Method.
Double-click directly in the station’s spot field’s total line, then enter the desired spot level. Upon
moving the cursor from this field (by either pressing Enter or simply arrowing to a different field), the
Spot Goaling Method window will appear.
At the Spot Goaling Method window, you will establish how the system should assign the spot level.
Schedule (# of) spots EACH week
This option will take the spot level you enter and assign it to each week of the campaign.
Single Station Goaling
To enter a spot goal for a specific station, make that entry in the station’s Totals line. That amount will then
be assigned for each week of that station’s schedule.
For example: If you are working with a three-week campaign and enter a spot level of 20, the resulting
TOTAL spot level will be 60 for that station. The spot allocation per daypart will be distributed in one of
two ways:
1) If you currently have dayparts scheduled, spots will be distributed in the same proportion as the current
spot assignment;
2) If you do not have any dayparts scheduled, spots will be distributed based upon the number of quarter
hours in each daypart.
Total Campaign Goaling
If you wish to enter a spot goal for the TOTAL campaign (all stations), you will make that entry at the
Totals line (displayed in yellow). That desired spot level will then be assigned to each station/each week
of the campaign.
If you enter a goal at the Campaign Totals line for a multi-station campaign, the spot placement
per station will be dictated by the current percentage by which each station is currently
scheduled.
For example: Lets say you are working on a two-station campaign. Station A has 20 spots scheduled, and
Station B has been assigned 40 spots. If you enter a spot goal of 120, the resulting spot allocation will be as
follows:
Station A - 40 spots
Station B - 80
In addition, the total spot level for a three-week campaign would be 360.
Schedule (# of) spots across ALL weeks
This option will take the spot goal and spread it across all weeks of the campaign.
TAPSCAN and the TAPSCAN design are trademarks and registered marks of TAPSCAN, INC.
© 2001 Arbitron Inc. Used under license.
115
SCHEDULERS
Single Station Goaling
To enter a spot goal for a specific station, make that entry in the station’s Totals line. The system will then
spread that number of spots throughout the TOTAL campaign for that station.
For example: If you are working with a three-week campaign and enter a spot goal of 20, the 20 spots will
be distributed across all weeks, resulting with a TOTAL spot level (for that station) of 20.
Total Campaign Goaling
If you wish to enter a spot goal for the TOTAL campaign (all stations), you will make that entry at the
Totals line (displayed in yellow). That designated spot level will then be spread across all weeks of the
campaign, and throughout each week of the campaign.
If you enter a goal at the Campaign Totals line, spots will be placed across ALL weeks, and spot
placement will be dictated by the percentage the spots are currently allocated per station.
For example: You are working on a two-station/three week campaign. The current spot allocation per
station is the following:
Station A – 20 spots
Station B – 40 spots
If you enter a spot goal of 120, Station A will receive 40 spots, Station B will receive 80. The campaign
Totals line will display 120 spots.
Don’t show these options while scheduling
If you check this box, the Spot Goaling Method window will not appear each time you goal a specific spot
level. The last goaling option selected will be how the system handles the spot goaling assignment. To reactivate the Spot Goaling Method window, click Schedule (either on the Windows menu bar or by right
clicking), then select Spot Goaling Method.
After you have made your selection, you will then input the desired spot level into the corresponding Totals
line (if you accessed the Spot Goaling Method via the Schedule option, whether by from the Windows menu
bar or by right-clicking). If you access this option by double-clicking and entering a spot level, you will
then see that spot level distributed as specified at the Spot Goaling Method window.
On-the-fly Schedule Goaling
Schedule goals may be established at any time while at the ReachMaster worksheet.
To goal per daypart, place the cursor in the column of the estimate on which the goal will be based, then
enter the level to be achieved. For example, if I want to generate a schedule which will accumulate 50
GRP’s during the Monday-Friday 6am-7pm daypart, I will place the cursor in that daypart’s GRP column,
then enter 50.
To goal for the total campaign (all stations), you must be at the Totals display. To get there, click the
Totals tab located at the bottom of the worksheet, or double-click on the Totals row on the schedule
worksheet. Next you will place the cursor in the estimates column ON THE TOTALS ROW, then input
the appropriate goal.
Pressing Enter will signal to the system to begin processing the goaling information, and will soon thereafter
display the results of the goaling.
Saving and Retrieving Daypart Lists
If you have configured a listing of dayparts that will be used often, you may save the group of dayparts for
future retrieval.
116
TAPSCAN User Manual
Saving Daypart Lists
To save a Daypart List, click File and select Save Daypart List. You will then be prompted to give the
group of dayparts a name. Enter that name and click OK.
Retrieving Daypart Lists
You may retrieve a saved listing of Dayparts at the ReachMaster Setup screen by clicking the Load List
button, or at the ReachMaster worksheet by clicking on Dayparts, then selecting Add Daypart List:
This top box gives a listing of all of the saved daypart
lists. The bottom box shows a listing of all dayparts
contained within the highlighted daypart list.
To make a selection, highlight the daypart list and click OK;
alternatively, you may double-click on the listing. Click Cancel
to return to the previous window without selecting a daypart list.
The Delete option will delete the highlighted daypart list.
Scheduling Window’s Display Tabs
At the top of the ReachMaster worksheet (in the worksheet’s header area), notice the different tab options:
Consider these to be similar to a Rolodex—a quick way to view the area indicated by the tab’s label. Click
on any of the tabs to bring that particular tab’s display:
Tab
Description Tab
Function
Shows the basic schedule information. There is also a station list box that
allows you to pick the station to schedule. This is the default display.
Dayparts Tab
This tab lets you retrieve a saved daypart list and analyze each station’s
performance in each individual daypart. You must have previously saved a
daypart list in order to utilize this option— accomplished at the ReachMaster
Setup menu.
Upon clicking on this button initially, the daypart box will appear empty. Click
View on the Windows Tool Bar, then select Load Daypart List. Click on
the daypart list you wish to view, the system will process the data and the
information will then display on screen. This information is station specific.
Use the tabs on the bottom of the worksheet to toggle from station to station.
Hourly Tab
Here you can view each station’s hourly performance for Monday-Friday,
Saturday or Sunday.
Click on this tab and the hourly box will initially appear without any data
listed. Click the View button located on the Windows Tool Bar. The system
will default to the Monday-Friday hours (indicated by the check mark beside
that label). To see these hours, click on Show Hourly. To change to a
different hourly display, click View and click on the desired day.
TAPSCAN and the TAPSCAN design are trademarks and registered marks of TAPSCAN, INC.
© 2001 Arbitron Inc. Used under license.
117
SCHEDULERS
Qualitative Tab
If adjustments are being used, this will note the adjustment’s source, the
adjustment’s label (this will be what prints on the report header), as well as the
total and adjusted population. (If you wish to turn on adjustments, you will
access the Edit button on the Windows Tool Bar.)
Weekly Flow Tab
Clicking on this tab will bring to screen a graph representing the weekly GRP,
Reach, Cost or Spot achievement by the campaign. You can toggle so the
graph’s focus is the accumulating schedule achievement at this location as well.
Goals Tab
If you specified goals in the Setup Wizard, this tab will list the goals set versus
the actual schedule performance and accomplishment ratings. This information
can be viewed either by individual daypart on a weekly basis or by weekly
totals with hiatus notations.
NOTE: This tab will be present only if Goals were established when setting up
the schedule.
GridONE Tab
Lists several items from GridONE per daypart for each week of the schedule:
• G1 Rate, which is the actual rate listed on the rate card
• Lowest Rate, which is the G1 Rate with the tolerance factor calculated
• Inventory, which is the total number of spots available at 0% soldout
• Percent Sold, listing the percent of spots sold
• Avails, which is the number of spots remaining to be sold.
NOTE: This tab will be present only if rates were imported from GridONE.
Totals Tab (located
at the bottom of
worksheet)
Click the Totals tab and the Totals window will be brought to screen
displaying the total campaign’s effectiveness.
Spectrum Analysis
Spectrum Analysis allows you to graphically display your schedule's reach across all the age cells in your selected
demo. This shows you whether or not your schedule is over or under performing in the different age groups. You
may then make changes to your schedule to attain better distribution of the schedule's delivery across all the age
cells.
To access Spectrum Analysis, click Schedule and select Spectrum Analysis. The Spectrum Analysis window
will appear (displayed on the next page):
Click on Show Pop to turn off the population bars on the graph.
Target Demo shows only the cells for the selected demographic.
Clicking on All Cells will show all the age cells (12+) on the
chart.
Demo allows you to change your selected target demo.
Print allows you to print a Spectrum Analysis report.
Toggle allows you to toggle stations on and off in the schedule
and see the reach distribution for each, individually or together.
Use the Snapshots and View buttons to analyze
different Spectrum Analysis configurations (see below).
118
TAPSCAN User Manual
The Snapshots & View Options
This option allows you to capture up to four different Spectrum Analysis configurations. Configure the
Spectrum Analysis in the first desired setup, then click on one of the Snapshot buttons. You can then
change the report’s setup and save to another Snapshot. NOTE: The Snapshot option will not
permanently save a configuration; once you leave Spectrum Analysis, all snapshots are erased.
Once all configurations have been captured, click the View button:
Click on the various Snapshot tabs to
change to another Snapshot’s configuration.
Select Exit to leave the Snapshot window.
To leave Spectrum Analysis, click on Close and you will return to the ReachMaster Schedule Editing window.
E-commerce
The e-commerce function allows you to save Schedules in an XML file format compatible with many of the
emerging e-commerce companies. This format will be useful for EDI and is compatible with many e-commerce
specifications. As these opportunities become available, our clients will be informed.
Your XML formatted Schedules are stored in three folders -- Pending, Queue and Sent. You can view the contents of
these folders on the E-commerce page tab inside Tapscan. When you export Schedules, they are stored in the
pending folder. When you are ready to send Schedules to the e-commerce company, you move them to the Queue
folder, where the e-commerce company will then take the Schedules and route them to the recipients. As a final step,
processed Schedules are moved from the Queue to the Sent folder by the e-commerce company.
TAPSCAN and the TAPSCAN design are trademarks and registered marks of TAPSCAN, INC.
© 2001 Arbitron Inc. Used under license.
119
SCHEDULERS
Setting up the e-commerce feature
In order to use the e-commerce feature, you must be using Tapscan in Multi-User mode and have your contact
information entered.
1.
Click the Setup button to open the Tapscan Setup window.
2.
Verify that the "Configure TAPSCAN for Multiple Users" box is selected. If it's not, click the box to select it.
3.
Select the Personal page tab and enter your contact information.
Adding Schedules to the Pending list
The Pending list is where you can store schedules that you are working on, but aren't ready to send to your ecommerce company. You add schedules to the Pending list by using the Export feature. Any time that you modify a
120
TAPSCAN User Manual
schedule that's already in your Pending list, export the schedule again. When you create multi-market schedules,
import the schedules for each market individually.
To export schedules:
1.
Open the schedule
2.
Select the 'E-Commerce' page tab.
3.
Enter the name of the campaign in the 'Title' box.
4.
Enter the name of your company in the 'From' box.
5.
Enter the name of the company you are sending the schedule to in the 'Destination' box. If the company has an ecommerce ID number, enter it in the 'System ID' box.
6.
Click the Export button.
Moving Schedules to the Queue
When you want a Schedule to be picked up by your e-commerce company, move the schedule from the Pending to
the Queue list. After the Schedule is picked up, it will be moved to the Sent list.
To add a Schedule to the Queue:
1.
Select the Pending view.
2.
Select the Schedule.
3.
Click the Move to Queue button
.
Printing a ReachMaster Schedule
When you are ready to print the current schedule configuration, click File, then Print and the ReachMaster Reports
menu will be displayed:
TAPSCAN and the TAPSCAN design are trademarks and registered marks of TAPSCAN, INC.
© 2001 Arbitron Inc. Used under license.
121
SCHEDULERS
You may input up to three different lines of text that will be
displayed in the header of the printed report. Input those
labels here. Pressing the Tab key will advance you to the
next line.
Click on this Setup button to design the layout of the
Customized report.
Click on this Setup button to design the layout of the
Extended Demo Report.
Click on the RSP Setup button to select the category and
time period to be used for your Retail Spending Power
Report.
Select all of the reports you wish to print by placing an “X” in each of the report’s corresponding box.
Report
Resulting Printout
Standard Report
Prints the standard ReachMaster report reflecting all customary and frequently
used estimates.
Custom Report
Prints a report that is user-defined. You may select the estimates to include in
both the top and bottom sections of the report. The custom designs may be saved
for later use. Click on the Setup button next to the Custom Report label to design
your report.
The top portion of the report focuses on the daypart’s weekly performance. Click
on each estimate to include and press Add after each selection.
After the top portion of the report is designed, click the Campaign Totals tab.
As the label indicates, the bottom portion of the report focuses on the schedule’s
totals. Identify each estimate to use by clicking and selecting Add on each.
Once the report is prepared, click OK and your report will print.
Frequency Distribution
Report
Prints a report that shows the persons reached across different frequency levels for
the schedule.
Reach Accumulation
Report
Prints a report that shows the reach per station as well as the accumulated reach of
the campaign.
Extended Demo Report
Prints a report that shows schedule analysis for multiple demos. Click on the
Setup button next to the Extended Demo Report label to select your demos.
Campaign Goals Report
Prints a list of schedule goals versus the actual scheduled results. Includes percent
performance ratings. You can choose which goals will be included on the report
with View, Goal Column Options at the schedule worksheet.
Retail Spending Power
Report
Prints a report that shows the value of your schedule in terms of retail or service
sales of the persons reached. Click on the Setup button next to the Retail
Spending Power report button to select your category. Click on the arrow next to
the Time Period field to select the time period for your report.
Once you have identified the reports to be printed, click Print and all selected reports will be printed.
122
TAPSCAN User Manual
Generating a Broadcast Order from a Schedule
Broadcast Orders/Radio Proposals are created from ReachMaster schedules. You must first create a schedule in
ReachMaster and save it before it can be converted to any order.
Orders may be created immediately after a schedule is saved from within ReachMaster by clicking File, then Create
Broadcast Order. The schedule will then be copied to the Broadcast Orders portion of TAPSCAN in the appropriate
format. To access this order, please see the Broadcast Orders section of this chapter.
Saving & Retrieving a ReachMaster Schedule
ReachMaster schedules may be saved so that they may be retrieved for later use.
Saving a Schedule
To save a schedule, click on File, then Save or Save As. The following window will appear:
Click on the location where you would like to save the schedule:
Ratings Data Directory
Saves schedules in the current data subdirectory.
Floppy Drive A
Saves schedules on a floppy disk loaded in drive A.
Floppy Drive B
Saves schedules on a floppy disk loaded in Drive B.
User Directory
If you are operating TAPSCAN in a networked environment, you may elect to
save to and retrieve from your user directory.
Custom Path
You may save to and retrieve from a path other than the Ratings Data
Directory or User directory if needed. To define the directory path and
directory, use the Setup button that will appear once this option is selected.
After you select where the schedule will be saved, type in the description of the schedule, then click OK.
Loading (Retrieving) a Saved Schedule
If you have previously saved a ReachMaster schedule, you may retrieve that report in two different ways:
Click the Load button at the ReachMaster setup window;
From the ReachMaster worksheet display, click File then select Open.
The Load a Schedule window will then be displayed:
TAPSCAN and the TAPSCAN design are trademarks and registered marks of TAPSCAN, INC.
© 2001 Arbitron Inc. Used under license.
123
SCHEDULERS
Here, all saved schedules that reside in the current data directory will be listed in the top area of this
window. This area will display the schedule Description, Client name, the Date the schedule was saved, and
whether or not a Broadcast Order was generated along with the schedule.
Scroll through the different schedules by using the keys on the right side and bottom corners of this window.
Also, use the various options on this window to help you load the schedule in the desired format:
Field/Button
Function
To view detailed information about a schedule without having to first load the schedule,
Info Button
highlight the schedule then click this button. The Schedule Info screen will be displayed
showing various information pertaining to the schedule including: Station(s) included on
the schedule, schedule dates and schedule effectiveness (reach, GRP’s, CPP, etc.). If you
choose to load the schedule, click the Load button. Clicking Cancel will simply return you
to the Load Schedules window.
Load Schedule
From
This area of the Load Schedules window is where you may configure the system to search
for saved schedules in another area other than the TAPSCAN data subdirectory. Click on the
area from which you wish to load a schedule:
• Ratings Data Directory—Displays saved schedules in the current data subdirectory.
• Floppy Drive A—Displays saved schedules on a floppy disk loaded into Drive A.
• Floppy Drive B—Displays saved schedules on a floppy disk loaded into Drive B.
• User Directory—If you are operating TAPSCAN in a networked environment, you may
elect to retrieve from your user directory.
• Custom Path—You retrieve to and retrieve from a different path other than the Ratings
Data Directory or User directory if needed. To define the directory path and directory, use
the Setup button that will appear once this option is selected.
Load With
This area of the Load Schedules window is where you will identify the data on which the
schedule will be based:
• The original book on which the schedule was built—Schedule information will
be based upon the book on which the schedule was originally prepared.
• Default Book—Schedule information will be based on the current book.
• Original Always—Always retrieves schedules based upon the original book on which
the schedule was prepared.
• Default Always—Always retrieves schedules based upon the default book.
Setup Button
Use the Setup button to locate schedules that are not in the current data subdirectory.
Once the schedule you wish to load is presented on screen, highlight that specific line and click on OK.
The saved schedule will be loaded and you will be taken to the Schedule Editing Window.
SalesSCAN Interface
The SalesSCAN Interface may be used in ReachMaster in two ways:
Importing a Client from the SalesSCAN database to be used in the schedule.
124
TAPSCAN User Manual
Saving a ReachMaster schedule for import into SalesSCAN's database.
You must first set the SalesSCAN path in Setup. Once set, you will be able to access the system’s database.
To use a SalesSCAN client in a schedule:
At the ReachMaster Setup window, click on Client, then Add. You will then be given a listing of all the
clients in the SalesSCAN client database. You may then choose a client to be used in your schedule.
To save a schedule to SalesSCAN:
At the ReachMaster Schedule Editing window, click on File, then Export to SalesSCAN. Give the
schedule a name and it will be saved so that it may be imported into SalesSCAN.
TAPSCAN and the TAPSCAN design are trademarks and registered marks of TAPSCAN, INC.
© 2001 Arbitron Inc. Used under license.
125
SCHEDULERS
Reach Curves
Reach Curves offers the ability to analyze a station's reach potential and find at what point commercials aired on a
particular station will stop accumulating reach, and frequency will begin to increase dramatically.
To access Reach Curves:
Click File, New, Schedulers and select Reach Curves;
Click the Schedulers button on the toolbar then select Reach Curves;
From the Master Menu, click Schedulers then Reach Curves.
The Reach Curves Setup menu will appear:
Spot Range
This area reflects the beginning
and ending spot levels that will be
used as the benchmark for the
Reach Curve analysis. The system
will default to one as the
beginning level and 35 as the
ending. You may edit either of
these fields by placing the cursor
in the correct field and typing in
the revised spot level.
Establishing the Parameters of the Report
For detailed instructions on these options, refer to Chapter Four, Common Options.
Click on any button to change a default setting. You must select a station or combo for the analysis. You may also
set the range of spots to use for the run.
Market Selection
If you are using multiple markets, you may click the Market button to change to a different market.
Book Selection
To switch to a different survey book, click the Book button and make the appropriate selection.
Selecting the Daypart Focus of the Report
To define the daypart upon which this report will be based, click on Daypart. This will bring you to the
Daypart Selection Menu.
Select Standard dayparts by clicking on the days, the start time and the end time and then click OK.
To select Non-Standard dayparts, select a start and end day, start and end time and then click OK.
Choose a favorite daypart by single-clicking on it and then OK or simply double-click on its label.
126
TAPSCAN User Manual
Selecting the Demographic Focus
To change the current demo setting, click on Demo. This takes you to the Demo Selection Menu. Here
you will select the gender, and the beginning and ending age cells of the demographic target. Do this in one
of the following ways:
Click on the desired gender, start age, end age and then click OK.
Double-click on a demo in the list of demos in the Favorite Demos window.
Geography
Click Geography to change to a different survey area---Metro, TSA, DMA or a User Defined area with
Maximi$er/MediaPro data.
Maximi$er/MediaPro
Select the Maximi$er (for stations) or MediaPro (for agencies) button to select qualitative criteria
available with the Maximi$er/MediaPro data.
For a walk-through of selecting Maximi$er/MediaPro data, please refer to Chapter Three, Qualitative
Adjustments.
Combos
You will activate combos by clicking the Combos On button. Conversely, you may disable combos by
clicking on the Combos Off button.
You may select which combo page to use or perform any needed combo maintenance with the Edit
Combos button. This will bring up the Combo setup. After your selection is complete, select OK to be
taken back to the Setup screen.
Selecting the Reach Curve’s Station Focus
You will select the focus of the Reach Curve by clicking on the Station bar. A drop-down menu will be
displayed listing all stations available for selection:
Use the scroll bar to view
the complete listing.
Once the correct station is visible, single-click on that selection. You will be brought back to the Reach
Curves Setup window where the selected station will be displayed on the Station bar.
TAPSCAN and the TAPSCAN design are trademarks and registered marks of TAPSCAN, INC.
© 2001 Arbitron Inc. Used under license.
127
SCHEDULERS
The Reach Curves Display
Click OK when you are ready and the Reach Curve screen will then be displayed on the screen:
Reach Curves Table Display
To change any of the pre-selected
report parameters, click on the
corresponding button located here in
the report’s header, or click the Edit
option on the Windows task bar.
Change the graph format by clicking on
Chart, then making a selection from the
various graph type options.
There are additional columns of information including Eff. Reach and Percent of Cume.
Click the arrow key to bring these columns to screen. Also, use the up/down arrow keys
to bring to view the other spot levels so the reach attainment for each may be analyzed.
If you have multiple reports open simultaneously, you can switch to another display by clicking Window, then
select another display. You also may view them on the same screen at the same time by using the Tiling and
Cascading options, also located by clicking the Windows option.
To print this report, click the Print button on the TAPSCAN Tool Bar, or click File and select Print. The Print Job
window will appear indicating your report is being processed.
128
TAPSCAN User Manual
Broadcast Orders
Broadcast Orders gives advertising agencies the ability to send confirmation of a contracted schedule and the
placement of its spots to radio stations. If you're a radio station, you will be able to configure Broadcast Orders for a
station that will allow you to create orders for in-house use.
The labeling of some screens will be different from others contingent upon the configuration
orientation in which TAPSCAN is being operated---i.e. Agency or Station configuration. For
example, the Broadcast Order’s Calendar Report will be labeled as “Broadcast Order” if you are
configured to run as an advertising agency; however, if you are configured for a radio station, this
same screen will be labeled “Proposal.”
Broadcast Orders reads ReachMaster schedules and converts them into a customized format so that confirmation can
be sent to each station, and exact-day placement of spots can be illustrated. NOTE: You must first save your
schedule in ReachMaster before creating a broadcast order.
Broadcast orders may be accessed in multiple ways:
At the ReachMaster Schedule Editing window, click File, then select Create Broadcast Order;
In the Scheduler’s window, click Schedulers, then select Broadcast Orders;
As a separate program, click on the Radio Broadcast Orders icon.
The Broadcast Orders main window will then be displayed:
You will use the Broadcast Order’s toolbar to build the Order/Radio Proposal, as well as to configure/setup the
module to accommodate your company’s specifications.
TAPSCAN and the TAPSCAN design are trademarks and registered marks of TAPSCAN, INC.
© 2001 Arbitron Inc. Used under license.
129
SCHEDULERS
The Broadcast Order Toolbar
Button
New
Function
Open
Click this button to load a previously save Broadcast Order. You may also retrieve a saved Broadcast
Order by clicking File and selecting Open. Either way, the Load Broadcast Orders window will appear.
You will see a listing of all of the previously saved orders in the currently selected path (Load Schedule
From:). Highlight the order you wish to retrieve and click OK. You may also double-click on an order
name.
Click this button to create a new Broadcast Order from a previously saved ReachMaster Schedule.
(NOTE: You must have the schedule created and saved prior to accessing this function.)
Orders may be loaded from different paths:
• The Ratings Data Directory—displays saved scheduled saved within the current data path.
• Floppy Drive A—displays schedules saved on a floppy that resides in drive A.
• Floppy Drive B—displays schedules saved on a floppy that resides in drive B.
• User Directory—displays all schedule saved within the current user’s user subdirectory (when
operating in a networked environment).
• Custom Path—if you have saved a schedule to a different subdirectory other than the ratings data or
user directory, click this option, input the drive/path/subdirectory in the field to the right of this option.
The system will then display all saved schedules that currently reside in that area of the computer.
The Delete button will delete a highlighted order.
Save
This button allows you to save the current Broadcast Order. You may also retrieve a saved Broadcast
Order by clicking File and selecting Save. Either way, the Saved Broadcast Order Location window will
appear. Type in a description of your order (it will default to the ReachMaster schedule name) and choose
where you would like to save the order:
• The Ratings Data Directory—allows you to save the schedule in the same subdirectory as the ratings
data.
• Floppy Drive A—Lets you save a Order to a floppy which resides in drive A.
• Floppy Drive B—Saves the Order to a floppy that resides in drive B.
• User Directory—Will store the schedule within the current user’s user subdirectory (when operating in
a networked environment).
• Custom Path—Allows you to save the Order to a different subdirectory other than the ratings data or
user directory, click this option and input the drive/path/subdirectory in the field to the right of this
option.
Click OK when you're ready and the order will be saved. It may be retrieved later by clicking the Open
button.
Print
Prints the current Broadcast Order.
Database
Takes you to either the Agency or Station Database, depending upon the configuration mode under which
Broadcast Orders is being operated. (See section 3 below for more information about the databases.)
Setup
Takes you into the Broadcast Orders’ Setup section where all configuration and maintenance settings are
house. (See section 2 below for more information.)
Help
Brings to screen on-line Help. Alternatively, you may simply press F1.
Exit
Will exit you out of Broadcast Orders, back into the TAPSCAN Main Menu.
AutoPost
Accesses the AutoPost module. Refer to the AutoPost section of this chapter for instructions.
130
TAPSCAN User Manual
Broadcast Orders Setup
Broadcast Orders may be configured for either and advertising agency or a radio station.
Advertising Agency Setup
Click on the Setup button on the Broadcast Orders toolbar to begin the configuration process. The Radio
Broadcast Orders Setup window will appear:
Your first step will be to fill in the Agency/Station Information fields. Click on the Agency
Configuration field first. This will configure Broadcast orders for an Agency. Now you should type in
your company name, address, telephone numbers, buyer name, etc. Be sure to fill in each field.
The next step is to determine if there is an interface available for your traffic system. Click in the System
field to see a listing of the available interfaces. If you have one of these systems, click on the name to select
it. Then choose either an automatic or prompted save for the interface file when you save a broadcast order.
Contact Customer Service if you have questions concerning the interfaces.
Now you should select the spot placement you would like for your broadcast orders. The Distributed option
will distribute the spots by daypart across the days of the week for the daypart (ex. 10 spots for MondayFriday 6A-10A will place two spots in each day). You will also have the option to choose Early Week or
Late Week if you select distributed. This will tell the system where you would like the heaviest
concentration of spots if they can't distribute evenly across all days in the daypart (ex. 8 spots for MondayFriday 6A-10A will have two spots in three of the days and one spot in the remaining two days. The Early
Week option will place the two spots in Monday, Tuesday, and Wednesday. The Late Week option will
make the two-spot days Wednesday, Thursday, and Friday.). The Rotators option will place all spots in the
Rotator field on the order.
You should now specify how the billing should be calculated. Select Gross, Net, or Both. If you select
either Net or Both, you should then type in a commission percentage.
The Comments button allows you to set up different comment text to be included on the orders. Click
this button to create comments to be printed on your broadcast orders. When you click this button the
following window will appear:
TAPSCAN and the TAPSCAN design are trademarks and registered marks of TAPSCAN, INC.
© 2001 Arbitron Inc. Used under license.
131
SCHEDULERS
Type in the comments you would like to print. When you are finished, click Save to save them into a file
for later use or Default to make them your default comments. Load will retrieve previously saved
comment files. Clear will remove all of the text from the text window. Click OK when you are finished.
The Makegood button allows you to set up different makegood policies (also to be used on the orders).
When you click this button the following window will appear:
Type in the information you would like to print. When you are finished, click Save to save it into a file for
later use or Default to make it your default makegood policy. Load will retrieve previously saved
makegood policies. Clear will remove all of the text from the text window. Click OK when you are
finished.
Click OK when you are finished and the configuration will be complete.
Radio Station Setup
Click on the Setup button on the Broadcast Orders toolbar to begin the configuration process. The Radio
Broadcast Orders Setup window will appear:
Your first step will be to fill in the Agency/Station Information fields. Click on the Station
Configuration field first. This will configure Broadcast orders for a Station. Now you should click in the
Station field and select your station name. Now type in the address, telephone numbers, etc. Be sure to
fill in each field.
Now you should select the spot placement you would like for your broadcast orders. The Distributed option
will distribute the spots by daypart across the days of the week for the daypart (ex. 10 spots for MondayFriday 6A-10A will place two spots in each day). You will also have the option to choose Early Week or
Late Week if you select distributed. This will tell the system where you would like the heaviest
concentration of spots if they can't distribute evenly across all days in the daypart (ex. 8 spots for MondayFriday 6A-10A will have two spots in three of the days and one spot in the remaining two days. The Early
Week option will place the two spots in Monday, Tuesday, and Wednesday. The Late Week option will
make the two-spot days Wednesday, Thursday, and Friday.). The Rotators option will place all spots in the
Rotators field on the order.
132
TAPSCAN User Manual
The Comments button allows you to set up different comments text to be included on the orders. The
Makegood button allows you to set up different makegood policies (also to be used on the orders).
You should now specify how the billing should be calculated. Select either, Gross Net, or Both. If you
select either Net or Both, you should then type in a commission percentage.
Click OK when you are finished and the configuration will be complete.
Broadcast Orders Agency & Radio Station Database
The Broadcast Orders database will consist of radio stations if configured for an advertising agency or advertising
agencies if configured for a radio station.
Radio Stations’ Database
When configured for an agency, Broadcast Orders creates a radio stations database which is used for the
printed report. You will need to input the database information for each station you use. This information
will be stored in the database file so it will need to be entered only once.
Click on the Database button on the toolbar and the Broadcast Orders Station Address Database window
will appear:
The first step is to select a station. Click in the Station field to select the station to use. You will be
shown a list of all the stations in the currently selected market. Now you enter the Reps for the station.
Click the Add button to add reps. You may add up to 10 reps per station. Clear will remove all the reps
from a station. Edit will allow you to change a rep's name. Delete will delete a highlighted rep from the
list. The next step is to type in the address, phone numbers, etc. The Clear button will remove all of the
address information for the station.
Click the Station field to add additional stations to the database.
Click OK when you are finished.
Agency Database
When configured for a station, Broadcast Orders creates an advertising agency database which is used for
the printed report. You will need to input the database information for each agency you do business with.
This information will be stored in the database file so it will need to be entered only once.
Click on the Database button on the toolbar and the Broadcast Order Agency Database window will
appear:
TAPSCAN and the TAPSCAN design are trademarks and registered marks of TAPSCAN, INC.
© 2001 Arbitron Inc. Used under license.
133
SCHEDULERS
Click the Add button to add contacts.
Clear will remove all the contacts from
an agency.
Click the New button to add
agencies to the database.
Edit will allow you to
change a contact's
name.
Delete will delete a highlighted
contact from the list.
Click the Delete button to
delete an agency from the
database.
The Clear button will remove
all of the address information
for the agency.
The first step is to add an agency. Click New to add an agency to the database. Now enter the contacts for the
agency. You may add up to 10 contacts per agency. The next step is to type in the address, phone numbers, etc.
Click OK when you are finished.
Creating a Broadcast Order
Broadcast Orders are created from saved ReachMaster schedules. You must first create a schedule in ReachMaster
and save it before it can be converted to an order.
Orders may be created immediately after a schedule is saved from within ReachMaster by clicking File, Create
Broadcast Order. You can also access Broadcast Orders from the Schedulers. If accessed in this manner, you can
click the New button on the toolbar to see a listing of all the saved ReachMaster schedules. Select one and it will be
automatically converted to an order.
Once an order is created, the Broadcast Order will appear under the toolbar. Spots will be assigned according to
your specifications in Setup (distributed or rotated). Following is an example of a Broadcast Order:
Click in the fields on the spreadsheet to make changes to a station's order. Click on the station tabs at the bottom of
the screen to switch stations.
Click on the Weekly Totals tab to see a weekly breakout of the totals of all the stations' orders combined.
Click on the Station Totals tab to see totals for all of the stations in the schedule.
The Description tab above the spreadsheet shows a description of the schedule. You can click on the Demo button
to change the demo for the schedule. You can change stations by clicking on the station list box and selecting a new
station.
134
TAPSCAN User Manual
The Header tab allows you to input header information for the station orders - Start Date, End Date, Client,
Campaign, Invoice #, Control #, and whether the order is a New Order, a Cancellation, or a Revision (and the
Revision #). The Dates, Client, and Campaign information will be imported from the ReachMaster schedule. Click
in any field to make a change.
The Comments tab is used for inputting comments and a makegood policy for each station.
When you are finished with the order, you can print by clicking the Print button. You can also save the order by
clicking the Save button. Previously saved orders may be accessed by clicking the Open button.
Top Menu Bar Options
Access the Windows menu bar to perform various options.
File
Click on File to:
• Create a New Order
• Open a previously saved order
• Close the current Order
• Save the current order
• Export the Order to your Accounting program
• Export the Order to SalesSCAN
• Print reports
• Access the Print Setup
• Create a Cover Sheet
• Exit Broadcast Orders.
Edit
Click Edit to:
• Copy highlighted information from the spreadsheet to the clipboard
• Copy one station’s information to another’s with Copy Weeks (same option as in ReachMaster)
• Change the current Demo
• Change the Global Spot Length
• Input the name of the buyer
• Change the Client Name
• Turn Multi-Week Cumes factors on and off.
Utilities
From here you can access the Addresses database and the Setup window.
Printing a Broadcast Order
Broadcast Orders reports may be accessed two ways:
Click the Print button;
Click File and then select Print.
The Radio Broadcast Orders Reports window will appear:
TAPSCAN and the TAPSCAN design are trademarks and registered marks of TAPSCAN, INC.
© 2001 Arbitron Inc. Used under license.
135
SCHEDULERS
This screen has three different reports
you may access. Click on each tab’s
header to view that report’s various
options.
The Broadcast Orders Tab
Prints broadcast orders/proposal (depending upon how your system is configured—Agency vs. station) for
the stations in the schedule. When chosen, the Toggle Stations window will appear. All stations will be
selected to print. You may turn off stations by clicking on them and removing the check mark.
Include Station Totals on Order - This will default to being on. Click the box to turn it off if you do not
want to print the station totals on the orders.
Include Broadcast Monthly Breakout - This will also default to being on. Click the box to turn it off if
you do not want to print the monthly billing breakout on the orders. The billing breakout will be based on
the broadcast calendar.
Compress Consecutive Matching Weeks - If two or more weeks of your order are identical, this option
will save space by listing those weeks as one and indicating which weeks that order covers.
Calendar Report
This report will print the order/proposal in a graphical format. After you click this tab, the following
options will appear:
Check on the various options you wish to include on the report. There is a limit of two estimates that can be
printed on the report. After you have obtained the appropriate configuration, click the OK button. The
calendar report will then be generated.
Totals
Station Totals Report - Prints a report of the schedules' station totals.
Weekly Totals Report - Prints a report that shows a weekly summary of the schedule.
If you have configured Broadcast Orders for a radio station, you will see a listing of the agencies in your
database from which to choose to include on the broadcast order.
Click on the reports you wish to print then click OK to begin printing.
136
TAPSCAN User Manual
Accounting & Traffic Interfaces
The following section will outline how to establish the interface between Broadcast Orders and your
Accounting/Traffic system.
Ad Aid
To activate the Ad Aid interface you must first click Setup and then choose Ad Aid as your
accounting interface. You will notice Automatic Save and Prompted Save below the interface list box
when you select Ad Aid as the accounting system. Select one or the other. When you click the
save button, Automatic Save will always launch the Ad Aid export window. Prompted save will first
ask you if you would like to export to accounting.
There are two ways to export orders to accounting:
1) Click File, Export to Accounting;
2) Click the Save Button, save the order, then export it to accounting.
You will be prompted to select the Saved Accounting Interface File Location. Click on the
appropriate button for the desired location. If you select a custom path, a field will appear below to
type in your custom path. Click OK when you have selected your path.
When exporting, you must first input header information as required by Ad Aid. You will have to
enter Client Code, Product Code, and Campaign Code. Click OK and the file will be exported.
Ad Input
To activate the Ad Input interface you must first click Setup and then choose Ad Input as your
accounting interface. You will notice Automatic Save and Prompted Save below the interface list
box when you select Ad Input as the accounting system. Select one or the other. When you click
the save button, Automatic save will always launch the Ad Input export window. Prompted save
will first ask you if you would like to export to accounting.
There are two ways to export orders to accounting:
1) Click File, Export to Accounting.
2) Click the Save Button, save the order, then export it to accounting.
When exporting, you must first input header information as required by Ad Input. First be sure to
enter a buyer name in Setup. Now click the Header tab and enter the client name in the Client
field. Now enter the Ad Input client id number in the Control field. Enter the product in the
Campaign field. Finally, enter the Ad Input invoice number in the Invoice field. If you have
multiple stations in the order, you must enter the header information for each station. Click the
station tabs along the bottom or use the list box in the description tab to switch stations.
Adman
To activate the Adman interface you must first click Setup and then Adman as your accounting
interface. You will notice Automatic Save and Prompted Save below the interface list box when
you select Adman as the accounting system. Select one or the other. When you click the save
button, Automatic Save will always launch the Adman export window. Prompted save will first ask
you if you would like to export to accounting.
There are two ways to export orders to accounting:
1) Click File, Export to Accounting;
2) Click the Save Button, save the order, then export it to accounting.
TAPSCAN and the TAPSCAN design are trademarks and registered marks of TAPSCAN, INC.
© 2001 Arbitron Inc. Used under license.
137
SCHEDULERS
You will be prompted to select the Saved Accounting Interface File Location. Click on the
appropriate button for the desired location. If you select a custom path, a field will appear below
to type in your custom path. Click OK when you have selected your path.
When exporting, you must first input header information as required by Adman. For each station
you will have to enter whether the export is new or a revision, Order Number, Client Code, and
Media Type. If you have multiple stations in the order, you must enter the header information for
each station. Fill out the information one station at a time and click OK when each is completed
and the next station will come up. When all stations have been addressed, click OK and the file
will be exported.
Admark
To activate the ADMARK interface you must first click Setup and then choose ADMARK as your
accounting interface. After you have selected this option, you will see the Setup button appear.
Click on this to establish the path to the ADMARK Accounting System.
You will notice Automatic Save and Prompted Save below the interface list box when you select
ADMARK as the accounting system. Select one or the other. When you click the save button,
Automatic Save will always launch the ADMARK export window. Prompted save will first ask you
if you would like to export to accounting.
There are two ways to export orders to accounting:
1) Click File, Export to Accounting;
2) Click the Save Button, save the order, then export it to accounting.
You will then be prompted to enter information that is relevant to the ADMARK Accounting
System. Enter this information then click the Export button.
When exporting, you must first input header information as required by Admark. First be sure to
enter a buyer name in Setup. Now click the Header tab and enter the client name in the Client
field. Now enter the ADMARK client id number in the Control field. Enter the product in the
Campaign field. Finally, enter the ADMARK invoice number in the Invoice field. If you have
multiple stations in the order, you must enter the header information for each station. Click the
station tabs along the bottom or use the list box in the description tab to switch stations.
AdWare
To activate the AdWare interface you must first click Setup and then choose AdWare as your
accounting interface. AdWare requires one-character daypart codes for the dayparts to be
exported in all orders. The daypart codes button will appear when you select AdWare. Click on it
to set up your daypart codes. You will have to enter them only once. Select dayparts one at a
time and assign the codes required by AdWare. If you have an order with a daypart that you have
not previously entered, you will be told to enter the code for the daypart before you can export the
order.
You will notice Automatic Save and Prompted Save below the interface list box when you select
AdWare as the accounting system. Select one or the other. When you click the save button,
Automatic save will always launch the AdWare Export window. Prompted save will first ask you if
you would like to export to accounting.
There are two ways to export orders to accounting:
1) Click File, Export to Accounting.
2) Click the Save Button, save the order, then export it to accounting.
138
TAPSCAN User Manual
When exporting to AdWare, the Export Schedule to AdWare window will appear. You must first
input all of the information required for the AdWare Export Defaults fields. You can then click the
Default button and this information will be stored for future use. You will not have to enter it again.
Now you must enter the Client Code, Product Code and Estimate for this order. You will have to
enter this information every time you export an order. Click Export when you are ready and the
order will be exported to the AdWare system.
CBSI
To activate the CBSI interface you must first click Setup and then choose CBSI as your traffic
interface. After you have selected this option, you will see the Setup button appear. Click on this
to establish the path to the CBSI Traffic System.
You will notice Automatic Save and Prompted Save below the interface list box when you select
CBSI as the traffic system. Select one or the other. When you click the save button, Automatic
Save will always launch the CBSI export window. Prompted save will first ask you if you would
like to export to traffic.
There are two ways to export orders to traffic:
1) Click File, Export to Traffic.
2) Click the Save Button, save the order, then export it to traffic.
You will then be prompted to enter information that is relevant to the CBSI Traffic System. Enter
this information then click the Export button. When completed, a message will come up informing
you the order export was successfully exported.
When exporting, you must first input header information as required by CBSI. First be sure to
enter a buyer name in Setup. Now click the Header tab and enter the client name in the Client
field. Now enter the CBSI client id number in the Control field. Enter the product in the Campaign
field. Finally, enter the CBSI invoice number in the Invoice field. If you have multiple stations in
the order, you must enter the header information for each station. Click the station tabs along the
bottom or use the list box in the description tab to switch stations.
Clients & Profits
To activate the Clients & Profiles interface you must first click Setup and then choose Clients &
Profits as your accounting interface.
You will notice Automatic Save and Prompted Save below the interface list box when you select
Clients & Profits as the accounting system. Select one or the other. When you click the save
button, Automatic Save will always launch the Clients & Profits export window. Prompted save
will first ask you if you would like to export to accounting.
There are two ways to export orders to accounting:
1) Click File, Export to Accounting;
2) Click the Save Button, save the order, then export it to accounting.
You will be prompted to select the Saved Accounting Interface File Location. Click on the
appropriate button for the desired location. If you select a custom path, a field will appear below
to type in your custom path. Click OK when you have selected your path.
When exporting, you must first input header information as required by Clients & Profits. For each
station you will have to enter Client Number, Vendor Number Product ID, Job Number and Task
Number. If you have multiple stations in the order, you must enter the header information for each
station. Fill out the information one station at a time and click OK when each is completed and the
TAPSCAN and the TAPSCAN design are trademarks and registered marks of TAPSCAN, INC.
© 2001 Arbitron Inc. Used under license.
139
SCHEDULERS
next station will come up. When all stations have been addressed, click OK and the file will be
exported.
Control G
To activate the Control G interface you must first click Setup and then choose Control G as your
accounting interface. You will notice Automatic Save and Prompted Save below the interface list
box when you select Control G as the accounting system. Select one or the other. When you
click the save button, Automatic save will always launch the Control G export window. Prompted
save will first ask you if you would like to export to accounting.
There are two ways to export orders to accounting:
1) Click File, Export to Accounting.
2) Click the Save Button, save the order, then export it to accounting.
When exporting, you must first input header information as required by Control G. First be sure to
enter a buyer name in Setup. Now click the Header tab and enter the client name in the Client
field. Now enter the Control-G client id number in the Control field. Enter the product in the
Campaign field. Finally, enter the Control G Job ID number in the Invoice field. If you have
multiple stations in the order, you must enter the header information for each station. Click the
station tabs along the bottom or use the list box in the description tab to switch stations. When
exporting, you will be asked if you would like to export all stations in the order. Click Yes and
export or No and select the stations to be exported.
Custom One
To activate the Custom One interface you must first click Setup and then choose Custom One as
your accounting interface. You will notice Automatic Save and Prompted Save below the interface
list box when you select Custom One as the accounting system. Select one or the other. When
you click the save button, Automatic Save will always launch the Custom One export window.
Prompted save will first ask you if you would like to export to accounting.
There are two ways to export orders to accounting:
1) Click File, Export to Accounting;
2) Click the Save Button, save the order, then export it to accounting.
You will be prompted to select the Saved Accounting Interface File Location. Click on the
appropriate button for the desired location. If you select a custom path, a field will appear below
to type in your custom path. Click OK when you have selected your path.
Datatech
To activate the DataTech interface you must first click Setup and then choose DataTech as your
accounting interface.
You will notice Automatic Save and Prompted Save below the interface list box when you select
DataTech as the accounting system. Select one or the other. When you click the save button,
Automatic Save will always launch the DataTech export window. Prompted save will first ask you
if you would like to export to accounting.
There are two ways to export orders to accounting:
1) Click File, Export to Accounting;
2) Click the Save Button, save the order, then export it to accounting.
140
TAPSCAN User Manual
You will be prompted to select the Saved Accounting Interface File Location. Click on the
appropriate button for the desired location. If you select a custom path, a field will appear below
to type in your custom path. Click OK when you have selected your path.
When exporting, you must first input header information as required by DataTech. You will have to
enter Client ID, Product ID, and Est Number. Click OK and the file will be exported.
J.D.S.
To activate the J.D.S. interface you must first click Setup and then choose J.D.S. as your
accounting interface. J.D.S. requires two-character daypart codes for the dayparts to be exported
in all orders. The daypart codes button will appear when you select J.D.S. Click on it to set up
your daypart codes. You will have to enter them only once. Select dayparts one at a time and
assign the codes required by J.D.S. If you have an order with a daypart that you have not
previously entered, you will be told to enter the code for the daypart before you can export the
order. You will also need to enter your media code (RD).
You will notice Automatic Save and Prompted Save below the interface list box when you select
J.D.S. as the accounting system. Select one or the other. When you click the save button,
Automatic save will always launch the J.D.S. Export window. Prompted save will first ask you if
you would like to export to accounting.
There are two ways to export orders to accounting:
1) Click File, Export to Accounting.
2) Click the Save Button, save the order, then export it to accounting.
When exporting to J.D.S., the system will ask you to enter the four-character client, product and
estimate codes for this order. Enter them as required by J.D.S. You will also need to select the
path to where the order should be saved.
The interface file will automatically be named finance.jds. You will not need to type in a filename
when saving the interface file. If the interface file already exists when a order is saved, you may
either create a batch transfer with multiple orders or overwrite the pre-existing order.
Silent Partners
To activate the SILENT PARTNERS interface you must first click Setup and then choose SILENT
PARTNERS as your accounting interface.
You will notice Automatic Save and Prompted Save below the interface list box when you select
SILENT PARTNERS as the accounting system. Select one or the other. When you click the save
button, Automatic Save will always launch the SILENT PARTNERS export window. Prompted
save will first ask you if you would like to export to accounting.
There are two ways to export orders to accounting:
1) Click File, Export to Accounting;
2) Click the Save Button, save the order, then export it to accounting.
You will then be prompted to enter information which is relevant to the SILENT PARTNERS
Accounting System. Enter this information then click the Export button.
When exporting, you must first input header information as required by Silent Partners. First be
sure to enter a buyer name in Setup. Now click the Header tab and enter the client name in the
Client field. Now enter the SILENT PARTNERS client id number in the Control field. Enter the
product in the Campaign field. Finally, enter the SILENT PARTNERS invoice number in the
Invoice field. If you have multiple stations in the order, you must enter the header information for
TAPSCAN and the TAPSCAN design are trademarks and registered marks of TAPSCAN, INC.
© 2001 Arbitron Inc. Used under license.
141
SCHEDULERS
each station. Click the station tabs along the bottom or use the list box in the description tab to
switch stations.
142
TAPSCAN User Manual
AutoPost
AutoPost will allow you to create a post for any Broadcast Order/Radio Proposal. Enter a post for a Broadcast
Order and the program will reconcile it for you as well.
The AutoPost program can only be accessed from the Broadcast Orders screen.
Setting Up a Post
Automatically Setting Up a Post
If you have an order loaded when you click on the AutoPost button, you will be asked “Would you like to
create a post based on the currently loaded Broadcast Order?” Answer Yes and the information for the
current Broadcast Order will be loaded and the Posting screen will appear.
Manually Setting Up a Post
You can manually set up a post for a saved Broadcast Order by either clicking on the AutoPost button from
the Broadcast Order screen with no order loaded or answering NO to “Would you like to create a post
based on the currently loaded Broadcast Order” prompt. Either way, the Post Setup window will come up.
The Post Setup has two tabs of information, the Client Information tab and the Data Selection tab. To
select the Broadcast Order to post against, click on the Original Order button on the Client Information
tab. The Load Order/Proposals window will come up. Highlight the desired order and click Load. Once
the information has loaded into the Post Setup window, you can either accept the information as loaded or if
needed, you may add or change information associated with the Broadcast Order before you begin the post.
Click on any of the following buttons to make additions or changes.
Client Information Tab
Client – click on this button to access the Client Selection window. This is an optional field; you do
not have to assign a client.
Agency – click in this field and type in the agency name. This is also an optional field.
Buyer – click in this field and type in the buyer’s name.
Original Order – click on this button to select the Broadcast Order upon which the post will be
based.
Stations – click on each station you want to include in the post.
Delete Station – if you want to remove a station, highlight that station and click Delete.
Clear All Stations – if you want to remove all the selected stations, click this button. You must reselect at least one station after clearing.
Invoice #, P.O. #, Job # – you may optionally enter multiple invoice numbers, purchase order
numbers and job numbers for each station.
TAPSCAN and the TAPSCAN design are trademarks and registered marks of TAPSCAN, INC.
© 2001 Arbitron Inc. Used under license.
143
SCHEDULERS
Data Selection Tab
Post Book – click this button and the Book Selection window appears. Choose the book upon which
the post will be based.
Demo(s) – this button brings up the Demo Selection. You may choose several demos for your post.
Delete – to remove a selected demo, highlight that demo and click this button.
Dates/Start Date/End Date – you need to assign specific dates for the post. Dates will bring up the
Broadcast Calendar for both start and end dates or you can select the start and end dates separately by
clicking on the appropriate button.
You can open a previously saved post by clicking on Open Post. This will bring up a list of all your
saved posts. Highlight the appropriate post and click OK.
If you want to remove the information you have entered to start over, select Clear Post. A
confirmation will come up, “Clear all header information for this post?”.
To exit from the AutoPost program, click Cancel.
When you are satisfied with your setup, click OK and you will advance to the Posting screen.
Posting Screen
This screen is split into two tabs, the Post tab where you enter the actual invoiced spots and the Reconcile tab where
the reconciliation information is listed.
Post Tab
From this screen you will enter the actual invoiced information. At the top of the tab screen you will enter
the station, month/day/year, time, daypart, invoiced rate, and length for each spot invoiced. Use the Tab
key to advance to the next field. You can click on any field to change an entry if needed.
Click on the Station field to begin, using the down arrow to select. This selection will remain the default
until changed. Enter the Month/Day/Year, and then after entering the spot length, click the Tab key again
144
TAPSCAN User Manual
and you will advance to the Add Line button. Hit Enter to add the line to the post at the bottom of the
screen or you can click on the Add Line button with your mouse.
Once a spot has been added to the posting information at the bottom of the Post tab, you can add
comments by clicking on the Comments field for the line. If a spot was invoiced for a different rate, click
on Approved Rate for that line and enter the appropriate amount.
Reconcile tab
Lines in yellow represent ordered spots. Lines in gray type represent invoiced spots that could be autoreconciled. Data in red represent information that, although reconciled, varies from ordered specifications.
Manual reconciliation
Lines in black type at the bottom of the Reconcile tab represent invoiced spots that could not be autoreconciled. To manually reconcile these spots, click on the Order # field and enter the Order # for the line
against which the spot should reconcile and hit Enter. The invoiced spot will then be transferred under
the appropriate ordered line.
Comparative Summary
At the bottom of the Posting screen a summary of both the original order and the reconciled spots of the
invoice is listed next to each other for comparison. This summary includes GRP’s, Reach, Frequency and
other estimates. For the posted data, you can switch between all stations and a selected station by clicking
on the Choose Summary button.
Printed reports
Three types of reports can be produced:
1) Post Summary Report
This report lists the invoiced spots with details and a comparative summary between the order and the post.
You have the option to customize the report at an option screen where you select how much detail will be
included on the report. Basically, this report mimics the Post Tab.
2) Post Reconciliation Report
This report lists the invoiced spots as reconciled with the ordered spots with a comparative summary. You
have the option to customize this report as well. This report mimics the Reconcile Tab.
3) Post Spot Rotation Summary Report
This report lists the invoiced spots on a weekly table of days and hours.
TAPSCAN and the TAPSCAN design are trademarks and registered marks of TAPSCAN, INC.
© 2001 Arbitron Inc. Used under license.
145
SCHEDULERS
Rate and Revenue
The Rate and Revenue program will project sales for your station. You will specify the average rate, units per hour,
and commission percentage and the program will project gross and net sales on a weekly, monthly and annual basis
at different soldout levels.
You can access the Rate and Revenue program in one of three ways:
From the Master Menu, click Schedulers and then select Rate and Revenue
Click the Schedule button on the toolbar and then select Rate and Revenue
Click File, New, Schedulers and then select Rate and Revenue.
The Rate and Revenue Setup window will appear:
Establishing the Parameters of the Report
For detailed instructions on these options, refer to Chapter Four, Common Options. Click on any button to change a
default setting. You must select a station or combination of stations for the analysis. You may also set the range of
spots to use for the run.
Market Selection
If you are using multiple markets, you may click the Market button to change to a different market.
Book Selection
To switch to a different survey book, click the Book button and make the appropriate selection.
Selecting the Daypart Focus of the Report
To define the daypart upon which this report will be based, click on Daypart. This will bring you to the
Daypart Selection Menu.
Select Standard dayparts by clicking on the days, the start time and the end time and then click OK.
To select Non-Standard dayparts, select a start and end day, start and end time and then click OK.
Choose a favorite daypart by single-clicking on it and then OK or simply double-click on its label.
Station Selection Box
Click the Station bar and the station listing will be brought to screen. Find and click on the station that will
be the focus of this report.
146
TAPSCAN User Manual
Cost Information
Click on the Average Rate field and type in the appropriate figure. Click on the Units per Hour field
and Commission field and fill in this information as well.
The Rate and Revenue Display
Click OK when you are ready and the Rate and Revenue table will then be displayed on the screen:
Rate and Revenue Table Display
To change any of the preselected report parameters,
click on the corresponding
button located here in the
report’s header, or click the
Edit option on the Windows
task bar.
Use the up/down arrow keys to bring to view
the other soldout levels so the potential revenue
for each may be analyzed
The system computes the number of weekly hours available in the selected daypart, multiplies that by the units per
hour and then the average rate to determine projected gross sales at 100% sold. It then multiplies this sales figure by
each soldout percent to give you gross sales for each soldout level. The net sales are computed by subtracting the
commissions from the gross sales. The sales figures are then projected out for monthly and annual periods.
From the display screen you may change the Book, Station, Daypart, Units per Hour, and Commision as at
the setup window. However you may also enter an Average CPP or Average CPM to recalculate the revenues.
Just click in the field and type in the appropriate figure and hit Enter. You must hit Enter for the revenues to be recalculated. You must do the same to change Average Rate.
You may copy all or some of the information to the clipboard with Edit, Copy. To select partial information to be
copied, drag the cursor over the desired rows and columns to highlight. To select an entire column, click on the
header of that column. To select multiple columns, drag the cursor over the desired column headers. If you want to
copy all the information, you need not highlight anything.
Click on View, then click Full Screen to remove the header and see more of the data table.
If you have multiple reports open simultaneously, you can switch to another display by clicking Window, then
select another display. You also may view them on the same screen at the same time by using the Tiling and
Cascading options, also located by clicking the Windows option.
To print this report, click the Print button on the TAPSCAN Tool Bar, or click File and select Print. The Print Job
window will appear indicating your report is being processed.
TAPSCAN and the TAPSCAN design are trademarks and registered marks of TAPSCAN, INC.
© 2001 Arbitron Inc. Used under license.
147
Chapter Seven:
Composition
TAPSCAN User Manual
Introduction
If you want to find the demographic characteristics of a radio station’s audience, this is where you need to be. The
Demographic Composition section of TAPSCAN gives you the ability to analyze not only a radio station’s audience,
but also the total population of the market being analyzed. Simply put, this is where you can find out “who listens to
what station.”
Click on Composition button, and the Composition Selections menu will be brought to screen:
The following is a walk-through of each of these different reports.
TAPSCAN and the TAPSCAN design are trademarks and registered marks of TAPSCAN, INC.
© 2001 Arbitron Inc. Used under license.
151
COMPOSITION
Composition Commander
Composition Commander, the most versatile of all the demographic analysis reports, offers you the capability to
analyze a station’s audience composition in a broad range of age cells (user defined) to find what percentage of the
audience falls into the different age cell ranges. This report is in a ranker format, and you will have up to eight
different columns for many different age cell/gender combinations.
Another valuable option within Composition Commander is the ability to choose what you wish the printed report to
show. You may only want to show what percentage of your audience falls into the different age/gender columns.
This lets you take the focus off “who’s got the most listeners,” and place it on “who’s got the highest concentration
of a specific age group.” Both percentages and persons can be displayed.
Access Composition Commander in one of the following ways:
Click File, New, Demographic Composition and select Composition Commander;
Click the Composition button on the toolbar and select Composition Commander;
From the Master Menu, click Composition then select Composition Commander.
The Composition Setup menu will now be displayed.
The Composition Setup
is where you will set
the specifications of
your report. Do this by
utilizing the various
buttons on this screen.
The following is a
review of each button’s
function.
Save & Load Options
Report configurations may be
saved and retrieved by
accessing the Save and
Load buttons.
After the
desired
configuration
is
obtained, click Save, give the
setup a unique name, then
click OK. Next time you are
in this report and wish to
retrieve this configuration,
once at the Setup menu, click
Load
and
select
that
configuration.
To save the current settings as
what the system defaults to
upon entering Composition
Commander, click Default
once the desired configuration
is obtained.
Establishing the Parameters of the Report
For detailed instructions on some of these options, refer to Chapter Four, Common Options.
Market Selection
If you are using multiple markets, you may click the Market button to change to a different market.
Survey Selection
To switch to a different survey book, click the Book button and make the appropriate selection.
152
TAPSCAN User Manual
Selecting the Daypart Focus of the Report
To define the daypart upon which this report will be based, click on Daypart. This will bring you to the
Daypart Selection Menu.
Select Standard dayparts by clicking on the days, the start time and the end time and then click OK.
To select Non-Standard dayparts, select a start and end day, start and end time and then click OK.
Choose a favorite daypart by either single-clicking on it and then clicking OK or you may simply
double-click on its label.
Stations Selection
This is where you will select which stations will be included on the report. The system defaults to all
stations being included. If you want to select specific stations to be included, click on the Stations button
and the Station Selection window will appear. You may either highlight stations in the Selected box you do
not want included and click Delete, or you may click Clear to remove all selected stations and start from
scratch. To select, highlight stations in the Available box and click Add. Once your selections are
complete, click the OK button and you will be taken back to the Setup screen.
Configuring the Station Roster
This is where you will select how the station list on this report is displayed. Click on Rosters and the
Roster Selection setup will appear. Make your choice by clicking on the appropriate selection, then confirm
your selection by clicking OK.
Combos
You will activate combos by clicking the Combos button. It is also in this area that you may perform any
needed combo maintenance. Click on Combos and the Combo setup will be displayed. Choose either to
“Use Combos for this run” or “Don’t Use Combos for this run” by clicking on the appropriate
button. Select which set of combos to use by clicking on the Combo Page Name.
You may perform combo maintenance with the Add, Delete, Name and Clear buttons as well.
After your selection is complete, select OK to be taken back to the Setup screen.
Geography
Click Geography to change to a different survey area---Metro, TSA, DMA or a User Defined area with
Maximi$er/MediaPro data.
Maximi$er/MediaPro
Select the Maximi$er (for stations) or MediaPro (for agencies) button to select qualitative criteria
available with the Maximi$er/MediaPro data.
For a walk-through of selecting Maximi$er/MediaPro data, please refer to Chapter Three, Qualitative
Adjustments.
Selecting the Base Demo
The Base Demo will determine the age cell range upon which the Composition Commander report will
focus. This is where you will set the “universe” to be analyzed. To change the current base demo setting,
click on Demo. This takes you to the Demo Selection Menu. Here you will select the gender, and the
beginning and ending age cells by clicking on each. Click OK when the selection is complete.
TAPSCAN and the TAPSCAN design are trademarks and registered marks of TAPSCAN, INC.
© 2001 Arbitron Inc. Used under license.
153
COMPOSITION
Selecting the Rank Demo
Click on this button to select the demographic on which the rank table will be sorted. This is not same as
the Base Demo. This simply allows you to have more control over the placement of the stations on the
report.
Defining the Age Cell Breakout per Column
The bottom area of the setup window is where you will define the age cell breakout for each column of the
report:
Add
Lets you to select demos for your columns.
Load List
Where you may load a previously saved demo list.
Save List
Allows you to save multiple demo lists for later use.
Default
Allows you to save the current age cell settings as your
default for future Composition Commander runs.
Load
Where you will go to load a previously saved setting.
Save
Allows you to save multiple setups for later use.
The Composition Commander Display
Once all of the Composition criteria have been appropriately set, select OK, and the Composition Commander report
will be displayed:
Composition Commander Table Display
You can make changes to this
display such as the Book, Survey
Area, Daypart, etc., by clicking on
that setting’s button, or clicking the
Edit button on the Windows’ Tool
Bar, then making the needed change.
154
TAPSCAN User Manual
Table Data Format---Persons vs. Percentages & Average vs. Cume
The Composition Commander table defaults to data displayed in a percentage; however, you have the
option of changing this display to persons if you desire. Additionally, you may elect to show both
percentages and persons. Keep in mind that the printed report will reflect the same configuration as the
displayed table.
To change the display, click the View option on the Windows’ task bar. This will bring the following
choices to screen:
Now you may toggle to a different display by clicking on the choice you desire. A check to the left of the
option notes the selection is active.
The Composition Commander table defaults to Average Persons being the benchmark estimate. You may
change to Cume Persons is so desired by clicking on the Edit option, then clicking on Cume Persons.
To switch back to Average simply go back into the Edit menu and click on Average Persons.
Printing a Composition Commander Report
To print this report, click the Print button on the TAPSCAN Tool Bar, or click File and select Print. This will bring
the Station Print Selection window to screen:
Here you will identify those stations to be included on the printed report. The system will default to all stations
being selected. To change this click Clear, then select the stations to be included. Notice also that you have the
option to identify a specified ranking number of stations to be printed by clicking Print Top. When you are ready
to print, click OK, and the Print Job window will appear indicating your report is being processed.
TAPSCAN and the TAPSCAN design are trademarks and registered marks of TAPSCAN, INC.
© 2001 Arbitron Inc. Used under license.
155
COMPOSITION
Demographic Profiles
Demographic Profiles allows you to focus on one station’s audience, and measure its composition in virtually any
estimate desired.
To access Demographic Profiles, you will do one of the following:
Click File, New, Demographic Composition and select Demographic Profiles
Click the Composition button on the toolbar and select Demographic Profiles
From the Master Menu, click Composition then select Demographic Profiles
The Demographic Profile Setup menu will appear. Click on any button to change a default setting.
Establishing the Parameters of the Report
For detailed instructions on some of these options, refer to Chapter Four, Common Options.
Market Selection
If you are using multiple markets, you may click the Market button to change to a different market.
Survey Selection
To switch to a different survey book, click the Book button and make the appropriate selection.
Selecting the Daypart Focus of the Report
To define the daypart upon which this report will be based, click on Daypart. This will bring you to the
Daypart Selection Menu.
Select Standard dayparts by clicking on the days, the start time and the end time and then click OK.
To select Non-Standard dayparts, select a start and end day, start and end time and then click OK.
Choose a favorite daypart by single-clicking on it and then OK or simply double-click on its label.
Geography
Click Geography to change to a different survey area---Metro, TSA, DMA or a User Defined area with
Maximi$er/MediaPro data.
156
TAPSCAN User Manual
Maximi$er/MediaPro
Select the Maximi$er (for stations) or MediaPro (for agencies) button to select qualitative criteria
available with the Maximi$er/MediaPro data.
For a walk-through of selecting Maximi$er/MediaPro data, please refer to Chapter Three, Qualitative
Adjustments.
Selecting the Estimate-base of the Profile
Select which estimate this report will be based upon by clicking this button.
Combos
You will activate combos by clicking the Combos On button. Conversely, you may disable combos by
clicking on the Combos Off button.
You may select which combo page to use or perform any needed combo maintenance with the Edit
Combos button. This will bring up the Combo setup. After your selection is complete, select OK to be
taken back to the Setup screen.
Selecting the Station to Profile
Click the Station bar and the station listing will be brought to screen. Find the station you wish to profile,
then click on that line. Once back at the Profile Setup screen, that station will now be reflected in the
Station field noting it will be the focus of this report.
The Demographic Profile Display
Once all specifications are properly set, select OK and the Demographic Profile report will be displayed:
Demographic Profile Table Display
You can make changes to this
display such as the Book, Survey
Area, Daypart, etc., by clicking on
that setting’s button, or clicking
the Edit button on the Windows’
Tool Bar, then making the needed
change.
To change the graphical display,
access the Chart button, and click
on the desired graph type.
To print the Composition Profile report click the Print button on the TAPSCAN Tool bar, or click on File and select
Print.
Demographic Profiles may also be accessed within the TAPSCAN Ranker. Double click on any estimate for
a station and the Demographic Profile for the station will appear.
TAPSCAN and the TAPSCAN design are trademarks and registered marks of TAPSCAN, INC.
© 2001 Arbitron Inc. Used under license.
157
COMPOSITION
Population Profiles
Population Profiles is a valuable tool in any radio listening analysis since it allows you to obtain a benchmark by
which you can measure a station’s true performance. Population Profiles measures radio listening for the total.
Access Population Profiles in one of the following ways:
Click File, New, Demographic Composition and select Population Profiles
Click the Composition button on the toolbar and select Population Profiles
From the Master Menu, click Composition then select Population Profiles
The Population Profile Setup menu will then be displayed:
Establishing the Parameters of the Report
For detailed instructions on some of these options, refer to Chapter Four, Common Options.
Market Selection
If you are using multiple markets, you may click the Market button to change to a different market.
Survey Selection
To switch to a different survey book, click the Book button and make the appropriate selection.
Geography
Click Geography to change to a different survey area---Metro, TSA, DMA or a User Defined area with
Maximi$er/MediaPro data..
Maximi$er/MediaPro
Select the Maximi$er (for stations) or MediaPro (for agencies) button to select qualitative criteria
available with the Maximi$er/MediaPro data.
For a walk-through of selecting Maximi$er/MediaPro data, please refer to Chapter Three, Qualitative
Adjustments.
158
TAPSCAN User Manual
Selecting the Daypart Focus of the Report
To define the daypart upon which this report will be based, click on Daypart. This will bring you to the
Daypart Selection Menu.
Select Standard dayparts by clicking on the days, the start time and the end time and then click OK.
To select a Non-Standard daypart, you need to select a start day, end day, start time and end time and
then click OK.
Choose a favorite daypart by either single-clicking on it and then clicking OK or you may simply
double-click on its label.
The Population Profile Display
Once all specifications are properly set, select OK and the Population Profile report will be displayed:
Population Profile Table Display
You can make changes to this
display such as the Book, Survey
Area, Daypart, etc., by clicking on
that setting’s button, or clicking
the Edit button on the Windows’
Tool Bar, then making the needed
change.
To change the graphical
display, access the Chart
button, and click on the
desired graph type.
Click these arrows to display percent of reach and market cume
estimates.
When you are ready to print, click OK, and the Print Job window will appear indicating your report is being
processed.
TAPSCAN and the TAPSCAN design are trademarks and registered marks of TAPSCAN, INC.
© 2001 Arbitron Inc. Used under license.
159
Chapter Eight:
Hour-by-Hour
Analysis
TAPSCAN User Manual
Introduction
The Hour-by-Hour portion of TAPSCAN lets you analyze a station’s average performance during all broadcast hours
individually. This will allow you to target specific hours for optimum listenership.
You can activate the Hour-by-Hour portion of TAPSCAN, do one of the following:
Click File, New, Hour-by-Hour
From the TAPSCAN Toolbar click Hour-by-Hour
From the Master Menu, click Hour-by-Hour
The Hour-by-Hour Setup screen will then appear.
Here you will set the parameters
of the analysis. Any of these
settings may be changed once at
the report’s display.
Establishing the Parameters of the Report
For detailed instructions on these options, refer to Chapter Four, Common Options.
Market Selection
If you are using multiple markets, you may click the Market button to change to a different market.
Survey Selection
To switch to a different survey book, click the Book button and make the appropriate selection.
Selecting the Demographic Focus
To select the current demo setting, click on Demo. This takes you to the Demo Selection Menu. Here you
will select the gender, and the beginning and ending age cells of the demographic target. Do this in one of
the following ways:
Click on the desired gender, start age, end age and then click OK.
Double-click on a demo in the list of demos in the Favorite Demos window.
Geography
Click Geography to change to a different survey area---Metro, TSA, DMA or a User Defined area with
Maximi$er/MediaPro data.
TAPSCAN and the TAPSCAN design are trademarks and registered marks of TAPSCAN, INC.
© 2001 Arbitron Inc. Used under license.
163
HOUR BY HOUR ANALYSIS
Combos
You will activate combos by clicking the Combos On button. Conversely, you may disable combos by
clicking on the Combos Off button.
You may select which combo page to use or perform any needed combo maintenance with the Edit
Combos button. This will bring up the Combo setup. After your selection is complete, select OK to be
taken back to the Setup screen.
Selecting the Station Focus
Click on the Station Bar displayed directly to the right of the “Combos off” button, and select the station
that will be the focus of this report.
Configuring the Day Display
The system will default to the Monday-Friday display. If you would like to change to Saturday or Sunday,
simply click on that box. (You can change the display from within the Hour-by-Hour display.)
Hour-by-Hour Display
Once all criteria for this report have been set, click on OK, and you will be taken to the Hour-by-Hour breakout for
the specified station.
Click on Edit to change any
criteria, such as the days (MondayFriday, Saturday, or Sunday),
demo, book, etc. In addition,
utilize the Chart option to change
the Chart type.
To see additional estimates, click the arrows on the scroll bar or you
can resize the columns.
To print this report, Click File, then Print and the Print Job window will appear indicating your report is being
processed.
164
Chapter Nine:
Trenders
TAPSCAN User Manual
Introduction
The Trender portion of TAPSCAN for Windows offers two distinct views analytic analysis. Within this portion of the
system you have the capability of analyzing one specific station’s listenership activity in several different dayparts
(both standard and non-standard), or analyze several different stations rating activity for up to five different books
for maximum comparative results.
You will access Trenders in one of the following ways:
Click on File, New and select Trenders
Click on Trenders on the toolbar
Click on Trenders on the Master Menu
The Trenders Selection menu will be displayed, and you will be given the following options:
Multiple
dayparts/single station
trender.
Multiple stations/single
daypart trender.
Multiple Mutli-trend
trenders—batched
processed and stored.
The following is a walk through of each different Trender.
Please keep in mind…Average Books CANNOT be trended.
TAPSCAN and the TAPSCAN design are trademarks and registered marks of TAPSCAN, INC.
© 2001 Arbitron Inc. Used under license.
167
TRENDERS
TAPTrend
TAPTrend allows you to analyze one station's performance in multiple dayparts using multiple estimates. You may
trend a maximum of 5 books and show index to a base book or percent change from book to book. There is also an
hourly trend option.
TAPTrend may be accessed the following three ways:
Click on File, New ,Trenders, then select TAPTrend
Click on Trenders on the toolbar, then select TAPTrend
Click on Trenders on the Master Menu, then click TAPTrend
The TAPTrend Setup Window will appear:
After you have obtained the
desired configuration, you may
take a snapshot of that setup and
save it as the system’s default by
clicking this button.
Base Book vs. Books
The base book will be the benchmark
for the report upon which all other
books will be compared. The Books
field displays all those books that will
be compared to the Base book.
This is the area of the setup window where you will designate which daypart the report
will analyzed, and where you will configure the format in which the data will be
displayed.
Establishing the Parameters of the Report
For detailed instructions on these options, refer to Chapter Four, Common Options.
Market Selection
If you are using multiple markets, you may click the Market button to change to a different market.
Selecting the Demographic Focus
To select the current demo setting, click on Demo. This takes you to the Demo Selection Menu. Here you
will select the gender, and the beginning and ending age cells of the demographic target. Do this in one of
the following ways:
Click on the desired gender, start age, end age and then click OK.
Double-click on a demo in the list of demos in the Favorite Demos window.
Geography
Click Geography to change to a different survey area---Metro, TSA, DMA or a User Defined area with
Maximi$er/MediaPro data.
168
TAPSCAN User Manual
Combos
You will activate combos by clicking the Combos On button. Conversely, you may disable combos by
clicking on the Combos Off button.
You may select which combo page to use or perform any needed combo maintenance with the Edit
Combos button. This will bring up the Combo setup. After your selection is complete, select OK to be
taken back to the Setup screen.
Selecting the Station Focus
Click on the Station Bar displayed directly to the right of the “Combos off” button, and select the station that
will be the focus of this report.
Selecting the Daypart Focus of the Report
Dayparts may be added various ways: Using the Add option, the Load List option or the Hourly option.
Add—Click on this button and you will be taken to the Daypart Selection Menu.
Select Standard dayparts by clicking on the days, the start time and the end time and then click OK.
To select Non-Standard dayparts, select a start and end day, start and end time and then click OK.
Choose a favorite daypart by single-clicking on it and then OK or simply double-click on its label.
After each dayparts has been defined, click on OK, and you will be taken back to the TAPTrend Setup
screen. You will continue to follow these steps until all dayparts to be used have been defined.
Load List—If you have previously defined and saved a daypart list, you can retrieve that list here. (This
prompt will not be available for use if you have not previously saved a daypart list. See the following
paragraph on instructions on how to save a daypart list.) After clicking on this button, the Daypart List
menu will appear. Identify the daypart list to be used by either clicking on that list and pressing OK, or
simply double clicking on that list. You will then be returned to the Setup menu.
Save List—To activate the Load List option, you must first save a daypart list. To do this, create the
dayparts to be saved with the Add option. Once back at the TAPTrend Setup menu, you can save those
dayparts by clicking on Save List. This will bring to screen the Save Daypart List screen, and you will
type in a description of these dayparts (i.e.: Drive Times). Once that label is entered, click on OK, and you
will be brought back to the Setup screen. You will now notice the Load List option is now available.
Hourly—You may, optionally, trend hourly information. To do this, click the Hourly button. You will
then be asked to identify which hourly format you wish to use – Mon-Fri, Saturday or Sunday. Click on the
display you wish to use then click OK. You will be brought back to the TAPTrend Setup window where
you will see that hourly configuration displayed.
Estimate Selection
You can select which estimates will be displayed on this report with this option. After selecting Estimates,
the TAPSCAN Estimate Selection menu will be displayed. To accept the default estimate selection, simply
press OK. To re-select the estimate selection, click on Clear. You may now select the estimates by
highlighting them in the Available box and clicking on Add or Insert. Remove individual estimates from
the Selected list with the Delete button.
When your selection is complete, select OK, and you will be taken back to the Setup screen.
TAPSCAN and the TAPSCAN design are trademarks and registered marks of TAPSCAN, INC.
© 2001 Arbitron Inc. Used under license.
169
TRENDERS
Base Book Selection
The Base Book is the benchmark of the report since it is to this survey other books will be compared. The
current book selected will be the default for the Base Book selection. If you want to change this, click on
this button, and make the appropriate change.
Book Selection
Here you will select the different books to trend against the Base Book. After you click Books, the system
will display the different books available for trending. Click on each book to use, pressing Add after each
selection. (You may also double-click on each selection.) After your selection is complete, click OK.
The TAPTrend Display
Click OK when your setup is complete and the TAPTrend analysis screen will appear:
TAPTrend Table Display
If you would like to show the
percent change from book to book,
or each books index compared to
the base book, click the arrow key
in the Display field and click on
the desired estimate.
To change any of the parameters of the report, such as the demo, dayparts, geography, etc., click Edit and make the
appropriate change. You may also copy data to the clipboard by highlighting the data to be copied and clicking
Edit, then Copy. If you would like to switch to a single estimate display, select Options, and click on Show
Single Estimate. To toggle back to the multiple estimate report, simple click on that same setting.
Printing a TAPTrend Report
There are multiple graphing (charting) configurations available. For a detailed walk-through of these
options, please refer to Chapter Eleven.
To print this report, click the Print button on the TAPSCAN Tool Bar, or click File and select Print. The data will
then be sent to the printer and your report generated. (The Print Job window will appear indicating your report is
being processed.)
170
TAPSCAN User Manual
Multi-Trend
Multi-Trend allows you to analyze multiple stations' performances in a single daypart using a single estimate. You
have the capability to trend up to five different books, as well as show the index to the base book or the percent of
change from book to book. You may trend up to a total of five books.
Multi-Trend may be accessed in multiple ways:
Click on File, New ,Trenders, then select Multi-Trend
Click on Trenders on the toolbar, then select Multi-Trend
Click on Trenders on the Master Menu, then click Multi-Trend
Upon entrance to this portion of the system, the Multi-Trend Setup menu will appear:
Base Book vs. Books
The base book will be the benchmark
for the report upon which all other
books will be compared. The Books
field displays all those books that will
be compared to the Base book.
Establishing the Parameters of the Report
For detailed instructions on these options, refer to Chapter Four, Common Options.
Market Selection
If you are using multiple markets, you may click the Market button to change to a different market.
Selecting the Daypart Focus of the Report
To define the daypart upon which this report will be based, click on Daypart. This will bring you to the
Daypart Selection Menu.
Select Standard dayparts by clicking on the days, the start time and the end time and then click OK.
To select Non-Standard dayparts, select a start and end day, start and end time and then click OK.
Choose a favorite daypart by single-clicking on it and then OK or simply double-click on its label.
Selecting the Demographic Focus
To select the current demo, click on Demo which takes you to the Demo Selection Menu. Select the
gender, and the beginning and ending age cells of the demographic target in one of the following ways:
Click on the desired gender, start age, end age and then click OK.
Double-click on a demo in the list of demos in the Favorite Demos window.
TAPSCAN and the TAPSCAN design are trademarks and registered marks of TAPSCAN, INC.
© 2001 Arbitron Inc. Used under license.
171
TRENDERS
Geography
Click Geography to change to a different survey area---Metro, TSA, DMA or a User Defined area with
Maximi$er/MediaPro data.
Stations Selection
This is where you will select which stations will be included on the report. The system defaults to all
stations being included. If you want to select specific stations to be included, click on the Stations button
and the Station Selection window will appear. You may either highlight stations in the Selected box you do
not want included and click Delete, or you may click Clear to remove all selected stations and start from
scratch. To select, highlight stations in the Available box and click Add. Once your selections are
complete, click the OK button and you will be taken back to the Setup screen.
Configuring the Station Roster
This is where you will select how the station list on this report is displayed. Click on Rosters and the
Roster Selection setup will appear. Make your choice by clicking on the appropriate selection, then confirm
your selection by clicking OK.
Base Book Selection
The Base Book is the benchmark of the report since it is to this survey other books will be compared. The
current book selected will be the default for the Base Book selection. If you want to change this, click on
this button, and make the appropriate change.
Book Selection
Here you select the different books to trend against the Base Book. After you click Books, the system will
display the different books available for trending. Click on each book to use, pressing Add after each
selection. (You may also double-click on each selection.) After your selection is complete, click OK.
The Multi-Trend Display
Click on OK when your setup is complete and the Multi-Trend rank screen will appear.
Multi-Trend Table Display
Click on the arrow next to Display and
you will be able to choose which display
you would like to use. The three options
are:
No Change Displayed
Percent Change
Index to Base Book
Click on Edit for all the available change options or click on the name box for the criteria if there is anything you
wish to change. You may also change the displayed estimate by clicking on the arrow next to Estimate.
172
TAPSCAN User Manual
Printing a Multi-Trend Report
There are multiple graphing (charting) configurations available. For a detailed walk-through of these
options, please refer to Chapter Eleven.
To print this report, click the Print button on the TAPSCAN Tool Bar, or click File and select Print. The data will
then be sent to the printer and your report generated. (The Print Job window will appear indicating your report is
being processed.)
TAPSCAN and the TAPSCAN design are trademarks and registered marks of TAPSCAN, INC.
© 2001 Arbitron Inc. Used under license.
173
TRENDERS
Batch Trenders
Within this Trender program, you have the ability to batch print several different trenders at one time. You may also
save as many Batch Trender configurations as you wish for future retrieval…this means you input the parameters of
the Batch Trender run one time only, and may automatically access that setup at any time and as often as needed!
Batch Trenders main purpose is to allow you to store frequently-used multiple Trender formats so they may be
quickly retrieved and printed.
Access Batch Trenders in one of the following ways:
Click on File, New ,Trenders, then select Batch Trender
Click on Trenders on the toolbar, then select Batch Trender
Click on Trenders on the Master Menu, then click Batch Trender
This will bring the Batch Trender window to view:
Description Field
Where you will enter the name of the Batch Report.
This is the name in which the report will be saved.
Add Line Button
Click this button to add a
line to the batch report.
Edit Line Button
To change a previously entered line of a batch
report, highlight the line then click this button.
Remove Line /Clear Buttons
If you would like to delete a line from a batch report,
highlight that line and click this button. The line will then
be removed from the report. Clicking the Clear button this
button will immediately erase all lines contained within the
current batch report.
Load Batch Button
Click this button to retrieve a previously saved batch
report.
Save Batch Button
To save the current batch configuration, click this
button, then give the batch report a name.
This area of the Batch Trenders main
window will display all pertinent
information about each component
of the current batch Trender.
Delete Batch Button
To delete a previously saved batch report, click this
button. A listing of all stored batch reports will be
displayed. Click on the report you wish to delete and
click OK.
Creating a Batch Trender
You may have as many Trenders assigned to a Batch Trender run as you desire; however, you must enter the
parameters of each of those Trenders individually.
Next, click the Add Line button and you will be taken to the Multi-Trend Setup window:
174
TAPSCAN User Manual
This is where you will set all parameters of this specific Trender. For detailed instructions on some of these options,
refer to Chapter Four, Common Options.
Market Selection
If you are using multiple markets, you may click the Market button to change to a different market.
Selecting the Daypart Focus of the Report
To define the daypart upon which this report will be based, click on Daypart. This will bring you to the
Daypart Selection Menu.
Select Standard dayparts by clicking on the days, the start time and the end time and then click OK.
To select Non-Standard dayparts, select a start and end day, start and end time and then click OK.
Choose a favorite daypart by single-clicking on it and then OK or simply double-click on its label.
Selecting the Demographic Focus
To select the current demo setting, click on Demo. This takes you to the Demo Selection Menu. Here you
will select the gender, and the beginning and ending age cells of the demographic target. Do this in one of
the following ways:
Click on the desired gender, start age, end age and then click OK.
Double-click on a demo in the list of demos in the Favorite Demos window.
Geography
Click Geography to change to a different survey area---Metro, TSA, DMA or a User Defined area with
Maximi$er/MediaPro data.
Stations Selection
This is where you will select which stations will be included on the report. The system defaults to all
stations being included. If you want to select specific stations to be included, click on the Stations button
and the Station Selection window will appear. You may either highlight stations in the Selected box you do
not want included and click Delete, or you may click Clear to remove all selected stations and start from
scratch. To select, highlight stations in the Available box and click Add. Once your selections are
complete, click the OK button and you will be taken back to the Setup screen.
Configuring the Station Roster
This is where you will select how the station list on this report is displayed. Click on Rosters and the
Roster Selection setup will appear. Make your choice by clicking on the appropriate selection, then confirm
your selection by clicking OK.
Combos
You will activate combos by clicking the Combos button. It is also in this area that you may perform any
needed combo maintenance. Click on Combos and the Combo setup will be displayed. Choose either to
“Use Combos for this run” or “Don’t Use Combos for this run” by clicking on the appropriate
button. Select which set of combos to use by clicking on the Combo Page Name.
You may perform combo maintenance with the Add, Delete, Name and Clear buttons as well.
After your selection is complete, select OK to be taken back to the Setup screen.
TAPSCAN and the TAPSCAN design are trademarks and registered marks of TAPSCAN, INC.
© 2001 Arbitron Inc. Used under license.
175
TRENDERS
Base Book Selection
The Base Book is the benchmark of the report since it is to this survey other books will be compared. The
current book selected will be the default for the Base Book selection. If you want to change this, click on
this button, and make the appropriate change.
Print Top
This option is where you may specific a specific number of stations to print upon running the batch Trender.
The system will default to “All Stations.” To keep this setting, you need not click this button. To specify a
top number, click this button, then enter in the number of stations to print.
Book Selection
Here you will select the different books to trend against the Base Book. After you click Books, the system
will display the different books available for trending. Click on each book to use from the Available Books
list, pressing Add after each selection (you may also double-click on each selection). After your selection
is complete, click OK.
After all settings have been established, click OK and you will be taken back to the Batch Trenders setup window:
The title box will keep count of how many Trender reports are contained within the current batch
Trender
You must enter a
description to
save the batch.
Use the scroll bar
at the bottom to
view
the
set
parameters of the
batch runs.
You will see that Trender run is now
listed in the mid-portion of this window:
The Market, Survey, Daypart and Demo
fields will be displayed on the window;
however, by using the scroll bar located
at the bottom of the window, you can
review the other settings of the Trender.
Continue to add individual Trenders to this batch Trender configuration in this same manner. If you need to edit a
previously entered Trender, highlight that line and click the Edit button; alternatively, you may simply double-click
on that line.
Delete a Trender entry out of the batch Trender configuration by highlighting the line you wish to remove then
clicking the Remove Line button. Clicking Clear All will erase all displayed Trender entries.
Printing (Running) a Batch Trender
Once the Batch Trender is appropriately configured, you may print the series of reports by clicking the Run button.
The system will then process the data for all recorded Trenders and promptly send the information to the printer.
176
TAPSCAN User Manual
Saving a Batch Trender Configuration
You may save a Batch Trender configuration so that it may be retrieved at a later date and processed by clicking the
Save Batch button. This will bring the following window to view:
Click OK to return to the Batch Trender window.
Retrieving a Batch Trender Configuration
Once a Batch Trender configuration has been saved, it may be retrieved at any time. To retrieve a saved setup, at the
Batch Trenders window click Load Batch. This will bring a listing of all saved Batch Trenders. Highlight the
desired setup and click OK. You will return to the Batch Trender window with all previously saved Trender setups
displayed. From this point you may print the batch Trender by selecting Print, or make any modifications to the
Trender configurations then re-save.
TAPSCAN and the TAPSCAN design are trademarks and registered marks of TAPSCAN, INC.
© 2001 Arbitron Inc. Used under license.
177
Chapter Ten:
Retail Spending
Power
TAPSCAN User Manual
Introduction
In this chapter of the manual, one of the most innovative selling and buying tools available within the Broadcast
Industry will be outlined. With Retail Spending Power, you will be able to analyze a radio station’s audience, and
uncover their spending potential in dozens of different retail and service oriented categories. NOTE: RSP is a
supplemental system to the TAPSCAN program.
Retail Spending Power is a market-specific database of annual sales totals for over eighty retail and service groups,
including most major radio advertising categories. This information is from Market Statistics, producers of the
Survey of Buying Power, one of the most respected and heavily utilized reference publications in the marketing
industry.
TAPSCAN makes this data work for you by applying stations' cume ratings to the market sales totals of your selected
retail or service category. Each demographic cell is applied individually and weighted using income-based factors
from the U.S. Census Bureau.
Retail Spending Power is an excellent response to CPP because it gives you the opportunity to contrast the Spending
Power of a point with the cost of that point, as just one example. In effect, it qualifies stations' impacts upon the
marketplace. Cost Per Point is based on average rating. Retail Spending Power focuses attention on cume
ratings...very stable, core measurements that better represent stations' true impact in your market.
Effectively, it translates stations' large cumulative audiences into sales potential, calculated using blue-ribbon data
that enjoys almost universal acceptance. Annual, average monthly, weekly, and daily estimates are available for your
market's Metro survey area.
TAPSCAN and the TAPSCAN design are trademarks and registered marks of TAPSCAN, INC.
© 2001 Arbitron Inc. Used under license.
181
RETAIL SPENDING POWER
RSP’s Setup Menu
You will enter the Retail Spending Power portion of TAPSCAN for Windows in one of the following ways:
Click File, New then Retail Spending Power
Click the RSP button on the toolbar.
From the Master Menu, click Retail Spending Power
The Retail Spending Power Setup menu will appear. As with all other setup menus, click on any button to
change a default setting.
Establishing the Parameters of the Report
For detailed instructions on these options, refer to Chapter Four, Common Options.
Market Selection
If you are using multiple markets, you may click the Market button to change to a different market.
Book Selection
To switch to a different survey book, click the Book button and make the appropriate selection.
Selecting the Daypart Focus of the Report
NOTE: Some reports will default to Monday-Sunday 6A-12M daypart.
To define the daypart upon which this report will be based, click on Daypart. This will bring you to the
Daypart Selection Menu.
Select Standard dayparts by clicking on the days, the start time and the end time and then click OK.
To select Non-Standard dayparts, select a start and end day, start and end time and then click OK.
Choose a favorite daypart by single-clicking on it and then OK or simply double-click on its label.
Selecting the Demographic Focus
NOTE: Some reports are available only for the Persons 12+ demo.
To select the current demo setting, click on Demo. This takes you to the Demo Selection Menu. Here you
will select the gender, and the beginning and ending age cells of the demographic target. Do this in one of
the following ways:
182
TAPSCAN User Manual
Click on the desired gender, start age, end age and then click OK.
Double-click on a demo in the list of demos in the Favorite Demos window.
Stations Selection
This is where you will select which stations will be included on the report. The system defaults to all
stations being included. If you want to select specific stations to be included, click on the Stations button
and the Station Selection window will appear. You may either highlight stations in the Selected box you do
not want included and click Delete, or you may click Clear to remove all selected stations and start from
scratch. To select, highlight stations in the Available box and click Add. Once your selections are
complete, click the OK button and you will be taken back to the Setup screen.
Configuring the Station Roster
This is where you will select how the station list on this report is displayed. Click on Rosters and the
Roster Selection setup will appear. Make your choice by clicking on the appropriate selection, then confirm
your selection by clicking OK.
Combos
You will activate combos by clicking the Combos button. It is also in this area that you may perform any
needed combo maintenance. Click on Combos and the Combo setup will be displayed. Choose either to
“Use Combos for this run” or “Don’t Use Combos for this run” by clicking on the appropriate
button. Select which set of combos to use by clicking on the Combo Page Name.
You may perform combo maintenance with the Add, Delete, Name and Clear buttons as well.
After your selection is complete, select OK to be taken back to the Setup screen.
Selecting the RSP Category
This is where you will designate which retail/service-oriented category you wish to analyze. Click on this
button and the Retail Spending Power Category Selection menu will then displayed:
Primary Categories
The corresponding
Sub-Categories
Click on a Primary category and the corresponding sub-categories will appear. To select an item from the SubCategory menu, double-click on that category. Click Total Retail Sales if you wish to analyze all dollars
spent in all retail/service-oriented categories within the market. Click OK when the appropriate category has
been identified, and you will be brought back to the Setup menu.
TAPSCAN and the TAPSCAN design are trademarks and registered marks of TAPSCAN, INC.
© 2001 Arbitron Inc. Used under license.
183
RETAIL SPENDING POWER
RSP Display
Click OK when all settings are properly set and the Retail Spending Power rank screen will then be displayed.
You may change the RSP
category by clicking the
Category button, then
making a selection as was
done
when
first
establishing the report
configuration.
You can switch between the market level report for the selected category and a station
level report (for the highlighted station) profiling all categories by clicking on these
tabs
If you would like to change any of the criteria, click Edit, and all available change options will be displayed; or
simply click on the name box for the criteria you wish to change.
184
TAPSCAN User Manual
RSP Reports
Click Print on the TAPSCAN Tool Bar, or click File then Print and the Retail Spending Power Reports menu will
appear.
Notice that the station that was
highlighted upon entering the Print menu
will be noted at the top of this menu.
This indicates that, for all single-station
focused reports, this station will be the
focus. To change the station focus, click
the arrow button and click on the desired
station from the list.
You can select which category will be
profiled in the Category Profile Report by
clicking on the Category Selection
button. This will bring up the Category
Selection menu.
You may enter a client name if desired to
cutomize your reports. Simply click on
this field and type in the name.
You will select the period (for RSP calculations) you wish to use for your reports by clicking on one of the settings
in the Time Period box.
To select a report to print, simply click the box next to the report. You may batch print reports by selecting more
than one report. Click on Print when you are ready to print your reports.
The following is an overview of each report:
Station Level Reports
RSP Category Profile Report for the Selected Station
This report allows you to select several Target categories and print a specific station’s spending power
within three different time spans. The report will be focused upon the selected daypart and demographic
target. You may choose from the following categories:
Building Materials/Hardware Stores
Food Stores
Automotive Dealers/Gasoline Service
Apparel & Accessory Stores
Eating/Drinking Places
Drug Stores
Furniture & Home Furnishings
Consumer Electronics/Music Instruments
Sporting Goods Stores/Bicycle Shops
Jewelry Stores
Department Stores
To select the categories to be profiled, click on the Category Selection button and the Category Print
Selection menu will be displayed. You may choose one or several Target categories by:
To select one category, either single-click on its label and click OK, or just double-click on the label.
To select several categories listed consecutively, drag the cursor over the labels and then click OK.
To select several categories not listed consecutively, hold down the Ctrl key and single-click on each
category and then click OK.
TAPSCAN and the TAPSCAN design are trademarks and registered marks of TAPSCAN, INC.
© 2001 Arbitron Inc. Used under license.
185
RETAIL SPENDING POWER
RSP Target Demographic Profile Report for Selected Station
This report will allow you to analyze the selected station’s spending power for several key target
demographics. Click on this report, then click Print. The system will then prompt you to type the client’s
name. Input that name, click OK and the system will automatically generate your report.
RSP Bonus Spending Power Report (Pie) for the Selected Station
This report is the only report that you must have a demographic target other than Persons 12+ selected.
This very powerful report allows you to demonstrate how much money people outside of a targeted
demographic will spend in a selected retail/service category.
RSP Rank Report
This is the only Retail Spending Power report that will allow you to compare different station’s spending
power for a specific targeted category. In addition, each station’s cume persons and rating will print for the
selected daypart and demographic target.
RSP Age Profile Report for the Selected Station
This report will allow you to analyze the selected station’s spending power for each individual demographic
cell, broken out by gender.
RSP Category Report for the Selected Station
This report will show the selected station’s total spending power in each of the Sub-Categories in all four
time spans. This report is only available for the Monday-Sunday 6AM-12M daypart and Persons 12+.
Market Level Reports
RSP Category Level Summary Report
This report will show the market’s total spending power in each Main category’s target components in all
four time spans. This report is only available for the Monday-Sunday 6AM-12M daypart and Persons 12+.
RSP Market Level Target Demographic Profile Report
This report will allow you to analyze the market’s spending power for several key target demographics.
RSP Age Profile Report
This report will allow you to analyze the market’s spending power for each individual demographic cell,
broken out by gender.
Other Reports
Factor Report showing Monthly Spending/Factors
This report will show spending amounts for the selected target demographic for all 12 months.
186
TAPSCAN User Manual
Notes on RSP Methodology
Retail Spending Power's calculations for most retail and service categories are distributed across the 12+ population
using age-cell specific income indexing, so as to discriminate by Spending Power levels among segments of the
population using the most accurate available information. These indexes were provided by the Census Bureau, as
were (ultimately) the retail and service sales totals and population data that serve as the basis for Retail Spending
Power.
Several of the retail categories supplied are gender-specific, and it would be inaccurate to calculate Spending Power
for these categories without taking this specificity into account. In order to determine the proper allocation of
spending between male and female consumers for these categories, TAPSCAN consulted the latest Consumer
Expenditure Survey, another Census-gathered database, and extracted the proper percentages.
The affected categories and their gender-based allocations are listed in the following table:
MEN
Men's and Boy's Clothing Stores
Women's Clothing/Accessories
Children's and Infants' Clothing
WOMEN
85.6%
14.4%
5.7
94.3
30.2
69.8
The same holds true for some of the service categories. We consulted a recent Radio Advertising Bureau publication
about Hair Stylists and extracted the following percentages for Barber Shops and Beauty Shops:
Barber Shops
Beauty Shops
MEN
86%
20
WOMEN
14%
80
Certain service categories’ sales totals do not apply to specific age groups. These are listed below:
Automotive Rental and Leasing
Truck Rental and Leasing
Disinfecting and Pest Control
P12-24
P12-24
P12-17
We have redistributed the sales totals for these age groups among the remaining population in these categories.
Conventional wisdom may hold that there is some gender specificity in other retail and service categories as well.
For example, some studies may show that women may visit grocery stores more frequently than men, and that men
may comprise the majority of hardware store customers. We have made no gender-specific adjustments to these
types of categories, however, for the following reasons:
1. The categories are not inherently gender-specific, as is a woman's clothing store, for example.
2. Individual retailers within a category can alter the "natural" gender composition of their customer bases through
the advertising process. Thus, a grocery chain could decide to target men for a certain product or promotion, and a
hardware store could target women specifically for a certain type of household product.
3. Gender differentiated expenditure information for non gender-specific categories is either unavailable,
inconclusive, not trendable, or conflicts with data from other sources of equal credibility.
TAPSCAN and the TAPSCAN design are trademarks and registered marks of TAPSCAN, INC.
© 2001 Arbitron Inc. Used under license.
187
RETAIL SPENDING POWER
List of Categories
Automotive Dealers/Gasoline Service
New Car Dealers (New and Used)
Used Car Dealers
Tires, Batteries & Accessories
Furniture/Home Furnishing/Electronics/Appliance Stores
Furniture Stores
Floor Covering Stores
Other Home Furnishings Stores
Household Appliance Stores
Radio, Television and other Electronics Stores
Computer and Software Stores
Camera and Photographic Supplies Stores
Building Material and Garden Equipment and Supplies Dealers
Hardware Stores
Lawn and Garden Equipment and Supplies Stores
Outdoor Power Equipment Stores
Lumber/other Building Material Dealers
Paint and Wallpaper Stores
Food and Beverage Stores
Grocery Stores
Specialty Food Stores
Beer, Wine and Liquor Stores
Supermarkets and other Grocery
Health and Personal Care Stores
Pharmacies and Drug Stores
Cosmetics, Beauty Supplies and Perfume Stores
Optical Goods Stores
Gasoline Stations
Clothing and Clothing Accessories Stores
Men's Clothing Stores
Women's Clothing Stores
Children's and Infants' Clothing Stores
Family Clothing Stores
Clothing Accessories Stores
Other Clothing Stores
Shoe Stores
Jewelry Stores
Luggage and Leather Good Stores
Sporting Goods Stores
Hobby, Toy and Game Stores
Sewing, Needlework and Piece Goods Stores
Musical Instrument and Supplies Stores
Book Stores
News Dealers and Newsstands
Prerecorded Tape, Compact Disc and Record Stores
General Merchandise Stores
Department Stores
Variety Stores
Miscellaneous General Merchandise Stores
188
TAPSCAN User Manual
Specialty Store Retailers
Florists
Office Supplies and Stationary Stores
Gift, Novelty and Souvenir Stores
Used Merchandise Stores
Electronic Shopping and Mail-Order Houses
Vending Machine Operators
Direct Selling Establishments
Food Services and Drinking Places
Eating Establishments
Refreshments (fast food)
Drinking Establishment
Services
Laundry, Cleaning and Garment Services
Coin-Operated Laundries and Cleaners
Dry Cleaning Plants
Carpet and Upholstery Cleaning
Photographic Studios, Portrait
Beauty Shops
Barber Shops
Mailing, Reproductions, Etc.
Disinfecting and Pest Control Services
Employment Agencies
Help Supply Services
Computer Rental and Leasing
Computer Related Services
Photo-finishing Laboratories
Automotive Rental and Leasing
Truck Rental and Leasing
Passenger Car Rental
Automotive Repair Shops
Radio and Television Repair Shops
Motion Picture Theaters
Video Tape Rental
Bowling Centers, Billiard and Pool
Commercial Sports
Physical Fitness Facilities
Public Golf Courses
Amusement Parks
Membership Sports and Recreation Clubs
Offices/Clinics of Doctors of Medicine
Offices/Clinics of Dentists
Offices/Clinics of Chiropractors
Offices/Clinics of Optometrists
Hospitals
NOTE: Indented categories are for display and identification purposes only. When one of these
categories is selected, the system automatically assigns it to the proper category for which
Spending Power information is available.
TAPSCAN and the TAPSCAN design are trademarks and registered marks of TAPSCAN, INC.
© 2001 Arbitron Inc. Used under license.
189
Chapter Eleven:
Charting
Reports &
Customizing
Presentations
TAPSCAN User Manual
Introduction
TAPSCAN is equipped to offer users the most precise ratings analysis possible. However, TAPSCAN also has “bells
and whistles” that will liven-up sales and media presentations. These options include:
Present It!--TAPSCAN’s premier presentation builder
Multiple charting (graphing) formats
Customizing printed reports with your company’s logo
Cover Sheets
This section will review where and how to access those features for the most professional sales/research
presentations possible.
TAPSCAN and the TAPSCAN design are trademarks and registered marks of TAPSCAN, INC.
© 2001 Arbitron Inc. Used under license.
193
CHARTING REPORTS AND CUSTOMIZING PRESENTATIONS
Present IT Presentation
Builder
Using this portion of the TAPSCAN System you can prepare creative, desktop-quality presentations with just a few
keystrokes. Present IT’s presentations may be as detailed or brief as you wish since you customize each page to
meet each situations unique specifications.
To access Present IT, click the File option on the Windows menu bar, then select Present IT. The Present IT
setup screen will appear.
Getting Started—The Start Tab
Begin by selecting either Create a new presentation (to create a new report), or Load an existing
presentation. If you are loading a saved presentation, a listing of all presentations on file will be displayed.
Highlight the presentation to retrieve and you will be brought back to the Start tab where you will see the client
name (for whom the proposal was originally prepared) displayed in the Name field. If this is a new presentation,
input the name of the client for whom this presentation is being prepared in the Name field.
Click the Next button and you will be brought to the Cover Sheet display. (Alternatively, you may click the tab
header of a different tab if you wish to skip the Cover Sheet area.)
Note the Present IT Presentation Builder
is comprised of several different tabs.
Each tab represents one page of the
presentation (when printed). The name of
each tab (except Start and Cover Sheet)
will print out on the header of the page.
You may change the name of the tab by
clicking on the Setup button. The Start
tab will be the tab displayed upon
entering Present IT.
Create a new presentation—Click this button if you
wish to create a new presentation, then enter the name of
this presentation in the “Name” field.
Each tab houses information that is
unique to that portion of the presentation;
however, you do not have to use all pages
of the presentation. To switch to another
tab, click on the name of the tab you
wish to be displayed or click the Next
button.
Load an exiting presentation—Click this button if
you wish to load a previously created button.
Setup Button
Clicking the Setup button will open the Present IT Setup
window where you may change any of the aesthetic values
of the presentation.
Next and Back Buttons
These buttons will take to the next or previous tab windows.
The Setup Button
Click this button and the Present IT Setup window will appear:
194
TAPSCAN User Manual
This screen displays a field for each tab (page) of the
presentation. To change any tab name, highlight the field to edit,
then type in the name change; there is a maximum of 20
characters.
Default Font for Present IT Text
You may also change the font and character size in which the tab
name will be displayed. Do this by clicking on the ARROW keys
in the Font and Font Size fields. You also may display the tab
title in bold and/or italics by my marking the box to the left of
each of these notations.
Presentation Configuration
Make sure the correct configuration setting is marked. This will
control how some of the text is displayed.
Cover Sheet Tab
The information inserted on this area of Present IT will comprise the first page of the Presentation. Once printed,
the Cover Sheet will look similar to this:
Client name and Campaign
Comments
This is the “Banner”
display.
The Cover Sheet tab will be unique in design than the other tabs in this area of the system:
If you wish to save the cover sheet configuration, click
the Save button. You will be prompted to enter a
name for the cover sheet. Type in that text and then
click OK. The cover sheet may then be retrieved when
in Present IT by clicking the Load button at the
Cover Sheet tab.
Click the first field (Client) and input the name of the
client for which the presentation is being prepared. To
move to the next field, you may press the Tab key or
click on the field. Continue to input the appropriate
information in each field. The Banner field will be
graphically displayed down the left side of the page.
In the previous Cover Sheet example, “Wisebuy!”
represents the Banner text.
Once all needed data has been entered, click the Next button.
TAPSCAN and the TAPSCAN design are trademarks and registered marks of TAPSCAN, INC.
© 2001 Arbitron Inc. Used under license.
195
CHARTING REPORTS AND CUSTOMIZING PRESENTATIONS
The Remaining Tabs
The other tabs of the Present IT Presentation Builder all contain identical fields.
Input information you find relevant to each tab topic as you see fit:
Once you have completed filling-out the information for the specific tab, you may save it for
Page Name
future retrieval. This field is where you will input the name under which the page will be
saved. This field will not be printed on the report. To retrieve a saved page, get to the tab
display (of the tab configuration that was saved), then click the Load button.
Header Text
This field is similar to a page title---it is printed at the top of the page (under the name of the
tab) and is centered above the bullet points.
Font Style
You may change the style of the Header Text data by using these settings. Font determines
which font is used. Font Size will be the size in which the Header Text is printed. Check the
Bold and Italics box if you would like to apply either or both styles to the Header Text.
Bullet Points
This information will comprise the body of the page and will be displayed in bullet point style.
To add a bullet point, click the Add button. This will bring the Present It Text Editor to
screen. Begin typing the bullet point text. To change the font display, use the font style
buttons listed at the bottom of the Text Editor just as you did when defining the font for the
Header Text. Once you have input the information for this bullet, click OK. Once back at the
Present Its main display, you will see that bullet point listed in the Bullet Points box.
Continue to add bullet points in the same manner.
Once the presentation is complete, click on the Finish tab. If you wish to save this presentation for future retrieval
click the Save this Presentation button. If you have not given the presentation a name, you will be notified of
that at this time. Click OK and you will be returned to the Start tab display where you may enter a name in which to
save the presentation.
Once ready to print, click the Print button. You will be given the option of selecting which pages of the
presentation will be printed. Mark your selection by clicking on that pages corresponding box, then click Print.
196
TAPSCAN User Manual
Report Header Selection
This option allows you to customize your printed reports with a graphical “TAPSCAN” logo that will print at the
bottom of the report.
To activate, click the Setup button and then select the Report Setup tab. This will bring the system Report Setup
menu to screen.
Fine-tune the report configuration by
turning-on all desired options. Do this by
placing an “X” in each option you wish to
turn on.
You have the choice between using the
default (standard) header which will result
in “TAPSCAN” being printed in the top-left
corner of all reports, or using a customized
bitmap of your company’s logo.
If you choose to use your own logo, you
must set the path to the directory that
contains your bitmap file by clicking on the
Bitmap Directory button. Click on the
arrow key to show all bitmap files that
reside in the directory. Click on the
appropriate file and the image will be
displayed on the screen for you. The
system will now establish this as the header
bitmap.
Click on the option you wish to use, then click OK.
TAPSCAN and the TAPSCAN design are trademarks and registered marks of TAPSCAN, INC.
© 2001 Arbitron Inc. Used under license.
197
CHARTING REPORTS AND CUSTOMIZING PRESENTATIONS
Cover Sheet
Customize all of your sales and media presentations with a TAPSCAN Cover Sheet! In addition, you have the
capability to view the Cover Sheet before it is printed to ensure the proper layout has been input.
To access the Cover Sheet, click File, then Cover Sheet. The Cover Sheet window will then be brought to screen:
Click the first field (Client) and input the name of
the client for which the presentation is being
prepared. To move to the next field, you may
press the Tab key or click on the field. Continue
to input the appropriate information in each field.
The Banner field will be graphically displayed
down the left side of the page. In the example
below Cover Sheet example, “Wisebuy!”
represents the Banner text.
If you wish to save the cover sheet configuration,
click the Save button. You will be prompted to
enter a name for the cover sheet. Type in that text
then click OK. The cover sheet may then be
retrieved when in Present It by clicking the Load
button at the Cover Sheet tab.
Once your text and Banner have been entered, click on Preview and the Cover Sheet (as it will be printed) will
appear on the screen.
Client name and campaign
Comments
The Banner display
Click Print when you are ready to print your Cover Sheet.
198
TAPSCAN User Manual
Accessing RAB’s Instant
Background Data
If you have purchased Instant Background data from the RAB (Radio Advertising Bureau), you have the capability
of accessing this information via TAPSCAN.
From within TAPSCAN, click File, then select Instant Backgrounds. The RAB Instant Background Selection
screen will appear:
Here, you will select the category you wish to uncover information by double-clicking on that category. Now the
RAB Instant Background data display will be brought to screen.
Here, you will utilize the window’s up/down arrow keys to view the different pages of information. In addition, you
will see the different options listed at the top of the screen. Use these in the following manner:
Print
This option allows you to print the information for the displayed category. Simply click on this button, and the
information will be printed.
Close
This is how you will exit out of this portion of TAPSCAN for Windows.
Copy
If you would like to copy any portion of the text to the Windows’ clip board, mark the text to be copied by dragging
the cursor over that text area, then clicking Copy.
Select
Click this button if you would like to change the category of data being viewed.
TAPSCAN and the TAPSCAN design are trademarks and registered marks of TAPSCAN, INC.
© 2001 Arbitron Inc. Used under license.
199
CHARTING REPORTS AND CUSTOMIZING PRESENTATIONS
Charting a TAPSCAN
Report
TAPSCAN is equipped with unique and attractive graphing formats that will allow several different perspectives and
angles to be made within your analysis.
NOTE: Charting is not available in some areas of TAPSCAN such as within Retail Spending
Power---additionally, some report displays automatically contain graphs as the default display.
To enter into the Chart mode, click the Chart option on the Windows’ menu bar. Depending upon the report you
are currently viewing (charting is not available in all reports), numerous charting (graphing) options will be
displayed in a drop-down menu.
You can choose to turn the chart
grid lines on or off by clicking on
this option.
This option only
appears when you access Chart
options once a graph has been
created.
Click on the chart type you wish to generate and you will be brought to the Graph Setup Form.
The Graph Setup Form will be slightly different depending on the report type.
Input the name of the graph in the
Custom Text box. Select the stations
and estimates (if applicable) to be
included on the graph by clicking the
Stations
Estimates
and
(or
dayparts, demos or books) buttons.
Click OK when you are ready for the
graph to be displayed.
The following are examples of various charting configurations available within TAPSCAN. Remember, these graphs
may appear differently depending upon the report, the number of stations, the number of estimates, etc. that are being
displayed on the graph.
200
TAPSCAN User Manual
Chart Examples
2D Bar Horizontal Chart
2D Bar Vertical
3D Bar Horizontal
3D Bar Vertical
TAPSCAN and the TAPSCAN design are trademarks and registered marks of TAPSCAN, INC.
© 2001 Arbitron Inc. Used under license.
201
CHARTING REPORTS AND CUSTOMIZING PRESENTATIONS
2D Stacked Bar Horizontal
2D Stacked Bar Vertical
3D Stacked Bar Horizontal
3D Stacked Bar Vertical
202
TAPSCAN User Manual
2D Pie Chart
3D Pie Chart
Line Chart
TAPSCAN and the TAPSCAN design are trademarks and registered marks of TAPSCAN, INC.
© 2001 Arbitron Inc. Used under license.
203
Chapter Twelve:
Media Terms
and
Calculations
TAPSCAN User Manual
Glossary
•
Ad Noting
Respondents are asked to leaf through a magazine or newspaper then are asked if they had
“noted” an ad or part of an ad.
•
Affiliate
A station associated contractually with a network for the purpose of broadcasting network programs.
•
Audience Composition
The demographic breakout of a specific station's audience.
•
Audience Duplication
The portion of a station's audience that is exposed to more than one media vehicle. In other words, a station's
“shared” audience.
•
Availability
A specific period of unsold air time that is available for sale to an advertiser.
•
Average Issue Readership
A newspaper's average amount of readers for one issue, both primary and pass-along.
•
Average Quarter Hour Persons
The average number of people who listen to a station for at least five minutes during a quarter hour.
•
Average Rating
The percentage of a particular demographic population that tune-in to a specific station during any quarter hour
of a defined daypart, for at least five minutes. (The Average Persons expressed as a percentage of the
demographic population.)
•
Average Share
The percentage of all people listening to radio during any given quarter hour of a specified daypart who are
listening to a particular station.
•
Barter
An agreement between a station and advertiser where goods and/or services are exchanged for airtime rather
than cash.
•
Billboarding
The capability to increase or decrease the Average Rating by giving credit for promotional and news
sponsorship spots.
•
Bonus Spot
An additional radio or television commercial given to an advertiser at no cost.
•
Cable TV Penetration
The percentage of a specific market that is connected to cable TV systems.
TAPSCAN and the TAPSCAN design are trademarks and registered marks of TAPSCAN, INC.
© 2001 Arbitron Inc. Used under license.
207
MEDIA TERMS AND CALCULATIONS
•
Column Inch
A newspaper term referring to the unit of space one column wide and one inch deep (14 agate lines).
•
Co-op Advertising
Retail Advertising run by a retailer and a manufacturer with shared costs for the mutual benefit of both.
•
Cost Per Point (CPP)
The cost of achieving one rating point, which represents one percent of the demographic population.
•
Cost Per Thousand (CPM)
The cost of achieving 1000 exposures within the target demographic one or more times.
•
Cost Per Thousand Effective Net Reach (CPM EFF NR)
The cost of reaching 1000 persons of a specified demographic target effectively (3 or more times.)
•
Cost Per Thousand Net Reach (CPM NR)
The cost of reaching 1000 (unduplicated) people within a specified demographic
•
Cume Composition (% 12+)
The percentage of a station's cume audience that meets the target demographic.
•
Cume Composition Index (% 12+)
The likelihood of a station's audience to be between the ages of the target demographic. 100 is the average or
benchmark. If a station has a Cume Composition Index of 124, that audience is 24 percent MORE likely to fit
the target demographic. A Cume Composition Index of 90 would indicate that specific audience is 10 percent
less likely to meet the target demographic.
•
Cume Persons
The total number of different (unduplicated) people within a specific demographic category that tune-in to a
station for at least five minutes in a quarter hour within a specified daypart.
•
Cume Rating
The cume persons expressed as a percentage of the demographic population.
•
Daily Time Spent Listening (TSL) in Hours:Minutes
The amount of time, expressed in hours and minutes, the average listener will listen to a station per day.
•
Daypart
The different specific time period breakouts of a broadcast day for which audience estimates are reported.
•
Designated Market Area (DMA)
Nielsen's geographic definition of exclusive TV Markets broken into counties in which home market stations
receive the predominant share of viewing.
•
Direct Mail Advertising
Letters, folders, brochures and other advertising materials sent through the mail directly to prospective
customers.
•
Direct Response Advertising
An advertising message that calls for a prompt purchase commitment by the reader or
listener/viewer directly to the manufacturer.
208
TAPSCAN User Manual
•
Drive Time
The weekday commuting hours of 6:00AM-10:00AM(Morning Drive) and 3:00PM-7:00PM(Afternoon Drive).
•
Effective Frequency
The minimum level of frequency, or number of exposures, determined to be affective in achieving the goals of
an advertising campaign. This level will vary with individual products or services and the marketing objectives
of the campaign but is usually a frequency of 3 or more exposures.
•
Effective Rating Points (ERP's)
Effective Reach expressed as a percentage of the target demographic population.
•
Effective Reach
The percentage of the targeted demographic population that is exposed to the message three or more times.
•
Estimate
Measurements such as Average Persons, Cume Persons, Time Spent Listening, etc... used to analyze the
potential effectiveness of specific stations.
•
Exclusivity
The right given to the advertiser to where no competitor would be permitted to advertise in a specific media
vehicle. This usually calls for a major commitment by an advertiser.
•
Exposure
An individual's contact with an advertising message or medium.
•
Flighting
To input a multiple week schedule in which all weeks' spot levels are not consistent throughout the campaign.
•
Frequency
The average number of times the target demographic population will be exposed to the message.
•
Frequency Distribution
A tabulation separating those reached by a schedule, according to their minimum levels of frequency, or
frequency: 2 or more times, 3 or more times, 4 or more times, etc.
•
Fringe
A television term referring to the period of time surrounding the prime time broadcast hours.
•
Gross
The cost of advertising before agency commission and any discounts are applied.
Gross Impressions
The total amount of exposures an advertising message will receive. This does NOT indicate the number of
different people the message will be exposed to.
•
•
Gross Rating Points (GRP's)
The total accumulation of average rating points a schedule will yield, each rating point representing one percent
of the population.
•
Hiatus
A scheduled period of time in which advertising activity ceases.
TAPSCAN and the TAPSCAN design are trademarks and registered marks of TAPSCAN, INC.
© 2001 Arbitron Inc. Used under license.
209
MEDIA TERMS AND CALCULATIONS
•
Households Using Television (HUT's)
The number of homes in a particular market that use at least one television set during a specific period of time.
•
Index
A ratio in percentage terms which indicates the likelihood of a particular media to meet a specified goal or
criteria. An index score is “graded” using 100 as the benchmark. An index of 123 indicates a 23 percent more
likelihood of meeting a specified criteria. An index score of 88 shows a 12 percent less likelihood of that
medium to meet the specified criteria.
•
Insert
A preprinted advertisement supplied by the advertiser. An insert is usually printed on different paper and/or
different color reproduction that is superior in quality to that of the rest of the publication. An insert is bound or
tucked into a publication.
•
Insertion Order
A written order from an advertising agency which authorizes a publication to print a specified advertisement.
•
In-Tab Sample
The actual number of usable diaries/interviews used by research organizations to produce audience estimates.
•
Make-Good
Comparable commercial time or space given to an advertiser at no additional cost when advertising is preempted, omitted or airs in an unfit condition .
•
Net Cost
The cost of advertising after the agency commission or any discounts have been deducted.
•
Net Effective Reach
The number of people who are exposed to a message three or more times. Net Effective
Reach is expressed in persons rather than as a percentage.
•
Net Reach
The number of people who are exposed to a message one or more times. Net Reach
is expressed in persons rather than as a percentage.
•
Orbit
Commercials that are rotated throughout the different programs and/or time periods.
O.T.O.
Stands for “one time only.” This is a spot that runs only once and is usually bought outright or is a makegood
for a discrepancy.
•
•
Overnights
A service provided by Nielsen that measures Prime Time viewing the day after broadcasting.
•
Pass-Along Audience
Those readers of a publication that did not purchase the publication, nor did other members of his/her
household.
210
TAPSCAN User Manual
•
Penetration
The degree to which a medium has obtained area coverage. Also referred to as the “effectiveness” of a
advertising schedule.
•
Percent of Cume
The percentage of a station's total unduplicated audience that is reached by a particular schedule.
•
Persons Using Radio (PUR)
The percentage of an area's population (Persons 12+) listening to radio during a specified time period.
•
Persons Using Television (PUT's)
The number of people viewing all television stations including network, independent, public broadcast and cable
channels during a given time period. This reflects the total amount of people turned to TV in general rather than
to a specific program.
•
Primary Circulation
The number of home subscriptions and newsstand sales of a particular publication. Primary Circulation does not
include pass-along readership.
•
Prime Access
The half-hour time period immediately preceding network prime time.
•
Promo
A brief announcement encouraging listeners or viewers to tune to a program on the station or network.
•
Rate
The cost of advertising on/in a media vehicle as defined by that media source. Usually a rate is given to one unit
such as one spot of air-time, one ad for a publication, or one outdoor billboard.
•
Rate Card
A listing distributed by a medium containing advertising cost, issue dates, closing dates, mechanical
requirements, cancellation dates and circulation data.
•
Rating
An estimate of the size of an audience expressed as a percentage of the total demographic or household
population within a market. One rating point represents one percent of the targeted population.
•
Reach
The percentage of the targeted demo population that is exposed to the message one or more times.
•
Readers Per Copy
The average number of readers of one copy of a newspaper or magazine.
•
Retail Trading Zone
The newspaper circulation area including the city line and beyond from which retailers draw sufficient
customers to justify including this area in the coverage area.
•
Rotation
Spots which rotate throughout the various days during the duration of the schedule.
TAPSCAN and the TAPSCAN design are trademarks and registered marks of TAPSCAN, INC.
© 2001 Arbitron Inc. Used under license.
211
MEDIA TERMS AND CALCULATIONS
•
Run of Paper/Press (R.O.P.)
A newspaper insertion for which a position is left to the discretion of the publisher and not specified.
•
Run of Schedule/Station (R.O.S.)
A broadcast commercial for which a specific time or day has not been requested but will be aired at the
discretion of the radio or television station.
•
Satellite
A station which is dependent upon another station for most of its programming.
•
Sets In Use
The number or percentage of radio/television sets which are tuned in to the same program at any given time
within a coverage area.
•
Share
The percentage of the total broadcast audience tuned to a specific station during a specific time period.
•
Simulcast
Broadcast of the same programming on two radio stations at the exact same time. This also refers to a radio
station broadcasting the audio portion of a TV program simultaneously.
•
Sponsorship
The purchase of all or part of the airtime during a radio or TV program.
•
Spots
A commercial; one unit of air-time.
•
Standard Newspaper
A large-sized newspaper that is usually eight (8) columns wide.
•
Sweeps
The different times Nielsen conducts the actual surveying of a market's TV viewing habits.
•
Syndicated Program
A program purchased by an advertiser or station from an independent organization that is not a network.
•
Tabloid
A paper usually about half the size of a standard newspaper and measures about 5 to 6 columns wide and 200
lines deep.
•
Tag
An identification of the dealer which is usually added to the end of a commercial to advise listeners/viewers
where the product that is advertised can be purchased.
•
Tear Sheets
Pages that are removed from a publication to provide proof that an advertisement was run.
•
Time Spent Listening
The number of quarter-hours spent listening to a particular station by the population group being analyzed.
212
TAPSCAN User Manual
•
Total Audience Plan (TAP)
A radio schedule consisting of announcements which air in all major dayparts.
•
Traffic
The department in radio/television stations, publications and advertising agencies that handles schedule
instructions and commercial materials.
•
Turnover
The ratio that indicates the frequency with which an audience of a media vehicle changes (turns over) over a
period of time.
•
Vehicle
Anything capable of exposing an advertising message to consumers.
•
Viewers Per Household (VPH)
The average number of persons viewing a broadcast per viewing household.
•
Viewers Per Viewing Household (VPVH)
The average number of persons viewing a broadcast or viewing during a specific period of time per viewing
household.
•
Weekly Time Spent Listening (TSL) in Hours:Minutes
The total amount of time expressed in hours and minutes spent listening to a particular station by the
population group being analyzed in a one week period of time.
•
Weekly Time Spent Listening (TSL) in Quarter Hours
The number of quarter-hours spent listening to a particular station by the population group being
analyzed in a one week period of time.
TAPSCAN and the TAPSCAN design are trademarks and registered marks of TAPSCAN, INC.
© 2001 Arbitron Inc. Used under license.
213
MEDIA TERMS AND CALCULATIONS
214
TAPSCAN User Manual
Media Calculations
•
Average Composition Formula
Demographic Audience divided by the Total Audience
•
Average Rating Formula
Average Quarter Hour Persons divided by Population
•
Average Share Formula
Average Persons divided by the Average Persons Using Radio
•
Cost Per Thousand Effective Net Reach Formula
Total Cost divided by Effective Net Reach expressed in thousands (000's)
•
Cost Per Thousand Net Reach (CPM NR) Formula
Total Cost divided by Net Reach expressed in thousands (000's)
•
Cost Per Point (CPP) Formula
Total cost divided by Gross Rating Points (GRP's)
•
Cost Per Thousand Formula
Total cost divided by Gross Impressions expressed in thousands (000's)
•
Cume Composition Formula
Demographic Audience divided by Total Persons 12 + Audience
•
Cume Composition Index Formula
Cume Rating divided by Total Demographic Population Percentage
•
Cume Rating Formula
Cume Persons divided by the Total Population of that same Demographic
•
Coverage (Newspaper/Magazine) Formula
Demographic Audience divided by the Demographic Universe
•
Daily Time Spent Listening (TSL) Hours:Min Formula
Total Time Spent Listening divided by the number of days within the daypart
•
Effective Rating Points (ERP's) Formula
Effective Reach divided by the Target Population
•
Frequency Formula
Gross Rating Points (GRP's) divided by Reach
Or Gross Impressions divided by Reach (in persons)
Gross Impressions Formula
Average Persons multiplied by the Number of Spots
•
TAPSCAN and the TAPSCAN design are trademarks and registered marks of TAPSCAN, INC.
© 2001 Arbitron Inc. Used under license.
215
MEDIA TERMS AND CALCULATIONS
•
Gross Rating Points (GRP's) Formula
Reach multiplied by Frequency
•
Household Rating (TV) Formula
Household Audience divided by the Household Universe
•
Households Using Television (HUT's) Formula
Households Rating divided by Share
•
Index Formula
Variable divided by the Base, such as a station’s Cume Composition divided by the Total Demographic
Population Composition
•
Percent of Cume Formula
Reach divided by Cume
•
Reach (Radio) Formula
Gross Rating Points (GRP's) divided by Frequency
•
Readers Per Copy Formula
Publication Readers Audience divided by Publication Circulation
•
Time Spent Listening (TSL) Formula
Average Quarter Hour Persons multiplied by the Quarter Hours of the specified daypart
divided by Cume Persons
•
Total Audience (Newspaper/Magazine) Formula
Readers Per Copy multiplied by the Circulation
•
Turnover (Radio) Formula
Cume Persons divided by Average Persons
•
Viewers Per Viewing Household (VPVH) Formula
(Demographic Universe divided by Household Universe) x Conversion Factor
or
Demographic Audience divided by Household Audience
216
Chapter Thirteen:
Trouble
Shooting
TAPSCAN User Manual
Solutions to Common
Problems
Upon completing the installation and setup of TAPSCAN, certain adjustments may be required (contingent upon your
hardware and Windows setup) to ensure the system’s optimum performance. The following is a list of different
situations that may be encountered when using TAPSCAN. All can be remedied by the simple modifications listed
directly below each.
Situation One:
“I printed the report, but instead of a header displayed, I am only getting ‘Black Bars’.”
Solution:
Go to Print Manager or Control Panel section of Windows. Click-on
Now select Options and then click-on Print True Type as Graphics.
Printers, and then Setup.
Situation Two:
“When I use a Hewlett Packard (HP) 4 Series Printer with TAPSCAN, I’m encountering miscellaneous
problems.”
Solution:
Change the printer settings to read the following:
* DPI = 300
* Graphics mode = RASTER
* Turn on the Print True Type as Graphics setting within Windows (refer to Solution One).
Situation Three:
“The Report Labels are not being displayed on the computer screen.”
Solution:
Change Colors within the Control Panel section of Windows to read “Windows Default Colors” or
simply modify the color scheme until the report labels are visible.
Situation Four:
The message ‘Subscript out of range’ is being displayed on screen when using the data conversion.
Solution:
This usually points to a RAM (computer’s memory) deficiency frequently caused by having too many files
within one subdirectory. Usually this problem can be remedied by deleting files. A quick way to delete
several files at one time from within the system is to delete data books. Check to see if there are any
unneeded books or Averages within the TAPSCAN data subdirectory.
TAPSCAN and the TAPSCAN design are trademarks and registered marks of TAPSCAN, INC.
© 2001 Arbitron Inc. Used under license.
219
MEDIA TERMS AND CALCULATIONS
Situation Five:
“I’m encountering the message ‘Invalid Property Value’ when attempting to print.”
Solution:
The “True Type” fonts are missing from Windows. Get the Windows System Disk containing the print
drivers and install the following fonts:
220
ARIAL
ARIAL BOLD
ARIAL BOLD ITALIC
ARIAL ITALIC
TIMES NEW ROMAN
TIMES NEW ROMAN BOLD
TIMES NEW ROMAN BOLD ITALIC
TIMES NEW ROMAN ITALIC


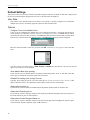
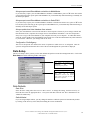


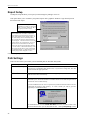
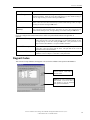
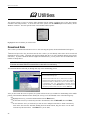
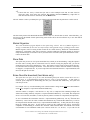

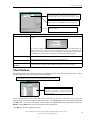


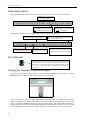
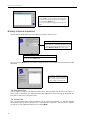
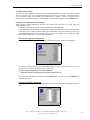

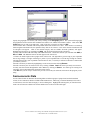


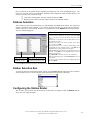
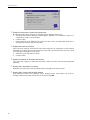
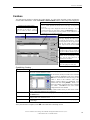
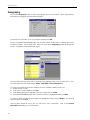
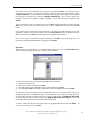
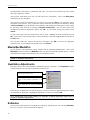


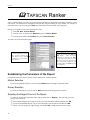
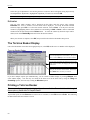
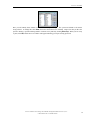
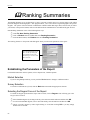
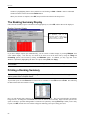


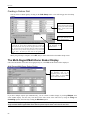
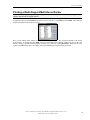
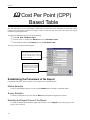
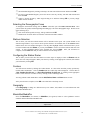

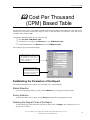

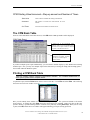
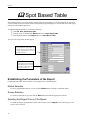
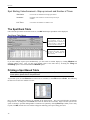
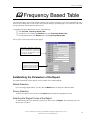
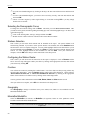


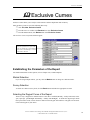


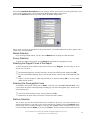

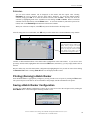


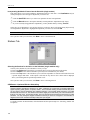


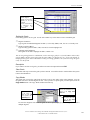
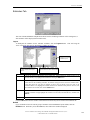
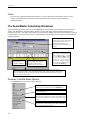


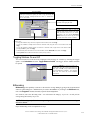


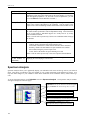


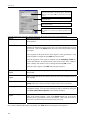
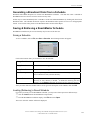

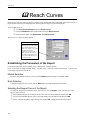

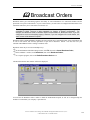


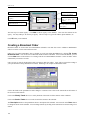
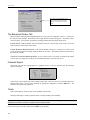


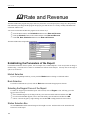
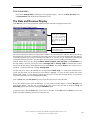


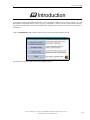
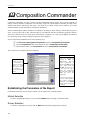


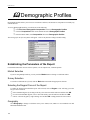
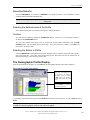


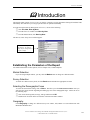
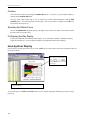


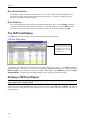

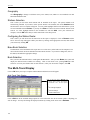

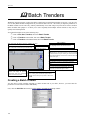


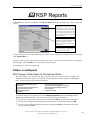

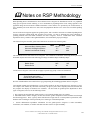


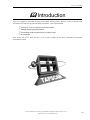
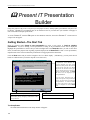

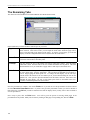


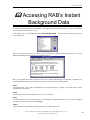


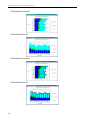
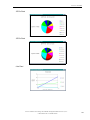


![[1]StorageTek T10000C](http://vs1.manualzilla.com/store/data/005701279_1-def8e2b4b691d6a17c8293fd164d2b7c-150x150.png)