1
REX manual (04/09)
those encountered when using plots within the SPM results window, including display contrast
estimates and 90% C.I., and fitted and adjusted responses for both first-level block designs or for
second-level analyses. For event-related responses you can also explore fitted responses and
PSTHs, 90% C.Is., adjusted data, parametric responses and Volterra kernels.
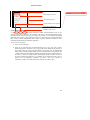
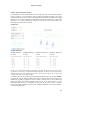
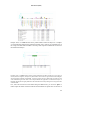
Example of the rex plots function used on first-level analysis dataset in which the source volumes are
individual scans comprising a time-series extraction. The data originate from an event-related study using
famous faces (REF?) The event-related PSTH plot results for one functionally-defined ROI shown at the
right.
Please report any bugs, comments and/or suggestions to: Susan Whitfield-Gabrieli,
[email protected]
8/9