1
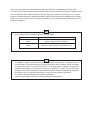
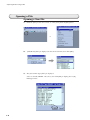
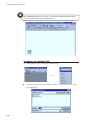
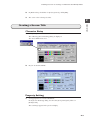
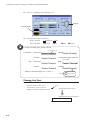
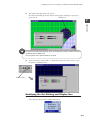
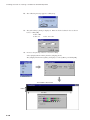
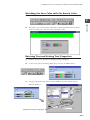
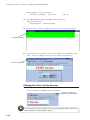
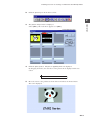
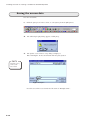
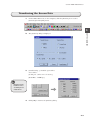
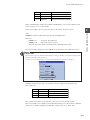
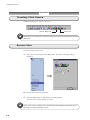
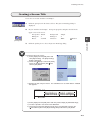
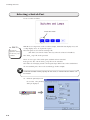
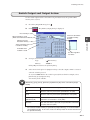
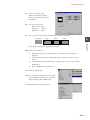
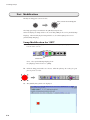
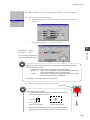
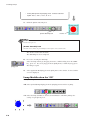
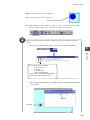
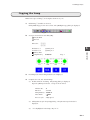
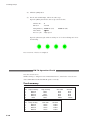
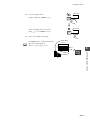
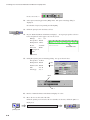
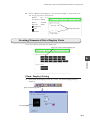
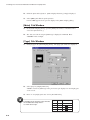
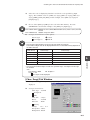
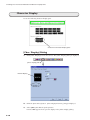
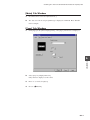
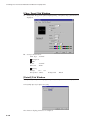
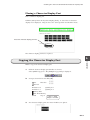
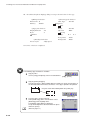
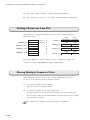
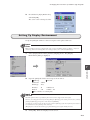
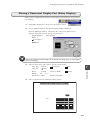
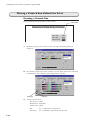
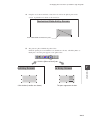
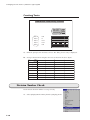
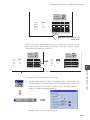
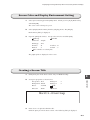
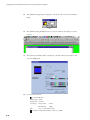
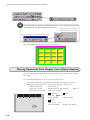
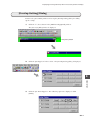
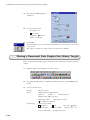
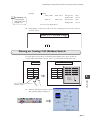
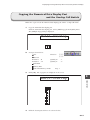
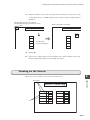
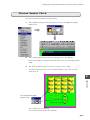
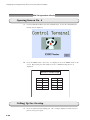
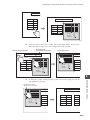
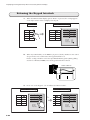
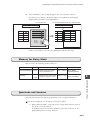
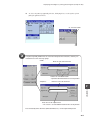
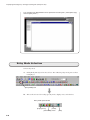
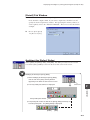
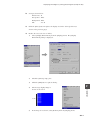
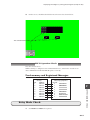
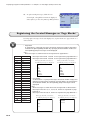
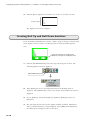
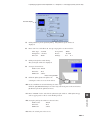
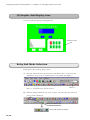
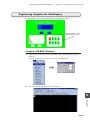
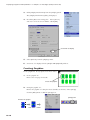
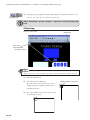
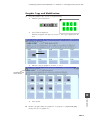
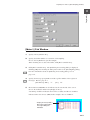
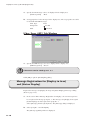
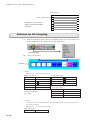
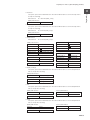
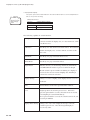
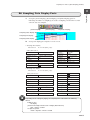
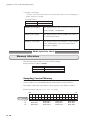
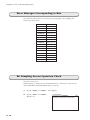
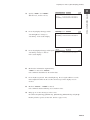
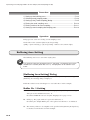
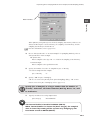
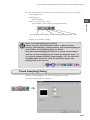
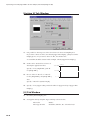
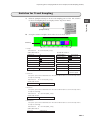
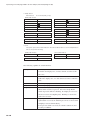
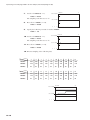
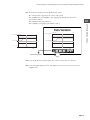
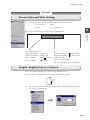
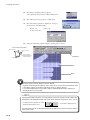
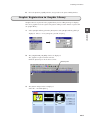
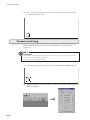
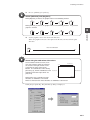
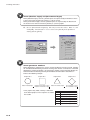
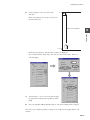
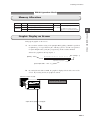
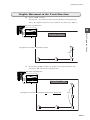
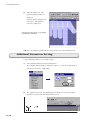
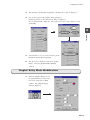
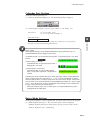
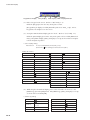
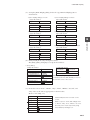
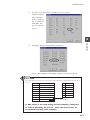
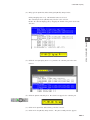
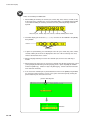
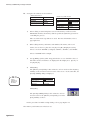
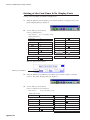
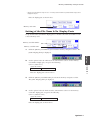
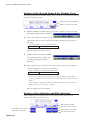
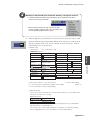
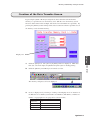
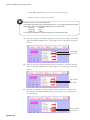
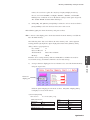
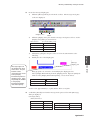
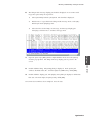
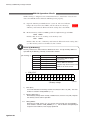
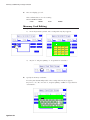
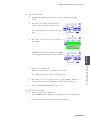
Expressing Time-Varying Data in a Line Graph (Trend Sampling Mode)
Trend Sampling Data Display Parts
1.
Set up the [Count Display] and [Time Display] parts for indicating the number of
12
samplings and the time recorded when the data was sampled.
[Time Display]
Sampling time display
2.
Sampling count display
12345678
100 300 1000
Operation
[Count Display]
123
Set up each display part and place it on the screen.
• Sampling time display
Part selection
No. 9 in file [Parts_e.z7p]
[Main] tab window
Division No.
Transparent
0
[Type] tab window
unchecked
Italic
unchecked
1-Byte
Display Function
Sample Time Display
Char. Size
Digits
8
Rotate
Normal
Decimal Point
0
Direction
RGT
Display Type
DEC (w/o sign)
Spacing
checked
Zero Suppress
unchecked
Enlarge
X: 1 Y: 1
Foreground
Blue
[Char. Prop.] tab window
Background
Silver-color
Char. Type
[Detail] tab window
Flush R
Normal
Process Cycle
High Speed
Depending on the setting for [Digits], the sampling time is indicated in the following
format:
8 digits or less
no display
greater than 8 digits and less than 14 digits (both inclusive)
hour: minute: second
15 or more greater
month - day hour : minute : second
• Sampling count display
Set up the options in the tab windows in the same manner as those for the sampling time
display, except the following:
[Type] tab window
Display Function
Sample Count Display
Digits
3
12-13