1
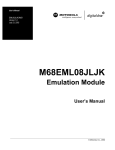
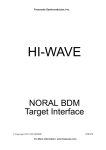
Debugger Components
General Debugger Components
Source Component
The Source window shown in Figure 3.64 on page 109 displays the source code of your
program, i.e. your application file.
Figure 3.64 Source Window
The Source window allows you to view, change, monitor and control the current execution
location in the program. The text displayed in the Source Component window is chromacoded, i.e. language keywords, comments and strings are emphasized with different colors
(respectively blue, green, red). A word can be selected by double-clicking it. A section of
code can be selected by holding down the left mouse button and dragging the mouse.
The object info bar displays the line number in the source file of the first visible line that is
at the top of the source.
Source code can be folded and unfolded. Marks (places where breakpoints may be set) can
be displayed.
When the source statement matching the current PC is selected in this window,
(e.g., in a C source:
), the matching assembler instruction in the
Assembler component window is also selected. This instruction is the next instruction to
be executed by the CPU.
HC(S)08/RS08 Debugger Manual
109