1
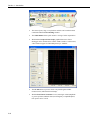
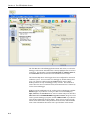
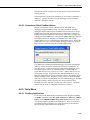
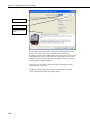
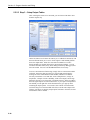
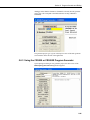
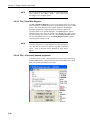
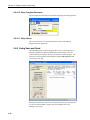
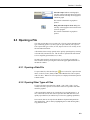
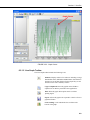
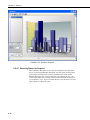
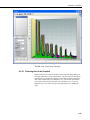
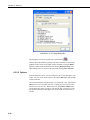
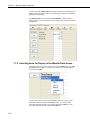
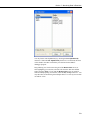
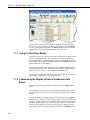
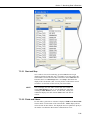
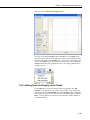
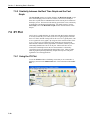
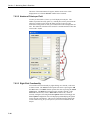
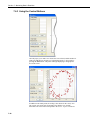
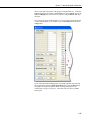
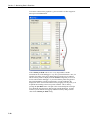
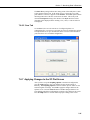
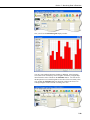
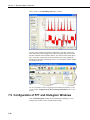
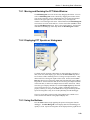
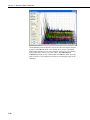
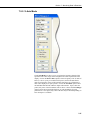
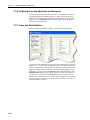
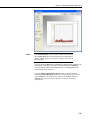
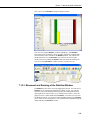
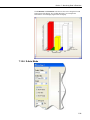
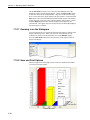
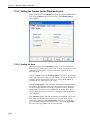
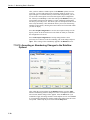
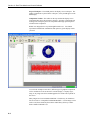
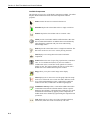
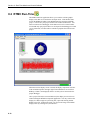
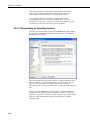
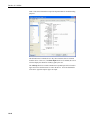
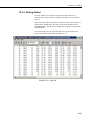
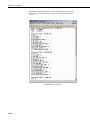
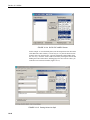
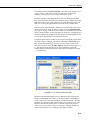
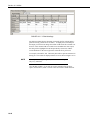
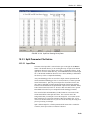
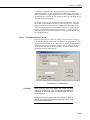
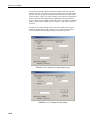
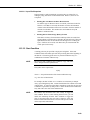
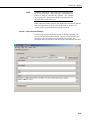
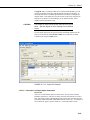
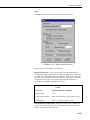
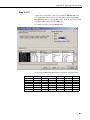
Section 7. Monitoring Data in Real-time
7.10 Rainflow Histogram Monitoring
RTDAQ can display rainflow histograms that have been created by the
datalogger. The display will be updated as quickly as data is received from the
datalogger. For this to function properly, there must be a Rainflow output
instruction defined in the CRBasic program that is running on the datalogger to
which RTDAQ is connected.
NOTE
RTDAQ does not create rainflow histograms from time series
measurements. It only displays rainflow histograms that have
been calculated and stored by the datalogger.
7.10.1 Rainflow Histogram Overview
A rainflow histogram is 3-D histogram representation based on the rainflow
counting algorithm of Endo and Matsuiski, which was first published in 1968.
These diagrams can be used to monitor fatigue levels of structures under stress,
such as components of a large-scale transportation bridge.
7.10.2 Opening Rainflow Histograms
To view real-time rainflow histograms from your datalogger in RTDAQ, first
ensure that a proper rainflow program is running in the datalogger you wish to
monitor, including the proper output instruction(s) in one of the tables of the
CRBasic program. For more information about using the Rainflow output
instruction, refer to its online help topic within the CRBasic Editor program.
Connect to the datalogger in RTDAQ by clicking on the datalogger’s icon and
pressing Connect. Now choose the Monitor Data tab to make the real-time
displays available, and choose the Rainflow button.
7-66