1
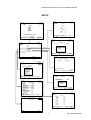
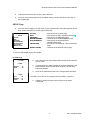
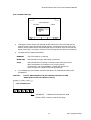
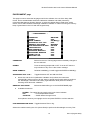
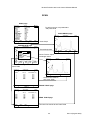
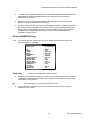
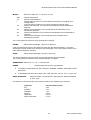
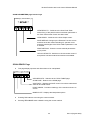
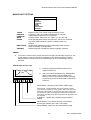
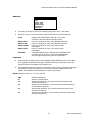
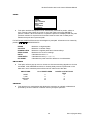
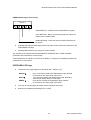
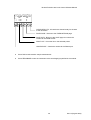
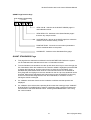
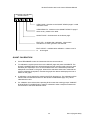
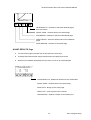
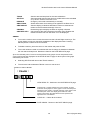
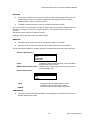
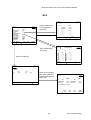
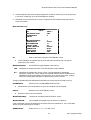
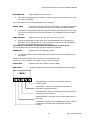
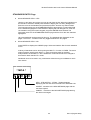
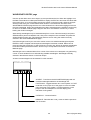
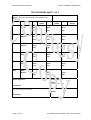
Nicolet Evolution 500 Local Control Software Manual
MANIPULATE OPTIONS
MANIPULATE
TRACK
RESCALE
COMPARE
MODE
PEAKS
SMOOTHING
ORIGINAL
TRACK
RESCALE
COMPARE
MODE
PEAKS
SMOOTHING
ORIGINAL
Reports x and y axis values using the tracking cursor.
Changes x and y axis scales automatically or manually.
Loads reference spectrum for comparison.
Changes mode. Select from %T / ABS / 1D / 2D / 3D / 4D.
Finds spectral peaks. Select from PEAKS / VALLEYS / PEAKS &
VALLEYS/ ZERO CROSS / RATIO / CORR. RATIO / PK
HEIGHT.
Applies LOW, MEDIUM or HIGH modified/improved SavitskyGolay smoothing to the spectrum.
Resets the graph to display the data as originally collected.
TRACK
To move the vertical cursor across the screen use the Left and Right Arrow keys. The
cursor always moves to a data point regardless of the displayed scales. Pressing
ENTER places a marker at the current wavelength. Up to 10 wavelengths can be
selected.
TRACK page function keys
Pressing CLEAR will delete markers in turn,
highest number first.
400.0
500.0
600.0
The x-axis values are listed on the TRACK table
page. Further markers can be added to the
spectrum at any time; however selecting TRACK
will cause any previous PEAK TABLE information
to be lost.
VIEW TABLE - Switches to the TRACK TABLE page.
FAST/SLOW - Toggles between two cursor speeds. In FAST
mode the cursor jumps 5% of the graph or to the next data point
whichever is the greater. In SLOW mode the cursor jumps to the
next data point or the next display pixel whichever is the greater.
The function key label shows the next speed ie the opposite to the
one selected.
CLEAR ALL - Clears all the markers and the TRACK
TABLE.
PRINT GRAPH - Provides a hardcopy of the results
showing the markers and x and y-axis values.
SCAN GRAPH - Returns to the SCAN GRAPH page.
26
Issue 1(August 2003)