1
B
Using the ProSightPC Interface
The ProSightPC Interface
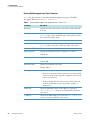
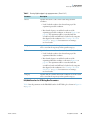
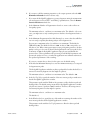
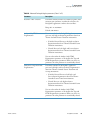
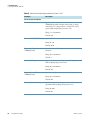
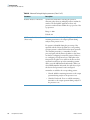
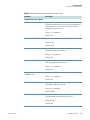
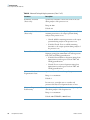
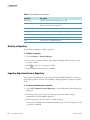
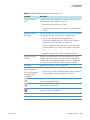
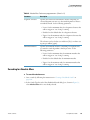
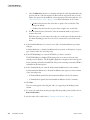
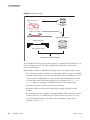
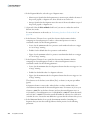
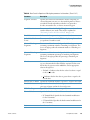
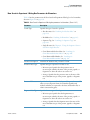
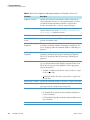
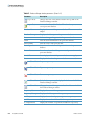
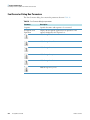
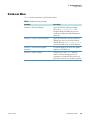
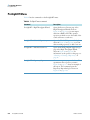
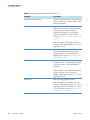
Table 73. Show Columns area parameters (Sheet 2 of 3)
270
ProSightPC User Guide
Parameter
Description
Largest mz Avg
Displays a column showing the largest average
mass-to-charge ratio (m/z) value of all precursor entries for
each experiment.
Pending Search
Displays a column indicating whether a search has been
performed.
Successful Search
Displays a column indicating whether a match in the
database was found.
Matching Forms
Displays a column showing the number of matching
forms.
Best Expectation
Displays a column with the best (lowest) expectation score
of any match in the search results.
Best P Score
Displays a column with the best (lowest) p score of any
match in the search results. For more information on the
calculation of this score, see “p Score” on page 193.
Best PDE
Displays a column showing the best (highest) PDE
(McLuckey) score of any match in the search results. For
more information on the calculation of this score, see
“PDE (McLuckey) Score” on page 196.
Highest Total Ions
Displays a column showing the highest total number of
ions that matched the ions in the database.
b/c Ions
Displays a column showing the number of b and c
fragment ions that matched in the database.
y/z. Ions
Displays a column showing the number of y and z.
fragment ions that matched in the database.
Fragments
Displays a column with the total number of theoretical
fragments present.
Precursors
Displays a column with the total number of theoretical
precursors present.
First Abundance
Displays a column with the abundance of the first
precursor.
Largest Abundance
Displays a column with the abundance of the precursor
with the largest abundance.
Best Seq Score
Displays a column with the best sequence tag score.
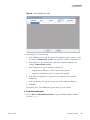
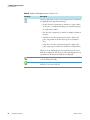
Refresh
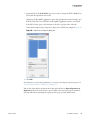
Displays the columns selected in the Show Columns area
in the data grid.
Thermo Scientific