1
Chapter 6 Statistics
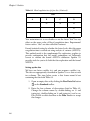
Example 2: Calculating rejection regions
Calculating a rejection region for a level α test is straightforward.
Suppose we are testing if the variance of one population is larger than
the variance of a second population. That is, the null and alternative
hypotheses are:
2
2
2
2
H0 : σ1 = σ2
HA : σ1 > σ2
Suppose we calculate an F statistic of f = 3.9 from the sample data,
and suppose that the two samples are of sizes m = 12 and n = 10 .
For a level 0.05 test, we reject the null hypothesis if
f ≥ F α, m – 1, n – 1 = F 0.05, 11, 9 . To find the rejection region, we must
calculate the quantile at 1 – 0.05 = 0.95 for the F distribution with
11 and 9 degrees of freedom.
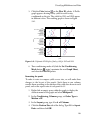
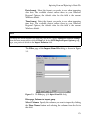
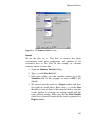
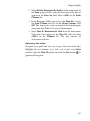
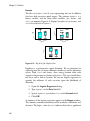
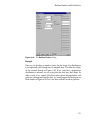
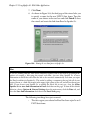
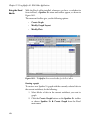
1. Open an empty data set by clicking the New Data Set button
on the Standard toolbar.
2. Enter the value 0.95 in the first row of the first column.
Change the name of the first column to x.
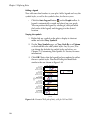
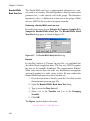
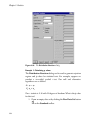
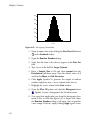
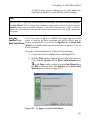
3. Open the Distribution Functions dialog.
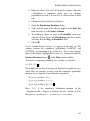
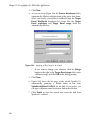
4. Verify that the name of the data set appears in the Data Set
field and select x as the Source Column.
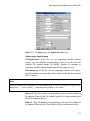
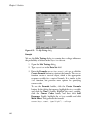
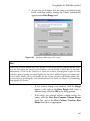
5. To calculate quantiles, check the Quantile result type.
6. Select f from the Distribution pull-down menu. Enter 11 and
9, respectively, in the Deg. of Freedom 1 and Deg. of
Freedom 2 fields.
7.
Click OK.
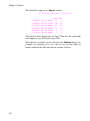
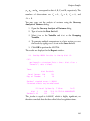
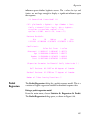
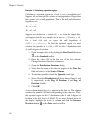
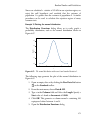
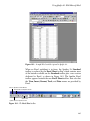
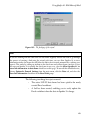
A new column named Quantile appears in the data set. The column
contains the quantile 3.102485 corresponding to the value in x. Thus,
the rejection region for the F distribution with 11 and 9 degrees of
freedom at the 0.05 level is 3.102485. To see more decimal places in
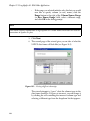
the display, highlight the Quantile column and click the Increase
Precision button
370
on the Data window toolbar.