1
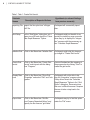
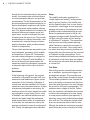
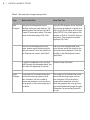
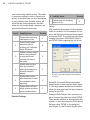
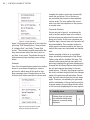
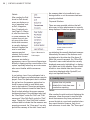
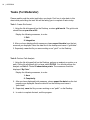
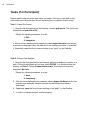
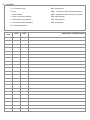
SI 622: Evaluation of Systems & Services Winter 2008 Usability Testing Project Client: Syntax2D Taubman College of Architecture & Urban Planning University of Michigan Tao Dong Maureen Hanratty Adam Torres Lingyun Xu | Table of contents Syntax 2.0: Usability Testing | Table of Contents Executive Summary . . . . . . . . . . . . . . . 1 Introduction . . . . . . . . . . . . . . . . . . 2 Overview of Syntax2D . . . . . . . . . . . . . . 2 Target Population. . . . . . . . . . . . . . . . 2 Usability Testing Goals. . . . . . . . . . . . . . 2 Methodology . . . . . . . . . . . . . . . . . . 3 Overview. . . . . . . . . . . . . . . . . . 3 Task Scenarios . . . . . . . . . . . . . . . . 3 Questionnaires. . . . . . . . . . . . . . . . 3 Recruitment . . . . . . . . . . . . . . . . . 6 Setup. . . . . . . . . . . . . . . . . . . . 6 Test Roles . . . . . . . . . . . . . . . . . . 6 Severity Ratings. . . . . . . . . . . . . . . . 8 Pilot Test . . . . . . . . . . . . . . . . . . 8 Findings & Recommendations. . . . . . . . . . . 8 Summary of Findings. . . . . . . . . . . . . . 8 Detailed Findings . . . . . . . . . . . . . . 10 Recommendations . . . . . . . . . . . . . . . 15 Limitations . . . . . . . . . . . . . . . . . . 17 Conclusion . . . . . . . . . . . . . . . . . . 17 References . . . . . . . . . . . . . . . . . . 17 Appendix Testing Materials Packet . . . . . . . . . . . 18 Questionnaire Results . . . . . . . . . . . . 31 I 1 | Usability Testing of Syntax2D Executive Summary Product and Goals This report documents the usability test findings of Syntax2D, an open source spatial analysis software program developed by the Taubman College of Architecture and Urban Planning at the University of Michigan. The primary goal of usability testing is to collect a set of both, quantitative and qualitative data from the users of space syntax software tools. The findings, along with the recommendations, will guide future changes in the software’s development. Methods The research team conducted four usability tests and one pilot test. Four space syntax researchers from the University of Michigan participated in the testing, representing a specialized community of current and potential Syntax 2D users. Researchers evaluated the usability and functionality of two core features in Syntax 2D: visual graph analysis and path analysis. Findings & Recommendations The majority of the users demonstrated similar issues in completing both tasks. Three of the four users could not perform a Path Analysis without direct assistance from the moderator in inputting the “PATHS” layer name. Users also had difficulty knowing which measure was currently being displayed and mentioned that a lack of feedback was the issue. Below is a prioritized list of 6 usability issues found during testing: 1. System does not recognize layers in a file. 2. Cannot show certain measures without checking off “Calculate Graph Measures” 3. System requires certain tasks to be performed in order but doesn’t constrain the user to that order. 4. System does not give user any indication of what measure is currently being displayed. 5. System does not provide detailed list of data from measure before exporting. 6. System does not have a help section and lacks proper documentation. The research team recommends implementing solutions based on the severity of issues and the effort expected to take for implementing a solution. Recommendations are rated on the degree of change to the Syntax2D user interface and the degree of change to the back-end system and documentation. 2 | Syntax 2.0: Usability testing Introduction This report describes the findings of a series of user tests conducted on the software program, Syntax2D. Syntax2D is an open source software suite for urban and architectural spatial analysis developed at the Taubman College of Architecture & Urban Planning (TCAUP) at the University of Michigan. The report begins with an overview of Syntax 2D. Next, the target population for the software is described followed by the goals of the user testing. An overview of the usability testing methodology is given in the fourth section of the report. Recommendations for future development of Syntax2D based on user test findings are given followed by a discussion of limitations of the research team’s user testing. Overview of Syntax2D Syntax2D is an open source spatial analysis software program developed by the Taubman College of Architecture and Urban Planning at the University of Michigan. It is a suite of tools for researchers and practitioners to analyze the spatial configuration of buildings and urban spaces. Syntax2D features isovist, grid, and axial analysis, as well as path analysis and counting features intended to assist with field research. Measures such as connectivity, integration and mean depth can be visualized on a grid and exported to an Excel spreadsheet as quantitative data. Source files for Syntax2D are computer-aided design (CAD) drawings in the 2000 .DXF format. Target Population The target population for the product is university faculty and students in the architecture and urban planning disciplines using space syntax in their research. Space syntax is a relatively small field of study within these disciplines. Research is usually done at the master’s and doctorate level. The University of Michigan has several faculty and Ph.D. and post-doctorate candidates using space syntax in their work. Other centers of space syntax research include the Bartlett School at the University of College London and Georgia Institute of Technology. A space syntax software tool called Depthmap is currently the most widely used software for this type of analysis. The development team hopes to attract current Depthmap users to Syntax2D by providing, 1) functionality not available in Depthmap, 2) an easy to use interface, and 3) completely open source code. Usability Testing Goals The goal of the usability test was to evaluate the system in terms of overall usability, functionality, and aesthetics through direct observations of the user experience. Usability issues were identified in the real system through tasks designed to simulate the typical user experience. The research team used the information obtained from the usability test to discover the areas most in need of improvement and provide a prioritized list of issues to address in future versions of Syntax2D. The goals for usability testing include: ♦♦ Confirm findings from heuristic evaluation ♦♦ Determine additional issues that exist ♦♦ Find functionality issues in real users’ interaction with Syntax2D ♦♦ Find usability issues in real users’ interaction with Syntax2D 3 | Syntax 2.0: Usability Testing ♦♦ Suggest guidelines for future development of Syntax2D Methodology Overview The research team conducted four usability tests on March 21, 2008 and on March 24, 2008. Prior to these tests, a pilot test was administered on March 19 with a member of the research team not involved in composing the tasks. Four participants from the University of Michigan participated in the testing representing a specialized community of current and potential Syntax 2D users. Researchers evaluated the usability and functionality of two core features in Syntax 2D: visual graph analysis and path analysis. The research team observed participants walking through two tasks described in task scenarios. A think aloud technique was used where the testing moderator encouraged participants to talk about their mental process and subjective feelings when completing the tasks. Of the four tests completed by the research team at the University of Michigan, two tests were conducted in the Usability Lab of the Duderstadt Center and two tests in the Spatial Analysis Lab in the Art and Architecture building. Except for a slight modification to the testing script after the first test, the research team used consistent protocol and setup for all tests. The details about the design and the process of the usability test are documented in the following sections. Task Scenarios Researchers asked participants to complete two tasks during each testing session. These two tasks were formulated based on two major function areas of Syntax 2D: grid isovist analy- sis and path isovist analysis. The path isovist analysis was particularly important to test because it is a feature unique to Syntax2D. Each task was further broken up into subtasks each with clear criteria for success. Researchers examined how users achieved or failed each subtask by observing system and user feedback, or through previous knowledge of the software and subtasks. The research team chose to word the tasks and subtasks as explicitly as possible to minimize questions by the participants. This was particularly important because many of the users tested had not recently or frequently used the program and thus might have had difficulty executing a task presented as a contextual scenario. The tasks were used to assess and confirm the severity of issues the researchers found in prior evaluations of Syntax2D, in particular the heuristic evaluation. The research team also expected to discover new issues and gain insights about usability problems from real users during the tests. To control the variables of the test, a single DXF file was used for all tests and tasks. The program coordinator provided a DXF file named “all+types.dxf” for Syntax2D. This file, a basic floor plan, is used in the Syntax2D manual and is often provided to new users. In the file there are three layers: “BOUNDARY,” “WALLS,” and “PATHS.” The first task, Create Grid Isovist, utilized the BOUNDARY and WALLS layers, while the second task, Perform Path Analysis, required the participant to successfully import the “PATHS” layer. See tables 1 and 2 for more detailed hypothesis for each task and sub-task. Questionnaires In addition to asking participants to talk aloud 4 | Syntax 2.0: Usability Testing Table 1. Task 1: Create Grid Isovist. Sub-task Names Description of Expected Actions Hypothesis (or relevant findings from previous research) Importing File Import the floor plan from “all+type. dxf” file. Participant will successfully import plan. Grid Setup In the “Grid Option” dialog box, set a span size of 80 and check the “Calculate Graph Measures” Option. Participants might not be able to associate the issue they may encounter when they try to display the “Integration” measure with the necessary option “Calculate Graph Measures.” Initialize Grid Click on the Menu item “Initialize Grid” Participants might skip this step and go straight to “Create Grid Isovist.” Create Grid Isovist Click on the Menu item “Create Grid Isovist” and interact with the dialog box “Progress.” Users will understand the meaning of the progress bar by clicking "Start" to create the grid isovist. Display Measure Click on the Menu item “Show Grid Participants will not be able to disProperties” and select “Drift” and “Inte- play the “Integration” measure shown gration.” if they did not check the “Calculate Graph Measures” Option in the “Grid Option” dialog box. Recovering from this error is difficult because it requires the user to take a step back in the process. Export data Click on the Menu item “Grid Export Comma Separated Values” and specify the file name as “grid1data.” Participants may try to find this option under the “File” menu. 5 | Syntax 2.0: Usability Testing Table 2. Task 2: Perform Path Analysis. Sub-task Names Description of Expected Actions Hypothesis (or relevant findings from previous research) Importing File Import the floor plan from “all+type2. dxf” file. Participants might not be aware that there was a layer not imported if they did not change the default name for the path layer from PATH to PATHS. Importing Path Users will import the “PATHS” layer when they import the file or they will import the “PATHS” layer separately by executing the menu command “Import Path.” Setup Path Options In the “Path Options” dialog box, select "Path 6" will not appear if the paths “Path 6” and change display methods are not imported properly. to be “By Color.” They might not be able to input the correct name of the layer containing the paths in the “import path” dialog box. Create Obser- In the “Create Observation Points” vation Points dialog box, set the count as "50" Users will successful create the observation points. Create Path Isovist Clicking on the Menu Item “Create Path Isovist.” Participants might skip this step and go straight to display measures. To Display Measures Click on the Menu item “Show Point Properties” and select “Area” and “Complexity.” tf they successfully created a path isovist, participants will be able to display measures. Export Data Click on the Menu item “Path / Export Participants may try to find this option / Comma Separated Values” and spec- under the “File” menu. ify the file name as “Path1data.” 6 | Syntax 2.0: Usability Testing through the two tasks described in the previous section, the research team collected information from participants with pre- and post-task questionnaires. The first three questions in the pre-task questionnaire helped researchers understand participants’ experience with Syntax 2D and other space syntax analysis software tools. This allowed researchers to interpret the behavioral differences between novice and expert users, as well as distinguish the ease of learning from the ease of use. The pre-task questionnaire also collected information, such as participants’ computer literacy and demographic information, which provided relevant context for interpretation. The post-task questionnaire was used to measure participants’ perceptions of the usability and usefulness of Syntax 2D. The questionnaire also asked participants to compare the ease of use of Syntax 2D with DepthMap. In the end of the post-task questionnaire, the researchers asked for participants’ permission to play audio clips from the test to a limited audience. Recruitment At the beginning of the project, the program coordinator for Syntax2D provided a list of six names and email addresses of space syntax researchers at the University of Michigan. A seventh user was later identified. Six of these researchers were interviewed and four of these interviewees participated in user testing. An email was sent to the seven researchers soliciting participation in user testing. Due to a lack of feedback, two additional emails were sent, while the last email stated that participants would receive fifteen dollars in compensation for their time. An email was also sent by the program coordinator to assist in recruitment efforts. Finally, four participants were identified. Setup The usability testing was conducted in a “simple single-room setup[1]” testing environment in two test locations, the Usability Lab and the Spatial Analysis Lab. In each session a moderator, a data logger and an equipment manager sat closely to the participant so that all details could be observed during the tests. Before the participant arrived in the lab, the equipment manager loaded Syntax2D and the .dxf files used in the tasks onto the desktop of a Windows XP computer. The researchers used a screen recording software package called Camtasia to capture the movement of the mouse on the screen. Users verbal narration about what they were doing, thinking and feeling while doing the task were also recorded by Camtasia through a microphone. The research team provided bottled water and snacks to participants to help them relax and mitigate the nervousness associated with participating in a formal test. Test Roles Each testing session involved three researchers: a moderator, a primary data logger, and an equipment manager. The moderator was the primary contact person throughout the test. The moderator greeted the user, oriented the user to the testing environment and then introduced the testing process to the user following the pre-written test script (see appendix). The moderator was in charge of the test. Particularly, the moderator could decide when he/she should provide assistance to the user, based on some preset conditions (see appendix). A debriefing session was conducted immediately after each test. The moderator probed critical errors and unexpected actions with the user. Although the moderator wrote down important points during the process of testing for further 7 | Syntax 2.0: Usability Testing Figure 1. Testing Roles Overview 8 | Syntax 2.0: Usability Testing debriefing, the primary data logger was the person responsible for taking detailed notes on the log sheets (see appendix) according to what he/she observed and what the user said. The equipment manager was in charge of setting up the camera, adjusting the screen capture software (Camtasia) and saving audio/video data after tests. The research team rotated each member’s role over the four tests Pilot Test The researchers conducted a pilot test on March 19, 2008 before the formal usability tests. The main purpose of the pilot test was to familiarize the team with the real testing environment and procedures, while identify possible problems with the equipment, documents, and testing process. The test was administered in a formal testing environment, with all necessary equipments set up. The subject was a team member who had not been involved in composing the tasks and questionnaires. Without any knowledge of the task’s hypotheses and intentions, the subject was assumed to simulate a real test participant as much as possible. The other three members played the roles of moderator, data logger, and equipment manager. Based on the observations of the team, as well as the feedback from the participant, researchers identified several problems with the documents that had caused confusion to the participant. To avoid such problems during formal tests, the team modified the wording of the introduction script, tasks, and post-task questionnaire. They also made minor changes to the logging form based on the feedback from the data logger. See table 3 for more details about the changes. Severity Ratings To prioritize the findings in a consistent way, the researchers utilized Jakob Nielson’s framework of rating severity (Nielsen, 1993): Rating 0 1 2 3 4 Usability Issue I don’t agree that this is a usability problem at all. Cosmetic problem only: need not be fixed unless extra time is available on project. Minor usability problem: fixing this should be given low priority. Major usability problem: important to fix, so should be given high priority. Usability catastrophe: imperative to fix this before product can be released. Findings & Recommendations Summary of Findings Majority of the users demonstrated similar issues in completing both tasks. This is especially the case concerning the path analysis task. Three of the four users could not complete the second task without direct assistance from the moderator in inputting the “PATHS” layer name. Users also had difficulty knowing which measure was currently being displayed and mentioned that a lack of feedback was the issue. Findings from the usability tests are similar to those found during the heuristic evaluation. The data collected from the usability tests help to strengthen the research team’s understanding of those issues uncovered during the heuristic evaluation. The following table list the 6 major usability is- 9 | Syntax 2.0: Usability Testing Table 3. Task and script changes after pilot test. Type Before Pilot Test After Pilot Test Task Changes Using the file all+types.dxf on the Desktop, perform a path analysis. You should perform the analysis on Path 6. Create 50 observation points. The measures should be displayed “By Color.” Using the file all+types.dxf on the Desktop, perform an analysis on points on a path. On the file all+types.dxf is a layer called PATHS. You should perform the analysis on Path 6. Create 50 observation points. The measures should be displayed “By Color.” After you have displayed both measures, please export the data from the path you created. Save the data file on the Desktop and name it "path1data". After you have displayed both measures, please export the data from the last measure you displayed. Save the data file on the Desktop and name it "path1data". In order to complete the task, the Syntax2D window should appear blank, just as it did at the beginning of the task. Removed from both tasks. Our purpose is to simulate how someone would use the program on their own, therefore I will not be able to answer any questions you have about the program or help you through any of the tasks. Our purpose is to simulate how someone would use the program on their own, therefore I will not be able to answer all the questions you have about the program and I can give you only limited guidance through the tasks. Remember, we are testing Syntax2D, not you. Script Changes 10 | Syntax 2.0: Usability Testing sues found during usability testing. The usability issues are ranked by order of severity and priority. In the table there is a short description of each usability issue. Detailed findings will follow the rank order presented in the table below and will provide details, examples, and proposed solutions for each issue. Priority Usability Issue 1 2 3 4 5 6 System does not recognize layers in a file. Cannot show certain measures without checking off “Calculate Graph Measures.” System requires certain tasks to be performed in order but doesn’t constrain the user to that order. System does not give user any indication about what measure is currently being displayed. System does not provide detailed list of data from measure before exporting. System does not have a help section and lacks proper documentation. Detailed Findings Severity 4 # Usability Issue 1 System does not recognize layers in a file. Severity 4 Details: After launching the program, the first required step in the creation of a new analysis is to import a .dxf file that had been previously exported from AutoCAD. The .dxf file used for testing contains three layers: BOUNDARY, WALLS, and PATHS. When importing the .dxf file into 4 3 3 Figure 2. Layer name dialog box when importing a .DXF file. 2 2 Syntax2D, the system dialog box provides default values for each layer as seen in figure 2. If the layer names deviate from the default values the user must input the layer names as created in AutoCAD. During the Path Analysis task, users were required to import the path layer called “PATHS.” There are two methods for accomplishing this subtask: 1) when importing the .dxf file specify the layer name “PATHS” in the dialog box (see in figure 2), and 2) import the path after 11 | Syntax 2.0: Usability Testing the user has imported the floor plan; the user would click “Import Path” from the “Path” menu and be prompted to specify the layer name in which the paths can be found. Our observations showed that during the initial importing of the .dxf file, users click ‘OK’ and accept all layer name defaults provided by the program. In the .dxf file used for testing, the layer name containing paths, “PATHS,” deviated from the default value, “PATH.” Therefore the layer with paths was not properly imported using the first method. The system relies on default values for layer names because it cannot recognize layer names within the .dxf file. If the path layer name is incorrect there is no feedback provided by the system indicating that the layer does not exist. This leads the user into believing that they have successfully imported all layers, or at the very least that there was not an issue. The user must recall layer names in a file. This requires additional cognitive effort. It also requires prior knowledge of the layer names in the AutoCAD file. If the system recognized layer names the user would not have to recall layer names reducing effort on the part of the user. Example: All four users missed the opportunity to specify the path layer name with “PATHS” during the initial importing of the .dxf file. One users was able to recover from this error and proceed to use the second method for importing a path layer, which lead to the successful completion of the overall task. The other three participants required the moderator to explicitly guide them to the “Specify Layer Name” dialog box for importing a path. The moderator then instructed users to specify the layer name “PATHS.” This moderator guidance was necessary to enable users to continue with the rest of the task. One user reported that they expected the paths to simply show up when importing the .dxf file. When the paths did not display, the user began to use a process of elimination by clicking all the shortcut buttons and exploring all the drop down menus. Proposed Solutions: Ideally Syntax2D would automatically recognize layers within an imported .dxf file. The layer names would be displayed to the user so the user can visually verify that all layers were properly imported and recognized. For the user this alleviates the need to recall the names of the layers in the .dxf file. It also gives the user feedback about what layers are contained in the file. As noted in the comparative evaluation, the major competitor to Syntax2D, DepthMap, imports all layers found within a .dxf file, then allows users to show/hide each layer. # Usability Issue 2 Cannot show certain measures without checking the”Calculate Graph Measures” checkbox. Severity 4 Details: In the “Grid Setup/Options” dialogue box there is a check off box titled “Calculate graph measures (Connectivity, etc.)” If the user would like to calculate and display syntactic measures such as connectivity, mean depth, and integration the user must check this option. If the user does not check this option, the syntactic measures can still be clicked on in the “Show Grid Properties” but they will not be displayed in the grid. Requiring users to click “Calculate graph measures” in the “Grid Setup/Options” 12 | Syntax 2.0: Usability Testing is problematic for several reasons. First of all, the results of the action (or inaction) are not felt directly after the action has taken place. After the user sets up the grid options, the grid must be initialized before the the user can create the grid isovist. The default measure is area, which does not require “Calculate Graph Measures.” When the user tries to select a syntactic measure requiring “Calculate Graph Measures” the user is many steps removed from the “Grid Setup/Options” dialog box. Thus, the user has difficulty recalling the “Calculate graph measures” option. Furthermore, users may not even know that this option is required. After the user has tried to display a measure that requires “Calculate graph measures,” the system gives no indication that this option is needed. Even if the user recalls that they must check the option, it requires the user to begin the create grid process from the beginning. This is time consuming and inefficient and can be very frustrating for the user. Example: Only two out of four participants checked the “Calculate graph measures” option. Only one participant understood that this option was required to display integration. When asked in the debrief why the participant choose the option he stated that in Depthmap calculating measures like integration required a second calculation process by the system. He described this second calculation as a “clunky, two-step process.” The other participants were never aware that the “Calculate graph measures” option was required to show integration. One participant checked this option and successfully displayed the measure but did not know that it was this option that allowed her to display the measure. Another participant went through the process of creating the grid several times and searched through the “Grid” file menu for several minutes searching for an option to perform a second calculation that would display the syntactic measures. Proposed Solutions: There are several possible solutions to this problem. If the initialize grid was consolidated into the “Grid Setup/Options” process then the “Calculate graph measures” option would directly proceed the creation of the grid. This would allow the user to more easily relate the action of clicking on the “Calculate graph measures” option to the display of syntactic measures. Additionally when a user clicked or attempted to click a measure that had not been calculated, the system could give feedback that these measures can only be displayed if “Calculate graph measures” is selected in the “Grid Setup/Options.” This will allow the user to more easily recover from their error. Finally the development team could decide to always calculate these measures. Though this takes additional processing time, if these measures are frequently used by researchers it may be worthwhile to have the syntactic measures calculated with the rest of the measures. # Usability Issue 3 System requires certain tasks to be performed in order but doesn’t constrain the user to that order. Severity 3 Details: The system requires that subtasks be performed in a specific order, yet the system does not constrain the user to that order. The system presents the user with too much freedom and does not utilize user interface cues to guide the user along a specific path. As you can see in 13 | Syntax 2.0: Usability Testing complete the steps in order and successfully create the grid isovist. One of the two users performed the process in the completely reverse order. The user realized the correct order only after the completion of the process in reverse order. Proposed Solutions: Figure 3. Current Grid Menu. figure 3, the proposed order is to first setup the grid using “Grid Setup/Options,” then proceed to “Initialize Grid,” and finally ‘“Create Grid Isovist.” The interface currently used within the drop down menus allows the user to click on any item, in any order. This allows the user to skip necessary steps resulting in error dialog boxes. Example: Two of the four participants caused error dialog boxes to occur when attempting to create a grid isovist, which were all the result of skipping necessary steps. Despite the errors that occurred, both users were able to recover and Figure 4. Proposed solution for guiding users through the Grid menu. As you can see in figure 4, constraining the user to the first required step in the create a grid isovist process will prevent the user from going out of order. As the user completes prerequisite steps, the next step in the process will become available. This constraint method is widely used in software products and thus is a method that users are comfortable and familiar with. Another possible solution is to consolidate steps, specifically combining the Grid Setup/ Options step with the Initialize Grid step. The research team observed that users who had previously initialized the grid and subsequently changed the Grid Setup/Options believed that the grid had changed according to the new setup options. Currently, the program requires the user to initialize the grid before the changes made in the grid setup will take effect. Essentially, the user must perform the first two steps again. Therefore, consolidating the grid setup with the initialization of the grid will ensure that changes made in the grid setup will take effect on the currently displayed grid as user expects. # Usability Issue 4 System does not give user any indication about what measure is currently being displayed. Severity 3 14 | Syntax 2.0: Usability Testing Details: After creating the Grid Isovist or Path Isovist, users can display a series of measures such as Drift, Integration, Area, Complexity, etc. (see Figure 5). However, after the users click on some measures, the system does not give any cues to the users about which measure is currently displayed. Instead it requires the user to recall what measure was last Figure 5. Measures for selected. As the visual Path Analysis. presentation of some measures are similar in appearance, some of the users will experience difficulty in figuring out the current status of the system, especially when they are novice users who are not familiar with the measures. Example: In our testings, two of four participants had a difficult time figuring out what measure was displayed. One of the participants had to initialize the grid and run the measure again when he found he was not able to recall which measure he had selected. These two participants exported the data and viewed the data files in Excel to check whether the proper measure had been displayed. One participant also tried the “View Report” under the “Grid” and “Path” menus and “View Path Data” under the “Path” menu. Though the “View Path Data” included sufficient data to indicate that the measure was properly processed, the “View report” can only provide the summary of the data. Users found the summary data to be insufficient in confirming whether or not the measure had been properly calculated. Proposed Solutions: There are many possible solutions that will allow users to know what measure is currently being displayed. A label can appear on the can- Figure 6. Status bar where current measure could be displayed. vas indicating the currently displayed measure. Alternatively the name of the measure could be displayed in the status bar (See figure 6). Within the current framework, the “Show Grid Properties” menu could indicate the currently displayed measure by highlighting it or displaying a bullet next to the measure. Users should be able to view detailed data about the measures being displayed within Syntax2D, not only in an exported Excel file. # Usability Issue 5 System does not provide detailed list of data from measure before exporting. Severity 2 Details: After creating the grid isovist and displaying the measures, some users want to view the data about the measures they have performed to ensure the data is correct and complete before they export the data. However, they do not have an access to such data. The “View report” 15 | Syntax 2.0: Usability Testing option under the “Grid” menu only provides a summary of the measures calculated instead of detailed list of data for the measures. In this situation, users must export the data and review the detailed data in an Excel spreadsheet. If the user discovers she made an error, the user must return to the system and perform the analysis again. Example: Two of the four participants verified that the measures had been properly calculated by viewing the quantitative data generated. One participant tried the “View Report” option under the “Grid” menu but could not verify that the measures were successfully calculated with the summary data provided. The user was, however, satisfied with the “View Path Data” under the “Path” menu, an option he used in the second task, path analysis. Both participants reviewed the exported data to make sure the data was what they wanted. One of the participants exported data several times during the process of performing different measures to understand what measure was being displayed and whether the task was performed correctly. The system does not have a help menu. This is particularly important for a software product that is used only intermittently like Syntax2D. Syntax2D does not include in the system, or in a manual, descriptions or algorithms of the measures it calculates. Space syntax is a relatively new research field and there is debate about what measures are important and how measures should be calculated. Most users are not familiar with all the measures in the system. Example: During user testing one participant clicked on the “Help” menu when she was struggling to complete a task. She found information about Syntax2D but no help. Another participant talked at length during the test and the debrief about the importance of the comprehensive manual for the system. She stated that users need to have detailed information about the measures so that users know what each measure represents and also what algorithms are being used to generate the measures. This user is a well-known space syntax researcher but even she was unfamiliar with many of the measures. Proposed Solutions: Proposed Solution: A possible solution is to provide a “View Grid Data” option under the “Grid” menu similar to the “View Path Data” option under the “Path” menu. With such an option, users can view the detailed data about the measures they have performed before exporting the data. Syntax2D should at the very least include a link to the already existing manual. Though it is short, it walks users step-by-step through the various analyses supported by Syntax2D. The research team proposes that developers extend the manual to include detailed documentation on the measures and analyses it provides. In the program itself, tool tips could be utilized to give users information about the measures. In addition to providing valuable information to researchers, it may prompt users to start utilizing measures they are less familiar with. # Usability Issue 6 System does not have a help section and lacks proper documentation. Details: Severity 2 16 | Syntax 2.0: Usability Testing Table 4. Recommendation Overview Recommendations Provide a link to the existing user manual. Show or highlight the name of the current measure being displayed in either the canvas or the "Show Grid Properties" menu. Make unavailable options, menu items and toolbar buttons gray and unclickable. Provide timely, specific and constructive feedback to user when errors occur. Support auto recognition of layer names Provide a "View Grid Data" option that enable users to view the detailed data about the measures they have performed before exporting the data. Provide a local and contextual help system and detailed documentation. Issue # Effort for Implementation Change of the User Interface Change of the Backend System and documentations. 6 0 0 0 4 1 1 1 3 1.5 2 1 2&3 2.5 3 2 1 2.5 1 4 5 2 2 2 6 3 2 3 17 | Syntax 2.0: Usability Testing Recommendations The research team recommendeds a step-bystep plan to implement the solutions described above based on the severity of issues and the effort expected to take for implementing a solution. The effort was measured in two aspects: the degree of changing the Syntax 2D user interface and the degree of changing the backend system and documentation. The degree was rated by the researchers on a scale of one to five, easy to more difficult. The effort for implementation was represented as the average degree of changing the user interface and the back-end system. See table 4 on page 16. Limitations The goal of the usability testing was to observe real users interacting and performing tasks with Syntax2D. However, there are some inherent limitations in interpreting data obtained from usability testing. One limitation concerns the context of the tasks. Some of the participants do not perform Grid Isovist Analysis or Path Analysis and mainly focus on Axial Line Analysis. For these participants, the tasks we developed seemed somewhat artificial due to the parameters we required them to use. For example, we had users specify the grid span size, which could have been something that they were not use to doing. The artificial environment could have caused users to pay more attention to detail than in a normal setting. Another limitation is that the research team utilized two locations rather than one, more controlled, environment. Two of the four tests took place in a quiet and controlled usability lab. Due to scheduling issues, the research team was forced to use a second location for the other two tests. In the other two cases, the reseach team utilized the Spatial Analysis Lab. The Spatial Analysis Lab is slightly less quiet and less controlled than the usability lab. Despite this difference, the research team does not believe this had any effect on the performance of the users. Lastly, the introduction script was changed and the tasks slightly modified to provide more guidance to the user. This change could have been a result of an extremely small pool of possible participants, which did not afford the research team the luxury of pre-screening to identify ideal user candidates. After the first test, the research team noticed that users were going to need more guidance with importing the path layer, therefore the script was changed to allow for limited guidance and the task were adjusted to include the path layer name. Although this seems like a major change, the research team believes that it did not affect the data. The level of guidance provided to U01 was consistent with the level of guidance provided to U02 and U04. Conclusion Usability tests conducted by the research team confirmed findings from the team’s heuristic evaluation. Participants made critical errors during the tests that required moderator assistance to recover from. These critical errors and others are described in the usability report. The research team has also noted possible solutions to problems users encountered. Since many researchers use space syntax tools on monthly basis, it is important that the program is intuitive and easy to use after months of inactivity. Thus, the research team strongly urges that the Syntax2D development team resolve the most severe usability issues reported. 18 | Syntax 2.0: Usability Testing References Nielsen, J. (1994). Heuristic evaluation. In J. Nielson & R. L. Mack (Eds.), Usability inspection methods (pp. 25-62). New York: John Wiley & Sons. Rubin, J., (1994). Handbook of Usability Testing. New York: Wiley. P.50. 19 | APPENDIX Introduction Script Hello my name is________ and this is ________. We are students in the School of Information course 622: Evaluation of Systems and Services. Thank you very much for coming. Would you like a bottle of water or any snacks? Allow me to briefly explain why we've asked you to come in today and what exactly you will be doing. You will be helping our team evaluate the usability of Syntax2D. I'll be asking you to perform some typical tasks with the program. Please complete the tasks as you normally would, for example, take the same amount of time and attention to detail that you would if you were performing the tasks on your own. Do your best but don't be too concerned about your results. Remember, we are testing Syntax2D, not you. When you are completing tasks please talk through the tasks. Tell me what you are doing and what you are thinking and feeling as you perform the task. For example, if my task is to open a file in Microsoft Word, I would say out loud, "First I go to File menu. I click File and scroll down to Open. After I click on Open, a window pops up..." Please articulate any questions you have while going through the program. Our purpose is to simulate how someone would use the program on their own, therefore I will not be able to answer all the questions you have about the program and I can give you only limited guidance through the tasks. Remember, we are testing Syntax2D, not you. The tasks you will be performing today are: 1) create a grid isovist on a floor plan and 2) perform path analysis on a floor plan. I will hand you a sheet of paper describing each task in detail before you begin each task. Equipment Let me demonstrate the equipment. This Windows XP computer has Syntax2D loaded on it. We are using software called Camtasia to capture the movement of the mouse on the screen. We ask that you refrain from moving the Syntax2D window. If it is necessary that you move the window to complete the task please do so, but clearly explain why. The equipment tech may need to interrupt the task in order to move the window back in position. We will be capturing audio data, which is particularly important, so we ask that you speak clearly and loudly when speaking aloud. If at anytime you would like to stop this session please let me know. Do you have any questions? If not, let's begin by having you sign this consent form. 20 | APPENDIX Consent Form We will be recording audio of your session to allow the research team to review the testing session during the analysis phase. Please read the statements below and sign where indicated. Thank you. I understand that an audiotape recording will be made of my session. I grant the School of Information 622 Evaluation Team to use this recording for the purposes mentioned above, and waive my right to review and inspect the recording. Print Name: Signature: Date: 21 | APPENDIX Pre-Task Questionnaire 1. What space syntax software do you primarily use? (Check only one) Syntax2D DepthMap OmniVista Confeego Spatialist Other (please indicate) ________ 2. In the last 12 months, about how often do you use your primary space syntax software tool? Never Yearly (1-11 times a year) Monthly (1-3 times per month) Weekly (1-6 times per week) Daily (at least once per day) 3. What other space syntax software tools have you used? (Check all that apply) Syntax2D DepthMap OmniVista Confeego Spatialist Other (please indicate) ________ 4. Overall, how comfortable are you with using a computer for day-to-day tasks (for example, word processing, searching the internet, etc.)? Please circle just one. Very comfortable Somewhat comfortable Neither comfortable nor uncomfortable Somewhat uncomfortable Uncomfortable 5. How many hours do you work on the computer on a typical day? 0-2 3-5 6-8 9-12 13 or above 6. Gender: M F (Continues on next page) 22 | APPENDIX 7. Age: _______ 8. Highest level of education completed: Bachelor Master Ph.D. Post-doctorate 9. What is your major or area of study/work? Circle all that apply. Architecture Urban planning Other:_________________________________________ 23 | APPENDIX Tasks (For Moderator) Please read through the entire task before you begin. Feel free to refer back to this sheet while performing the task. We will be asking you to complete 2 tasks today: Task 1: Create Grid Isovist 1. Using the file all+types.dxf on the Desktop, create a grid isovist. The grid isovist should have a span size of 80. Display the following measures, in order: 1. Drift 2. Integration 2. After you have displayed both measures, please export the data from the last measure you displayed. Save the data file on the desktop and name it "grid1data". 3. Separately, save the file you were working on as "grid1" on the Desktop. Task 2: Perform Path Analysis 1. Using the file all+types2.dxf on the Desktop, perform an analysis on points on a path. On the file all+types2.dxf is a layer called PATHS. You should perform the analysis on Path 6. Create 50 observation points. The measures should be displayed “By Color.” Display the following measures, in order: 1. Area 2. Complexity 2. After you have displayed both measures, please export the data from the last measure you displayed. Save the data file on the Desktop and name it "path1data". 3. Separately, save the file you were working on as "path1" on the Desktop. 4. In order to complete the task, exit the program. 24 | APPENDIX Tasks (For Participant) Please read through the entire task before you begin. Feel free to refer back to this sheet while performing the task. We will be asking you to complete 2 tasks today: Task 1: Create Grid Isovist 1. Using the file all+types.dxf on the Desktop, create a grid isovist. The grid isovist should have a span size of 80. Display the following measures, in order: 1. Drift 2. Integration 2. After you have displayed both measures, please export the data from the last measure you displayed. Save the data file on the desktop and name it "grid1data". 3. Separately, save the file you were working on as "grid1" on the Desktop. Task 2: Perform Path Analysis 1. Using the file all+types2.dxf on the Desktop, perform an analysis on points on a path. On the file all+types2.dxf is a layer called PATHS. You should perform the analysis on Path 6. Create 50 observation points. The measures should be displayed “By Color.” Display the following measures, in order: 1. Area 2. Complexity 5. After you have displayed both measures, please export the data from the last measure you displayed. Save the data file on the Desktop and name it "path1data". 6. Separately, save the file you were working on as "path1" on the Desktop. 7. In order to complete the task, exit the program. 25 | APPENDIX Post-task questionnaire Please rank the difficulty of each task: 1. Creating the grid isovist was: Very difficult 1 2 3 4 5 Very easy 2 3 4 5 Very easy 2. Performing a path analysis was: Very difficult 1 3. What feature(s) did you like most? 4. What feature(s) did you like least? 5. Was performing the tasks easier, more difficult, or the same in Depthmap (or another space syntax software tool)? Much easier Easier The same More difficult Much more difficult My primary space syntax software tool is Syntax2D 6. May we play short portions of the audio during our final class presentation to illustrate our findings? Yes No 7. May we play short portions of the audio for the Syntax2D development team, Jean Wineman, Sophia Psarra, Nick Senske, and Sung Kwon Jung? Yes No 26 | APPENDIX Debrief Questions Ask about any problems that were encountered. (if applicable) Ask for detail about comments made during the test. (if applicable) Ask for detail about the features that were liked/disliked. Ask for detail about how Syntax2D compares to other space syntax software used. We greatly appreciate your participation in this usability test! 27 | APPENDIX Name: Participant # Date: Start time: Codes: Subtask Codes: CU : Comment by User IMP : Importing File E : Error GRID : Creating the grid and setting up options ! : Critical Incident PATH : Selecting the path and setting up options ? : Probe User during debriefing EXP : Exporting data O : Observation by test monitor SAV : Saving the file S : Successful subtask completion EXIT: exit program RA : Required assistance Subtask Code Code Time Observations, comments, Notes 28 | APPENDIX Codes: Subtask Codes: CU : Comment by User IMP : Importing File E : Error GRID : Creating the grid and setting up options ! : Critical Incident PATH : Selecting the path and setting up options ? : Probe User during debriefing EXP : Exporting data O : Observation by test monitor SAV : Saving the file S : Successful subtask completion EXIT: exit program RA : Required assistance Subtask Code Code Time Observations, comments, Notes 29 | APPENDIX Codes: Subtask Codes: CU : Comment by User IMP : Importing File E : Error GRID : Creating the grid and setting up options ! : Critical Incident PATH : Selecting the path and setting up options ? : Probe User during debriefing EXP : Exporting data O : Observation by test monitor SAV : Saving the file S : Successful subtask completion EXIT: exit program RA : Required assistance Subtask Code Code Time Observations, comments, Notes 30 | APPENDIX Codes: Subtask Codes: CU : Comment by User IMP : Importing File E : Error GRID : Creating the grid and setting up options ! : Critical Incident PATH : Selecting the path and setting up options ? : Probe User during debriefing EXP : Exporting data O : Observation by test monitor SAV : Saving the file S : Successful subtask completion EXIT: exit program RA : Required assistance Subtask Code Code Time Observations, comments, Notes 31 | APPENDIX Moderator Help Guidelines When to Provide Assistance When the user… • All Tasks o cannot find the files on the desktop o ask questions concerning the hardware (because we are using a Mac) • Task 1 o cannot figure out after a reasonable amount of time that they need to initialize the grid • Task 2 o cannot figure out after a reasonable amount of time how to specify the layer name PATHS. When NOT to Provide Assistance If the user… • Task 1 o missed the ʻCalculate Graph Measuresʼ check box in the Grid Setup Options o fails to show the second measure due to the problem above. • Task 2 o Cannot tell the difference between which measures are being displayed due to failure of selecting display ʻBy Color.ʼ 32 | APPENDIX Pre-task Questionnaire Results 1. What space syntax software do you primarily use? Syntax2D DepthMap OmniVista Confeego Spatialist 0 1 2 3 2. How often do you use your primary space syntax software tool? Never Yearly Monthly Weekly Daily 0 1 2 3 3. What other space syntax software tools have you used? Syntax2D DepthMap OmniVista Confeego Spatialist 0 1 2 3 33 | APPENDIX 4. How comfortable are you with using a computer for day-to-day tasks? Very comfortable Somewhat comfortable Neither Somewhat uncomfortable Uncomfortable 0 1 2 3 4 5. How many hours do you work on the computer on a typical day? 0-2 3-5 6-8 9-12 13 or above 0 1 2 6. Gender? Male Female 0 1 2 34 | APPENDIX 7. Age? U01 U02 U03 U04 0 9.4 18.8 28.2 37.6 47.0 8. Highest level of education completed? Bachelor Master Ph.D. Post-doctorate 0 1 2 9. What is your major of area of study/work? Architecture Urban Planning Organizational Studies 0 1 2 3 4 35 | APPENDIX Post-task Questionnaire Results 1. Creating the grid isovist was: Very difficult 1 2 3 4 Very Easy 5 0 1 2 2. Performing a path analysis was: Very difficult 1 2 3 4 Very Easy 5 0 1 2 36 | APPENDIX 3. What feature(s) did you like most? Visual quality of the program. VGA, path, and axial analysis. The “view report” in the path analysis, listing all the measures before you export. Being able to specify observation points/nodes in the path isovist. 4. What feature(s) did you like least? Having to ʻstartʼ grid isovist even though Iʼd already indicated that I want to run the analysis. Hard to find the right options. That you have to run each measure individually. It is not intuitively obvious how to perform some tasks. 5. Was performing the tasks easier, more difficult, or the same in DepthMap? Much easier Easier The same More difficult Much More difficult 0 1 2