1
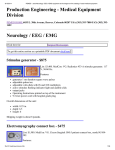
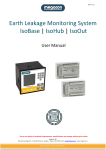
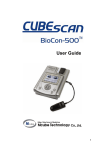
Reviewing Data
WinTCD - [Reviewing monitoring data for Doe, John, D.]
Exam View Doppler Configuration Report Window Help
win
CD
T
REV
V
H E
V
Reviewing Fast
Curve data
L T H C
V
Mon.
Only
VI SYS
X
_
X
R E
Save 7 (auto): CH 1 (S1) - 2 MHz PW : MCA R
33
cm/s
save 7 (auto): Ch 1 (S1) - 2 MHz PW : MCAR
24
cm/s
50
56
-
100
Depth
PI
10
0
SV
Mean
-1
Depth Mean
100
0
0
The Fast Curve window displays
the Envelope Toward and
Envelope Away data collected for
each of the channels during
Monitoring acquisitions.
_
TM
-100
15
0
SV
SYS
0.00
0
PI
DIA
0
save 8 (auto): Ch 1 (S1) - 2 MHz PW : MCAR
-100
39
-
Power
Sys
24
cm/s
50
Depth Mean
100
0
9
Fast Curve Window
-100
Event List
* Event Descriptor
100
Ch1: Env +
50
<<
>>
13:11:21
14:12:33
-1
chan 1: H.I.T.
save 6 (auto)
chan 1: H.I.T.
save 7 (auto)
SoundTrak on
chan 1: H.I.T.
chan 1: H.I.T.
chan 1: H.I.T.
save 8 (auto)
15
0
SV
SYS
0.00
0
PI
DIA
0
Time
13:40:06
13:41:11
13:41:58
13:42:03
13:42:10
13:45:06
13:48:22
13:49:34
14:02:11
Trend Window
Ch1: SYS
100
Note: The procedures in this
section of the chapter are for the
Monitoring Mode only, not the
Diagnostic Mode.
The Fast Curve window has fixed,
selectable time scales of 2, 5, 10,
20, and 30 seconds.
Saving the Fast Curve
configuration
You can save the present Trend
and Fast Curve display settings
with the present file so the next
time you review the data, the
settings will be selected automatically by the system.
50
<<
Ch1: DIA
>>
13:00:00
14:00:00
14:00:00
Vessel Labels
Start
Scale
Nic Vue
15:00:00
Envelope
Units
Spectra On/Off
WinTCD - [Reviewing
Time Scale
Parameter Boxes
9:09 A.M.
Labels
Figure 1: The Fast Curve window displays the Envelope Towards and
Away curves. This example shows only the Envelope Towards curve
has been selected for display.
Configuration
Configure Event List
Configure Fast Curves
Configure Trend
Configure S-Keys
Configure Footswitch
User Definable Items
Save Configuration
System
Figure 2: Click on Configuration and then on Save Configuration.
The Fast Curve settings that will
be saved include:
• Curves
• Curve colors
• Value scales
• Time scales
• Window sizes
• Display events
• Cursors
1. Click on Configuration
(Figure 2).
2. Click on Save Configuration.
S8-47