1
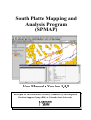
South Platte Mapping and
Analysis Program
(SPMAP)
Developed for the South Platte Advisory Committee by the Integrated
Decision Support Group (IDS) at Colorado State University
User Manual - South Platte Mapping and Analysis Program
South Platte Mapping and Analysis Program - Version 1.4.9
Copyright
Copyright © 2000
Integrated Decision Support Group
601 South Howes, USC Suite 502
Colorado State University
Fort Collins, Colorado 80523 USA
About This Document
This document is a user manual that provides supplementary material to the online documentation for
ArcView version 3.2. Information about menu options and commands available in the interface and not
customized by this work will not be documented here. Please refer to the online documentation for
ArcView. This document will only describe the South Platte Mapping and Analysis Program Extension to
ArcView.
Project Purpose and Funding
This project was created in order to meet the needs of as many water users in the South Platte as
possible. In order to develop a consensus on the data and modeling needs of the water users in the South
Platte Basin an advisory committee was formed. The committee is comprised of representatives from local
water groups working in the South Platte River Basin. The CU Model described in this manual is part of
the South Platte water management research being worked on by the Integrated Decision Support (IDS)
Group (a research group at Colorado State University).
Funding for this project has been provided by the United States Department of Interior, Bureau of
Reclamation (USBR), Northern Colorado Water Conservancy District (NCWCD), the South Platte Lower
River Group, Inc. (SPLRG), the Colorado State Engineers Office (SEO), Goundwater Appropriators of the
South Platte (GASP), the Central Colorado Water Conservancy District (CCWCD), Lower South Platte
Water Conservancy District (LSPWCD), Colorado Water Resources Research Institute (CWRRI), City of
Greeley (Greeley), and the City of Fort Collins (Fort Collins)
Trademarks
ARC/INFO, ArcView, Avenue, and ARC/TIN are registered trademarks of the Environmental
Systems Research Institute, Inc., Redlands, California, USA.
For information Contact:
IDS Group and Software:
Luis Garcia -- IDS Group
601 South Howes, USC Suite 502
Colorado State University
Fort Collins, Colorado 80523 USA
Phone:
(970) 491-5144
Fax:
(970) 491-2293
E-mail:
garcia@ engr.colostate.edu
SPMAP Version 1.4.9
Work in the South Platte:
Jon Altenhofen - NCWCD
Northern Colorado Water Conservancy District
Post Office Box 679
Loveland, CO 80539
Phone:
(970) 667-2437
Fax:
(970) 669-1143
E-mail:
[email protected]
ii
Table of Contents
About This Document - - - - - - - - - - - - - - - - - - - - - - - - - - - - - - - - - - - - - - - - - - - - - - - - - - - - ii
Project Purpose and Funding - - - - - - - - - - - - - - - - - - - - - - - - - - - - - - - - - - - - - - - - - - - - - - - ii
Trademarks - - - - - - - - - - - - - - - - - - - - - - - - - - - - - - - - - - - - - - - - - - - - - - - - - - - - - - - - - - - ii
For information Contact:- - - - - - - - - - - - - - - - - - - - - - - - - - - - - - - - - - - - - - - - - - - - - - - - - - ii
1.0 Introduction - - - - - - - - - - - - - - - - - - - - - - - - - - - - - - - - - - - - - - - - - - - - - - - - - - - - - - - -1
1.1 Background and Purpose - - - - - - - - - - - - - - - - - - - - - - - - - - - - - - - - - - - - - - - - - - - -1
1.2 The South Platte Mapping and Analysis Program - - - - - - - - - - - - - - - - - - - - - - - - - - - - -1
1.3 SPMAP Web Site - - - - - - - - - - - - - - - - - - - - - - - - - - - - - - - - - - - - - - - - - - - - - - - - - - -1
2.0 Managing Extensions and Projects - - - - - - - - - - - - - - - - - - - - - - - - - - - - - - - - - - - - - - - -3
2.1 Loading the South Platte Extension - - - - - - - - - - - - - - - - - - - - - - - - - - - - - - - - - - - - - - -3
2.2 Creating a New View - - - - - - - - - - - - - - - - - - - - - - - - - - - - - - - - - - - - - - - - - - - - - - - -4
2.3 Saving Your Project - - - - - - - - - - - - - - - - - - - - - - - - - - - - - - - - - - - - - - - - - - - - - - - - -5
3.0 Map Themes Pull-Down Menu - - - - - - - - - - - - - - - - - - - - - - - - - - - - - - - - - - - - - - - - - - -7
3.1 Setting the Directory for the Map Themes - - - - - - - - - - - - - - - - - - - - - - - - - - - - - - - - - -7
3.2 Map Theme Information - - - - - - - - - - - - - - - - - - - - - - - - - - - - - - - - - - - - - - - - - - - - - -8
Cities and Populations - - - - - - - - - - - - - - - - - - - - - - - - - - - - - - - - - - - - - - - - - - - - - - -9
County Boundaries - - - - - - - - - - - - - - - - - - - - - - - - - - - - - - - - - - - - - - - - - - - - - - - - - -9
Crop Demo - - - - - - - - - - - - - - - - - - - - - - - - - - - - - - - - - - - - - - - - - - - - - - - - - - - - - - 10
Ditches, Lake, and Streams for Water District 64 (1:24k) - - - - - - - - - - - - - - - - - - - - - - - 10
Division 1 Wells - - - - - - - - - - - - - - - - - - - - - - - - - - - - - - - - - - - - - - - - - - - - - - - - - - - 10
Division 1 GPS Wells - - - - - - - - - - - - - - - - - - - - - - - - - - - - - - - - - - - - - - - - - - - - - - - 10
Hydrography (1:100k) - - - - - - - - - - - - - - - - - - - - - - - - - - - - - - - - - - - - - - - - - - - - - - - 10
PLSS (Township, Range, and Section) Themes - - - - - - - - - - - - - - - - - - - - - - - - - - - - - - 10
Stream Depletion Factors (SDFs) Theme - - - - - - - - - - - - - - - - - - - - - - - - - - - - - - - - - - 11
Water District Boundaries Theme - - - - - - - - - - - - - - - - - - - - - - - - - - - - - - - - - - - - - - - 11
3.3 Adding a Map Theme to a View - - - - - - - - - - - - - - - - - - - - - - - - - - - - - - - - - - - - - - - - 11
3.4 Rearranging the Legend - - - - - - - - - - - - - - - - - - - - - - - - - - - - - - - - - - - - - - - - - - - - - 12
3.5 Editing the Legend - - - - - - - - - - - - - - - - - - - - - - - - - - - - - - - - - - - - - - - - - - - - - - - - - 13
3.6 Labeling Map Themes - - - - - - - - - - - - - - - - - - - - - - - - - - - - - - - - - - - - - - - - - - - - - - 13
3.7 Querying Identities for Map Themes - - - - - - - - - - - - - - - - - - - - - - - - - - - - - - - - - - - - - 13
iii
User Manual - South Platte Mapping and Analysis Program
3.8 Adding Additional Map Themes - - - - - - - - - - - - - - - - - - - - - - - - - - - - - - - - - - - - - - - - 14
4.0 Images Pull-Down Menu - - - - - - - - - - - - - - - - - - - - - - - - - - - - - - - - - - - - - - - - - - - - - - - 15
4.1 Selecting Multiple Images - - - - - - - - - - - - - - - - - - - - - - - - - - - - - - - - - - - - - - - - - - - - 15
4.2 Select Quads from Index - - - - - - - - - - - - - - - - - - - - - - - - - - - - - - - - - - - - - - - - - - - - - 16
4.3 Select TM 30M Satellite Images - - - - - - - - - - - - - - - - - - - - - - - - - - - - - - - - - - - - - - - - 16
4.4 Select IRS 5M Satellite B & W Images - - - - - - - - - - - - - - - - - - - - - - - - - - - - - - - - - - - 16
4.5 WD64 50m Color - - - - - - - - - - - - - - - - - - - - - - - - - - - - - - - - - - - - - - - - - - - - - - - - - - 16
4.6 WD64 50m B & W - - - - - - - - - - - - - - - - - - - - - - - - - - - - - - - - - - - - - - - - - - - - - - - - - 17
5.0 Functions Pull-Down Menu - - - - - - - - - - - - - - - - - - - - - - - - - - - - - - - - - - - - - - - - - - - - - 19
5.1 Change Theme Directory - - - - - - - - - - - - - - - - - - - - - - - - - - - - - - - - - - - - - - - - - - - - - 19
5.2 Comparing Common Themes - - - - - - - - - - - - - - - - - - - - - - - - - - - - - - - - - - - - - - - - - - 19
5.3 Convert TRS -> UTM - - - - - - - - - - - - - - - - - - - - - - - - - - - - - - - - - - - - - - - - - - - - - - - 21
5.4 Edit Attributes of Active Theme - - - - - - - - - - - - - - - - - - - - - - - - - - - - - - - - - - - - - - - - 22
5.5 Locating an Area by Township, Baseline, Range, and/or Section - - - - - - - - - - - - - - - - - - 23
5.6 Printing the Current View - - - - - - - - - - - - - - - - - - - - - - - - - - - - - - - - - - - - - - - - - - - - 23
5.7 Printing Using Pre-defined Layouts - - - - - - - - - - - - - - - - - - - - - - - - - - - - - - - - - - - - - - 24
5.8 Print PLSS Locations from File - - - - - - - - - - - - - - - - - - - - - - - - - - - - - - - - - - - - - - - - 24
Querying a Region - - - - - - - - - - - - - - - - - - - - - - - - - - - - - - - - - - - - - - - - - - - - - - - - - 24
Labeling Wells - - - - - - - - - - - - - - - - - - - - - - - - - - - - - - - - - - - - - - - - - - - - - - - - - - - - 25
Labeling Township and Range - - - - - - - - - - - - - - - - - - - - - - - - - - - - - - - - - - - - - - - - - 26
Printing Sections Within the Selected Township and Range - - - - - - - - - - - - - - - - - - - - - - 27
5.9 Recalculate Area and Perimeter - - - - - - - - - - - - - - - - - - - - - - - - - - - - - - - - - - - - - - - - 27
6.0 Crop Layer Edits Pull-Down Menu - - - - - - - - - - - - - - - - - - - - - - - - - - - - - - - - - - - - - - - 29
6.1 Convert to new SPMAP Crop Theme - - - - - - - - - - - - - - - - - - - - - - - - - - - - - - - - - - - - 29
6.2 Initialize Farm Data - - - - - - - - - - - - - - - - - - - - - - - - - - - - - - - - - - - - - - - - - - - - - - - - 29
6.3 Split Crop Layer Polygons - - - - - - - - - - - - - - - - - - - - - - - - - - - - - - - - - - - - - - - - - - - - 29
Steps for Spitting Crop Layer Polygons - - - - - - - - - - - - - - - - - - - - - - - - - - - - - - - - - - - 29
Right Mouse Button Menu for Spitting Polygons - - - - - - - - - - - - - - - - - - - - - - - - - - - - - 30
6.4 Merge Crop Layer Polygons - - - - - - - - - - - - - - - - - - - - - - - - - - - - - - - - - - - - - - - - - - 31
6.5 Save and Save As Crop Polygon Edits - - - - - - - - - - - - - - - - - - - - - - - - - - - - - - - - - - - - 32
6.6 CU Configuration Window - - - - - - - - - - - - - - - - - - - - - - - - - - - - - - - - - - - - - - - - - - - 32
6.7 Field and Farm Editor Window - - - - - - - - - - - - - - - - - - - - - - - - - - - - - - - - - - - - - - - - 32
Legend Mode - - - - - - - - - - - - - - - - - - - - - - - - - - - - - - - - - - - - - - - - - - - - - - - - - - - - - 33
Set selected fields to crop type - - - - - - - - - - - - - - - - - - - - - - - - - - - - - - - - - - - - - - - - - 33
Farm Description Options - - - - - - - - - - - - - - - - - - - - - - - - - - - - - - - - - - - - - - - - - - - - 33
Add Selected Wells to Farm - - - - - - - - - - - - - - - - - - - - - - - - - - - - - - - - - - - - - - - - - - - 34
Build CU Button - - - - - - - - - - - - - - - - - - - - - - - - - - - - - - - - - - - - - - - - - - - - - - - - - - - 34
6.8 Well Information - - - - - - - - - - - - - - - - - - - - - - - - - - - - - - - - - - - - - - - - - - - - - - - - - - 34
7.0 References - - - - - - - - - - - - - - - - - - - - - - - - - - - - - - - - - - - - - - - - - - - - - - - - - - - - - - - - - 35
8.0 Index - - - - - - - - - - - - - - - - - - - - - - - - - - - - - - - - - - - - - - - - - - - - - - - - - - - - - - - - - - - - - 37
Version 1.4
iv
1.0 Introduction
1.0 Introduction
1.1
Background and Purpose
The South Platte Mapping and Analysis Program (SPMAP) described in this manual is one component
of the South Platte research project being worked on by the Integrated Decision Support (IDS) Group (a
research group at Colorado State University). The goals of this project are to improve the quantity and
quality of spatial data and modeling capabilities available to water managers in the South Platte River Basin.
Water managers will be able to use the tools developed by this research effort to determine the amount of
water currently being used in the South Platte, the source of the water (surface water or groundwater), and
the impacts of this water use on the river. Based on surface water supplies and consumptive use estimates,
managers can estimate the Consumptive Use (CU) of groundwater and depletions to river flows that need
augmentation. Geographic Information System (GIS) themes and spatial analysis features of the South
Platte Mapping and Analysis Program (SPMAP) can be used to create input for the CU Model and/or the
Stream Depletion Factor (SDF) Model. The South Platte Mapping and Analysis Program (SPMAP) will
eventually be merged into a more general system for the South Platte that is comparable to Decision Support
Systems (DSS) for other basins in Colorado.
1.2 The South Platte Mapping and Analysis Program
The development of GIS themes for well locations and streamflow depletion factors (SDFs) has now
been combined with other useful map themes to provide a comprehensive tool for mapping and analysis.
ArcView version 3.2 was selected for the model platform; an extension to ArcView using the Avenue
scripting language was constructed. This software is designed to run in a Windows 95/98/NT environment
and should be run on a pentium or greater machine with at least 1 gigabyte hard-drive and 32 megabytes of
memory. This user manual will describe the SPMAP extension to ArcView, including creating and editing
map layers, preparing a file for input into the CU Model, and printing maps from the system. The interface
also contains on-line help parallel to this document and can be viewed by selecting the Help > South Platte
Tool Help menu item with the extension loaded.
1.3 SPMAP Web Site
The latest released version of this software and the mapping themes needed can be downloaded from
the following web site:
http://www.ids.colostate.edu/projects/spmap/
SPMAP Version 1.4.9
1
Background and Purpose
User Manual - South Platte Mapping and Analysis Program
SPMAP Version 1.4.9
2
2.0 Managing Extensions and Projects
2.0
Managing Extensions and Projects
Extensions allow customizations to ArcView menu items and functionality while retaining the original
functionality of ArcView. Any loaded extensions remain a part of a project when it is saved. An ArcView
project saves the settings to map layers, view options, and other features selected during an ArcView session
in a file with an “.apr” extension. When you load an extension through the Extension dialog, that extension
remains loaded in your project until you explicitly unload it.
2.1 Loading the South Platte Extension
Functions unique to the SPMAP extension include the Map Themes, Images, Functions, and Crop
Edits pull-down menus. The rest of the options in the interface are standard ArcView options.
1. Open ArcView Version 3.2.
2. Select the File > Extensions option from the ArcView GIS Version 3.2 window as shown in
Figure 1.
Figure 1: Extension Option in the File Pull-Down Menu
3. From the Extensions window select South Platte Extension v1.4.9 (or current version) and the
OK button.
SPMAP Version 1.4.9
3
Loading the South Platte Extension
User Manual - South Platte Mapping and Analysis Program
Figure 2: Extension Selection Window
2.2 Creating a New View
After you select the South Platte Extension, a window called Untitled is displayed on the screen. This
is the main project window. ArcView draws maps in another window, called a View.
1. To open a View window for displaying the maps, select the Views icon in the Project window.
2. Next, select the New button to open a new view. A new view called View 1 will be created.
Note - If you open a second view, it will be called View 2, etc.
2
1
Figure 3: Opening a New View
Note - When a view window is selected, a “View” pull-down option will appear on the menu bar.
This option controls the attributes of the active View window.
SPMAP Version 1.4.9
4
2.0 Managing Extensions and Projects
2.3 Saving Your Project
A project contains all the views, tables, themes, display options and layouts used. In SPMAP, you can
create multiple projects based on tasks you want to accomplish. You should save your work as a project
periodically.
1. After opening a view, select the File > Save Project option, the location and a name for your
project.
2. To save the project with a new name select the File > Save Project As option and a browse window
will be opened to select the name and location of the new project file.
3. When the project is saved, a “*.apr” file will be created that can be opened in ArcView. The
extensions needed for the project (in this case the South Platte Extension) will be saved with the
project. When the project is loaded again, the extension(s) that were used to create the project will
be loaded automatically.
SPMAP Version 1.4.9
5
Saving Your Project
User Manual - South Platte Mapping and Analysis Program
SPMAP Version 1.4.9
6
3.0 Map Themes Pull-Down Menu
3.0 Map Themes Pull-Down Menu
The ArcView GIS Users Manual defines a map theme as a layer of geographic information for a
particular attribute and location, and it is synonymous with a coverage. SPMAP contains themes for well
locations, streams, crop types, and other information. These map themes are located in the gis directory on
the SPMAP CD or on your hard-drive if you installed SPMAP from the internet. You will need to set the
directory for the map themes when creating a new project.
3.1 Setting the Directory for the Map Themes
Before you can retrieve map themes from the Map Themes pull-down menu, you will need to select
the directory containing these files either from the CD or your hard-drive. If a file selection box is displayed
when a theme is selected from the menu, then follow these steps:
1. When the file selection box opens and asks for the drive and the directory containing the themes.
Select the drive where you installed your South Platte Mapping Analysis Program files.
2. Select the “splatte.dir” file and the OK button (this file is typically located in the /gis directory).
The splatte.dir file is simply a marker that tells ArcView that the SPMAP GIS themes are in the
directory selected (i.e. c:/gis, in Figure 4).
Figure 4: Selecting the Directory Containing the themes
Note - You may need to select the directory containing the themes each time you begin a new project
with SPMAP.
SPMAP Version 1.4.9
7
Setting the Directory for the Map Themes
User Manual - South Platte Mapping and Analysis Program
3.2 Map Theme Information
The Map Themes pull-down menu contains maps developed from various data types described in Table
1. Many of the maps originally covered the entire state of Colorado, or were assembled for areas of Colorado
greater than the South Platte Basin. These maps were “clipped” for Division 1 or Water District 64, using
the 1:250,000 division and districts map. This table describes edits made to the maps during this project.
Technical questions should be addressed to the IDS Group at Colorado State University.
Table 1: South Platte Mapping and Analysis Program Map Themes
Data Type and Resolution
Description
Base File Name
Cities
US Census Bureau - Populations for 1980, 1990,
and estimated for 1991 by city.
cities
Counties
USGS - Vector information for County
Boundaries
counties
Crop Demo
(See Section 3.2.3 “Crop Demo”)
cropdemo
Ditches WD64 24K
(See Section 3.2.4 “Ditches, Lake, and Streams
for Water District 64 (1:24k)”)
ditch64
Division 1 Wells
Colorado Department of Natural Resources,
Office of the State Engineer (See Section 3.2.5
“Division 1 Wells”)
wells_div1
Division 1 GPS Wells
Wells with locations verified using Global
Positioning Systems (GPS).
d1_gps_wells
Gages
USGS stream flow gages - from the USEPA
Basins program
gages
GASP River Reaches
Digitized and edited by the IDS group from
originals, Schneider (1972) provided by GASP.
reach
Hydrography 100K
(See Section 3.2.7 “Hydrography (1:100k)”)
hydrography
Irrigated Fields 1998
Created by Northern Colorado Water
Conservancy District using the 5m black and
white and the 164ft color images.
field_98
Lakes WD64 24K
(See Section 3.2.4 “Ditches, Lake, and Streams
for Water District 64 (1:24k)”)
lake_64
NCWCD Weather Stations
Locations of weather stations maintained by
Northern Water Conservancy District, data is
populated in files for use in the CU Model.
ncwcd_weather
NWS Weather Stations
Locations of weather stations maintained by the
National Weather Service, data is populated in
files for use in the CU Model.
nws_weather
SPMAP Version 1.4.9
8
3.0 Map Themes Pull-Down Menu
Table 1: South Platte Mapping and Analysis Program Map Themes
Data Type and Resolution
Description
Base File Name
PLSS 24K
(See Section 3.2.8 “PLSS (Township, Range,
and Section) Themes”)
plss_trs
PLSS 100k
(See Section 3.2.8 “PLSS (Township, Range,
and Section) Themes”)
plss_trs_24k
PLSS 100k (no sections)
PLSS 100k with section polygons removed.
plss_tbr
Roads
Tiger Files - Vector information for highways
and major roads, includes the names of roads.
roads
Roads Minor
Tiger Files - Vector information for minor roads,
information includes road type (i.e. paved,
gravel or dirt).
roads_minor
South Platte River
Digitized and edited by the IDS group from
originals Schneider (1972) provided by GASP.
river
State > 50 gpm Wells
Subset of the Division 1 Wells, wells with a
capacity of less than 50 gallons per minute.
state_well
Stream Depletion Factor (SDF)
(See Section 3.2.9 “Stream Depletion Factors
(SDFs) Theme”)
sdf
SDF Boundary
(See Section 3.2.9 “Stream Depletion Factors
(SDFs) Theme”)
sdf_body
SDF WD64 10m
(See Section 3.2.9 “Stream Depletion Factors
(SDFs) Theme”)
sdf_64_10m
Streams WD64 24k
(See Section 3.2.4 “Ditches, Lake, and Streams
for Water District 64 (1:24k)”)
strm64
Water Districts
(See Section 3.2.10 “Water District Boundaries
Theme”)
div_dist
3.2.1
Cities and Populations
City locations and populations for 1980, 1990, and estimated for 1991 by city were obtained from the
US Bureau of the Census from the http://www.census.gov/ftp/pub/geo/www/ internet site.
3.2.2
County Boundaries
United States Department of the Interior Geological Survey (USGS) digital line graphs (DLGs) data
were used to populate this theme. This was updated and clipped for the Water Division 1 boundaries by the
IDS Group at Colorado State University.
SPMAP Version 1.4.9
9
Map Theme Information
User Manual - South Platte Mapping and Analysis Program
3.2.3
Crop Demo
Agricultural data have been populated using TM (thematic mapper) 25 meter multispectral satellite
images combined with an Indian Remote Sensing (IRS-1C) 5 meter panchromatic (grey scale) to delineate
the field boundaries and determine the crop type for each parcel of land. This data will be improved and
some ground verification will take place as the project progresses.
3.2.4
Ditches, Lake, and Streams for Water District 64 (1:24k)
Digitized from USGS quads by the Colorado Division of Wildlife, Aquatics, provided to IDS by the
Northern Colorado Water Conservancy District.
3.2.5
Division 1 Wells
This theme contains wells identified in Division 1 by the State of Colorado. This theme was developed
with help from the State Engineers Office (SEO) and is populated with legal and physical identifiers when
possible.
3.2.6
Division 1 GPS Wells
As part of this effort the locations of some wells have been updated using Global Positioning System
(GPS) equipment. In some cases the locations have been changed from those in the Division 1 Wells theme.
This information can be used to estimate a more accurate value for Stream Depletion.
3.2.7
Hydrography (1:100k)
United States Department of the Interior Geological Survey (USGS) digital line graphs (DLGs)
hydrography network data were used to populate this theme. This theme contains water features as vectors
at 1:100,000 resolution. These data are grouped by their main attribute function as: rivers; streams; ditches
and canals; aqueducts; wash and ephemeral drains; flumes, siphons, and penstocks; dams and weirs;
tunnels; and undefined water features.
The DLG characterization is obtained from the MAJOR and MINOR attribute definitions assigned by
the USGS (USGS, 1983). This was updated and clipped for the Water Division 1 boundaries by the IDS
Group at Colorado State University. Technical questions and comments can be addressed to the IDS Group
or the USGS at:
Chief, National Mapping Division
U.S. Geological Survey
516 National Center
Reston, Virgina 22092
3.2.8
PLSS (Township, Range, and Section) Themes
This theme describes the Public Land Survey System for eastern Colorado including section, township
and range data obtained from USGS internet site at 30 minute resolution (1:62,000). Data was obtained in
DLG format for over 200 separate tiles covering the northeastern portion of Colorado, the associated
numeric codes were determined and the resulting coverages joined into one seamless coverage according to
the following steps:
1. Transformed original files into ARC/INFO format.
SPMAP Version 1.4.9
10
3.0 Map Themes Pull-Down Menu
2. Joined the separate tiles into one coverage.
3. Edited the resultant coverage with the following steps:
•
•
•
Based on the USGS publication (USGS, 1983) definitions of the major and minor attributes the
area, perimeter, plss#, plss-id, pls#, pls-id, section, section_mod, township, base_side, range
meridian_side, and meridian were assigned to the coverage.
Resolved joining errors by linking vectors from the boundaries of individual tiles.
Corrected all the zero category data areas to reflect the correct codes.
4. Coverage was clipped for Water Division 1.
Three themes were created for the South Platte Extension, the first describes the township, baseline,
range, and section values for each polygon and the second has the section lines removed. The township,
baseline, range, and section information is used to query for locations for wells and to locate areas for
display.
3.2.9
Stream Depletion Factors (SDFs) Theme
Digitized from (Hurr and Schneider, 1972) for each reach in the South Platte River Basin by Mario
Mejia-Navaro with the IDS Group at CSU. Stream depletion factors are an estimate of how long water
withdrawn from a well will take to deplete the river. These values are routinely used to determine when the
effect of a well will be experienced in the South Platte River.
Once this coverage was digitized and edited for errors, the South Platte River was added with a SDF
value of 0. ARC/INFO was used to generate a Triangular Irregular Network (TIN) line coverage using ARC/
TIN. The TIN coverage was used to generate SDF isolines for every ten days. The resulting coverage was
then split into small segments and converted to the GIS GRASS (Geographical Resources Analysis Support
System) to generate 40 meter (0.59 acres) grid resolution raster maps. These raster maps were then joined
for each Water District and exported back to ARC/INFO for display. The resulting coverages for each Water
District in Water Division 1 show an SDF value for each acre in the South Platte River Basin. These values
will be used to assign SDF values for each well in the basin. As the location of the wells improves the
accuracy of the SDF values assigned to them will also be improved. Technical questions and comments can
be addressed to the IDS Group at CSU.
3.2.10 Water District Boundaries Theme
The South Platte area is the same as the Water Division 1 area, therefore only the Water District
boundaries within Division 1 are populated. United States Department of the Interior Geological Survey
(USGS) digital line graphs (DLGs) data were used to populate this theme by the IDS Group at Colorado
State University.
3.3 Adding a Map Theme to a View
1. Select maps from the Map Themes pull-down menu. As maps are selected they will be displayed
as part of the active View window. The display options for the maps can be changed and the changes
will be saved with the project.
2. As you select map themes, the image will be displayed in the View window and the names of the
themes that you selected will be displayed in a vertical legend along the left side of the View
window. Themes that are turned on are designated by a check mark and are visible in the View
SPMAP Version 1.4.9
11
Adding a Map Theme to a View
User Manual - South Platte Mapping and Analysis Program
window. Themes that are turned off appear in the legend, but are not designated by a check mark
and do not appear in the View window.
Figure 5: Selecting Themes for Display in a View
3. Active map themes are different from map themes that are turned on. A map theme is active if the
name of the theme is surrounded by a box in the legend. You can make multiple themes active by
holding down the Shift key while clicking on the map theme names in the legend. A map theme
does not have to be visible to be active. Figure 6 illustrates the hydrography theme that is both
turned on (as shown by the check mark and the map image) and active (as shown by the box
surrounding the name). In Figure 6, the cities theme is not turned on, since there is no box around it.
Figure 6: Selecting the Directory Containing the Themes
3.4 Rearranging the Legend
ArcView displays map themes in the order that they appear on the legend. Themes appearing at the top
of the legend are drawn over themes appearing lower on the legend. Therefore, you should place river and
well layers on top of county or crop layers so you can see them.
1. In the legend, select the map theme by clicking on it with the left mouse button.
2. Holding the left mouse button down, drag the map theme to its new location.
3. Release the mouse button. The picture in the View window will redraw itself to depict the new
order of the map themes.
SPMAP Version 1.4.9
12
3.0 Map Themes Pull-Down Menu
3.5 Editing the Legend
You may want to edit the default colors or shapes that appear in the legend and the View window.
1. In the legend, double-click on the name of the theme you want to edit.
2. The Legend Editor window appears. In this window, you can select a new legend edit to or the
legend type. You can also edit the legend symbol size and shape or the legend labels.
3.6 Labeling Map Themes
After you have opened a map theme, you will probably want to label its attributes. The following
example will explain how to label the Counties map theme.
1. Select Map Themes > Counties. Make sure that the Counties box in the View legend is active.
2. Select Window > Show Symbol Window. Select the ABC button. Change the font to Arial, 8
point, bold.
3. Close the Marker Palette Window.
4. Select Theme > Auto-label. In the Label field window select Label.
5. Select OK. The program will place the county names on the map.
Note - To label map themes with large numbers of attributes (such as wells), you should query a
small region before placing labels to save time and computer memory. See Section 5.8.2 for
detailed instructions.
3.7 Querying Identities for Map Themes
You may want to view information about the layers you have opened. For example, you may have
opened the counties theme and wanted to know the name of the county and the area shown on the theme.
1. Select the Counties map theme. Make sure the theme is active (displayed in the legend with a box
around it).
2. Select the identify
selected).
icon (on the toolbar) to make it active (i.e. it will be depressed when it is
3. The cursor will appear as
in the map display section of the view window. Position the cursor
over the unknown town and click with the left mouse button. The Identify Results window will be
displayed. This will give the information for the item selected with the mouse.
4. Multiple items can be selected by additional mouse clicks. The map information associated with the
items selected are shown in the Identity Results window. Select individual items in the left section
of the window to display attributes associated with the item.
SPMAP Version 1.4.9
13
Editing the Legend
User Manual - South Platte Mapping and Analysis Program
Figure 7: Identify Results Dialog Window
5. If more than one map theme is active (shown as boxed in the legend), the Identify Results window
will display information from all the active themes (Figure 7).
Note - Other query and search features are available from the main window, see the Query
(Request) option in the ArcView Help Topics for an example and see (See Section 5.8.1
“Querying a Region”).
3.8 Adding Additional Map Themes
1. To add themes not in the SPMAP extension, select View > Add Themes or select the Add Themes
icon (i.e.
).
2. The Add Theme dialog window will be displayed.
3. Select the desired theme(s) and OK. The themes will be added to the currently selected view.
Note - Map Themes added this way will not be added to the Map Theme pull-down menu.
Figure 8: Add Themes Dialog Window
SPMAP Version 1.4.9
14
4.0 Images Pull-Down Menu
4.0 Images Pull-Down Menu
The ArcView GIS Users Manual defines an image as spatial data where a single piece of information is
stored in each pixel. Since only one piece of information is stored in each pixel, images, unlike map themes,
don’t have attribute tables. In SPMAP, satellite imagery and quads are stored as images and are accessed
from the Images pull-down menu.
Figure 9: Images Pull-Down Menu
4.1 Selecting Multiple Images
The image options proceeded by “Select” can be used to select which images to display. An
intermediate image is displayed with the aerial extent of the images for selection. Only the images you select
will be displayed. Follow these steps to select images:
1. Select the type of image from the Images pull-down menu (Figure 9).
2. The selection map will be displayed (Figure 10).
Image Selection Tool
Figure 10: Select Map for Images
SPMAP Version 1.4.9
15
Selecting Multiple Images
User Manual - South Platte Mapping and Analysis Program
3. The Image Select Tool
will become active and the cursor will change to a lightning bolt.
4. Select one of the squares in the selection map. You may need to select the directory where the file
is located, if so a file selection browser window will be displayed with the name of the file the
program is looking for.
5. When the file is found it will be displayed in the View window.
6. Additional images can be displayed in the same manner.
4.2 Select Quads from Index
Quads were purchased from the U.S. Geological Survey in digital raster graphics (DRG) format. Quads
were clipped of collar information and assembled to create a seamless coverage. The coverage is projected
in UTM coordinates and clipped to the area of interest.
4.3 Select TM 30M Satellite Images
The 30 meter color imagery was obtained from a satellite placed in orbit by the United States
Government. This satellite is commonly referred to as Landsat 5. The Landsat imagery has the following
parameters.
•
multispectral (records reflected energy in the green, blue, red, near infrared, middle infrared, far
infrared and thermal bands)
•
spatial resolution of 30 meters
The Landsat imagery that is used for SPMAP was obtained for September 4, 1996. Bands 4, 3, and 2
are displayed using the red, blue and green video guns resulting in a pseudo infrared color scheme. The
imagery was processed by the Northern Colorado Water Conservancy District in 1996.
4.4 Select IRS 5M Satellite B & W Images
The 5 meter grayscale imagery was obtained from a satellite placed in orbit by the government of India.
This satellite is commonly referred to a the IRS-1C. The IRS-1C imagery has the following parameters
•
panchromatic
•
5 meter pixel resolution
The IRS-1C imagery that is used for SPMAP is a mosaic of three different images. The shape of the
merged imagery is an upside down “L” in which the lower leg was obtained May 5, 1996; the center was
obtained on November 11, 1996; and the upper right leg was obtained on November 25, 1996. The imagery
was processed by the Northern Colorado Water Conservancy District in 1996.
4.5 WD64 50m Color
The 50 meter color imagery was created by utilizing a cubic convolution algorithm (utilizing the 16
nearest neighbors) on the original 82 feet Landsat imagery.
SPMAP Version 1.4.9
16
4.0 Images Pull-Down Menu
The Landsat imagery that is used for SPMAP is one image that was obtained September 4, 1996. Bands
4, 3, and 2 are displayed using the red, blue and green video guns resulting in a pseudo infrared color
scheme. The imagery was processed by the Northern Colorado Water Conservancy District in 1996.
4.6 WD64 50m B & W
The 50 meter grayscale was created by utilizing a cubic convolution algorithm (utilizing the 16 nearest
neighbors) on the original 5 meter IRS-1C imagery.
The IRS-1C imagery that is used for SPMAP is a mosaic of three different images. The shape of the
merged imagery is an upside down “L” in which the lower leg was obtained May 5, 1996; the center was
obtained on November 11, 1996; and the upper right leg was obtained on November 25, 1996. The imagery
was processed by the Northern Colorado Water Conservancy District in 1996.
SPMAP Version 1.4.9
17
WD64 50m B & W
User Manual - South Platte Mapping and Analysis Program
SPMAP Version 1.4.9
18
5.0 Functions Pull-Down Menu
5.0 Functions Pull-Down Menu
The Functions pull-down menu provides basic capabilities needed to maintain spatial data.
Figure 11: Functions Pull-Down Menu
5.1 Change Theme Directory
If you do not have a large hard drive, you may want to store your map themes on a CD-ROM or another
drive.
1. Select Functions > Change Theme Directory.
2. Select the directory where your themes and images are stored, and select the splatte.dir file. This is
only to support the Map Themes and Images pull-down menus. If you want to display other themes
or images than those supported with SPMAP, you must add them with View > Add Theme option
(See Section 3.8 “Adding Additional Map Themes”).
3. If you don’t have a splatte.dir file in the directory with your themes and images, you can make one
by opening notepad and saving an empty file with the name splatte.dir in the directory you want (i.e.
it should be at the same level as the directories with the individual themes).
4. When the splatte.dir directory file is selected, the Map Themes and Images pull-down menus will
use the themes and images in the directory where the splatte.dir file is located.
5.2 Comparing Common Themes
The Compare Common Themes function computes the distance between wells (or any point theme)
with the same ID numbers. Central, GASP, and Lower South Platte wells located by using the legal
description can be compared with the locations of the wells in the state well database using a common
identification number. Comparisons like these are used to prioritize which wells should be targeted for field
SPMAP Version 1.4.9
19
Change Theme Directory
User Manual - South Platte Mapping and Analysis Program
work to determine accurate locations. The location of wells is important for assigning an accurate SDF value
and determining problems in the well databases from different data sources.
This example shows how these comparisons can be made using the hypothetical map themes Test 1 and
Test 2. The wells in each theme have the same ID numbers, but some have different locations. This function
computes the distances between well locations with the same ID and writes the results to a text file.
1. Two well shape were made for this example using the Division 1 Wells theme called Test1.shp and
Test2.shp. The locations of some of the wells were changed in Test1.shp to show how this feature
works.
2. After the themes are made, display the ‘Test1.shp’ and ‘Test2.shp’ themes by using the Add
Themes option.
3. Select the Functions > Compare Common Themes option (Figure 12).
Figure 12: Comparing Common Themes
4. The Theme Choices window asks you to choose the theme that you want to search. Highlight the
‘Test1.shp’ theme and select the OK button (Figure 13).
Figure 13: Theme Choices Window
5. The Attribute Choices window will appear. Select the attribute(s) that you want to search. In this
case you will search by identification numbers. Select Id and select the OK button when you are
done.
SPMAP Version 1.4.9
20
5.0 Functions Pull-Down Menu
Figure 14: Attribute Choices Window
6. The Theme Choices window will reappear. Select the theme that you want to compare against the
first theme (i.e. ‘Test2.shp’ theme) and select the OK button.
Figure 15: Theme Choices for Comparison
7. The results of the comparison will be written as a text file. A new window will ask for the directory
and file name where you want the results to be written. You can name the file and save it to any
directory, but the default name is “res.txt.”
8. You can view this new file in Notepad or any word processing software.
9. Figure 16 illustrates the results of the comparison. The results show that wells with the 5684 ID
number have the same locations listed in themes Test1 and Test2. The wells with the ID numbers
5673 and 5674 have the same ID numbers, but different locations, as indicated by the distance errors
(in feet). This indicates that the actual location will need to be determined by field verification
(Figure 16).
Figure 16: Computed Distances Between Wells Having the Same ID Number
5.3 Convert TRS -> UTM
This function converts locations from Township, Range, and Section format to Universal Trans
Mercator format.
1. Select the Functions > Convert TRS -> UTM pull-down menu option. If the PLSS 100k coverage
has not been selected, a prompt will be displayed to load the Public Land Survey System (PLSS)
map.
SPMAP Version 1.4.9
21
Convert TRS -> UTM
User Manual - South Platte Mapping and Analysis Program
Figure 17: Prompt to Load PLSS 100k
2. The TRS values to be converted must be saved as a text file in the following format:
Well-ID Meridian Township 0 Base_side Range 0 Meridian_side
Section F,C Quarter_Section Quarter-Quarter_Section...
Figure 18: Input File for TRS to UTM Conversion
3. Select Functions > Convert TRS to UTM.
4. Select the name of the text file you created in Step 1.
5. Specify the name and directory of your output file. The default name is “utm.txt.” SPMAP will
display the output files in the following format:
Well-ID meters_north meters_east
Figure 19: Output File for TRS to UTM Conversion
5.4 Edit Attributes of Active Theme
This function allows you to edit attributes of multiple items in the active theme.
1. Turn on and make active the theme that you want to edit (See Section 3.3 “Adding a Map Theme
to a View”).
2. Select the feature you want to edit (field, well, etc.) by using the select tool
dragging the mouse over the items to edit.
and clicking and
3. Select Functions > Edit Attribute of Active Theme.
4. The Field Choices window will appear. Select the field you want to edit from the Field Choices
pull-down menu. For example, if you want to change the name of a weather station in the NCWCD
Weather Station, select Weather_st. Press OK.
SPMAP Version 1.4.9
22
5.0 Functions Pull-Down Menu
Figure 20: Field Choices and New Value Window
5. The New Value Choices window will appear. Type the new name of the feature and press OK. The
new value will be entered into the fields for all the items that were selected.
Note - Use caution when changing attributes--you cannot undo attribute changes. Any changes you
make are automatically saved.
5.5 Locating an Area by Township, Baseline, Range, and/or Section
1. Select Locate by legal description from the Functions pull-down menu.
2. If you do not have the PLSS theme loaded, the program will ask you if you want to load it. Select
the Yes button to load the PLSS theme. The Locate window will open.
3. Type in the Section, Township, Base Side, and Range that you want to locate.
4. If you leave an asterisk symbol “*” in a field, the field will not be used to search for a location.
Typically a user would select a township, a base side, and a range. Users interested in a smaller areas
could also choose a section. Township values in the South Platte Basin range from 1 to 16, and the
range includes values from 41 to 81.
Figure 21: Locate Dialog Window
5. The map display in the View window will zoom into the specified area.
6. The Locate window shown in Figure 21 illustrates how to select all sections of Township 6 North,
Range 54.
5.6 Printing the Current View
1. Select the Print option from the Functions pull-down menu, or select the
window.
icon in the main
2. The print setup should be set to landscape. The File > Print Setup option can be used to change the
layout to landscape if it is set as portrait.
SPMAP Version 1.4.9
23
Locating an Area by Township, Baseline, Range,
User Manual - South Platte Mapping and Analysis Program
5.7 Printing Using Pre-defined Layouts
The SPMAP extension contains two pre-defined printing layouts.
1. In the Project window, select the Layouts
icon.
2. Two choices, IDS Print and IDS Print PLSS, will appear in the Project window.
3. Double-click on the format that you prefer. IDS Print displays the map, the legend, and scale
information in a landscape (11 by 8.5 inches) format. IDS Print PLSS displays the map and scale
information in portrait format (8.5 by 11 inches).
4. The format that you selected will appear but will not contain any information. Double-click on
Empty View (the area where the map will go).
5. The View Frame Properties window will open. Select the View that you want (probably View 1)
6. You can also select the map scale. You can have an automatic or user-specified scale. Press the OK
button when you are done selecting properties
.
Figure 22: View Frame Properties Window
7. Select File > Print to print the map. See the ArcView Help for additional information.
5.8 Print PLSS Locations from File
Sometimes you will want to label a region with the Township and Range, label the wells in that region,
and print the images. The following extended example explains these steps. It also explains how to print
many sections of a Township and Range from a text file.
5.8.1
Querying a Region
After you have opened a map theme, you will probably want to examine a small region in close detail.
This involves querying the parts of the map that interest you. Although you can label all the components of
a map theme (all the wells in the South Platte Basin, for example) you will save a lot of time and computer
memory by labeling only the portion of the map that interests you. These steps will explain how to query a
small portion of your map, Township 5 North, Range 54.
1. After setting the directory for the map themes, select Map Themes > Division 1 Wells and then
SPMAP Version 1.4.9
24
5.0 Functions Pull-Down Menu
select Map Themes > 100K PLSS.
2. Next make the 100K PLSS theme from the legend active. Then select Theme > Query from the
main menu.
3. In the Fields menu select [Township] by double-clicking on the word Township. Set [Township]
equal to five.
4. Type and after the first expression. Then, select [Base_side] by double-clicking on the word
Base_side in the Fields menu. Set [Base_side] equal to “N”. Remember that alphabetic characters
must be surrounded by double quotation marks.
5. Type another and after the second expression. Then select the range by double-clicking on the
word Range in the Fields menu. Set [Range] equal to 54.
6. When you are done, the text in the Fields window should appear as follows: ([Township] = 5) and
([Base_side] = “N”) and ([Range] = 54).
Figure 23: Using Query to Select a Township
7. Select New Set to select Township 5 North, Range 54 and close the 100K PLSS window.
Note - If the Update Values box in the Township Range Section window is selected with a check
mark, you will be able to select values for the Township, Base side, and Range from the
Values field. If Update Values is not selected, you will have to type the values manually.
5.8.2
Labeling Wells
Next you’ll want to zoom to the area you selected and label your wells.
1. Select View > Zoom to Selected to zoom into Township 5 North, Range 54.
2. Make the Division 1 Wells theme in the View 1 legend active.
3. Select Theme > Select by Theme. The Select By Theme window will open.
SPMAP Version 1.4.9
25
Print PLSS Locations from File
User Manual - South Platte Mapping and Analysis Program
Figure 24: Selecting Features from Two Themes
4. In the first field, select “Intersect” from the pull-down menu. In the second field, select “100K
PLSS.” Select the New Set button. You can see that only the wells in the selected Township are
higlighted with a different color than wells in the surrounding Townships.
5. Select Window > Show Symbol Window. The Marker Palette window will appear.
6. In the Marker Palette window, select the button labeled ABC. You can now choose the font, size,
and style that you prefer for labeling the wells.
7. Select Theme > Auto Label. Select Distid from the Label field window.
Figure 25: Using Auto-label to Place ID Numbers on Wells.
8. Select Use Theme’s Text Label Placement Property. Deselect Scale Labels. Select the OK
button. This labels all the wells in Township 5 North, Range 54 with a state well identification
number.
Note - You can also open the Marker Palette window by pressing the Control button and the P
button simultaneously.
5.8.3
Labeling Township and Range
1. To label Township 6 North, Range 44, select the PLSS theme in the View 1 legend.
2. Select Window > Show Symbol. The Marker Palette window will appear.
SPMAP Version 1.4.9
26
5.0 Functions Pull-Down Menu
3. In the Marker Palette window, select the button labeled ABC. Choose the font, size, and style that
you want to use for the labels.
4. Select Theme > Auto Label. Select Ts_Rg_Sec from the Label field window.
5. Select Use Theme’s Text Label Placement Property. Deselect Scale Labels. Select the OK
button. This labels the Township and Range that you queried.
Note -
5.8.4
If you resize the View window or zoom in or out after placing the labels on the image, the
location and size of the labels may shift and you will have to repeat the process.
Printing Sections Within the Selected Township and Range
Here, you can print sections 20, 21, and 23 within Township 6 North, Range 44.
1. Minimize ArcView and open a text editor such as Notepad or any word processing software.
2. Type the township, the direction (N or S), the range, and the section that you wish to print. Separate
each of these items with one space. If you want to print more than one section, type the information
for the next section on a new line.
Figure 26: Creating a Text File that Contains PLSS Locations
3. Save the file as a text file with a *.txt extension and close the file.
4. Return to ArcView and select Functions > Print PLSS Locations from File.
5. Select the text file that you created in steps 1-3. Select OK.
6. The program will then zoom to each of the selected sections and print them at a scale of 1:12,000.
5.9 Recalculate Area and Perimeter
This option recalculates the areas and perimeters of polygons in a theme that has been edited. Select the
theme you want to recalculate the area for and make it active. Select the Functions > Recalculate Area and
Perimeter of Active Coverage, and the new values will be updated in the theme’s table.
SPMAP Version 1.4.9
27
Recalculate Area and Perimeter
User Manual - South Platte Mapping and Analysis Program
SPMAP Version 1.4.9
28
6.0 Crop Layer Edits Pull-Down Menu
6.0 Crop Layer Edits Pull-Down Menu
The Crop Layer Edits pull-down menu allows you to assign crops to fields, split fields, merge fields,
consolidate fields into farms, and assign wells to farms.
Figure 27: Crop Layer Edits Pull-Down Menu
6.1 Convert to new SPMAP Crop Theme
You can use this option to convert a polygon theme to a theme that can be used to enter crop information
for the CU Model. This will involve adding some additional fields that are needed to run the CU Model.
1. Select the crop theme you want to convert.
2. Select the Crop Layer Edits > Convert to new SPMAP Crop Theme option.
6.2 Initialize Farm Data
This function will reset the farm IDs of each field polygon in the active theme to zero, removing any
previous association with a farm. If a farm database file (i.e. with a *.dbf extension) has been selected in the
CU Configuration dialog, all entries in the file will be deleted.
6.3 Split Crop Layer Polygons
This function allows you to split polygons by placing the active theme in edit mode and selecting the
polygon splitter tool. After the fields have been split, you can reassign crop types as described below.
6.3.1
Steps for Spitting Crop Layer Polygons
1. Select Crop Layer Edits > Split Crop Layer Polygons.
2. Using the mouse, position the cursor just outside the border of the field you are splitting and press
the left mouse button once. This positions one end of the line used to split the polygon.
SPMAP Version 1.4.9
29
Convert to new SPMAP Crop Theme
User Manual - South Platte Mapping and Analysis Program
3. Using the mouse, move the cursor to the next vertex, and so on, until a line is created.
4. Next, position the cursor outside the border of the field you are splitting. Double-click on the left
mouse button to end the line.
5. The field will now be split into two pieces. You can reassign owner names or crop types as
necessary.
Note - If you do not position the cursor outside the border of the field you are splitting, the field will
not split or it may split incorrectly. Positioning the cursor outside the border does not affect
surrounding fields.
6. Select Crop Layer Edits > Save Crop Polygon Edits when done.
Note - When using this tools do not use the editing functions from the Theme pull-down menu
because the crop layer edits functions do additional processing to the crop themes, such as
assigning a field ID number to each field.
6.3.2
Right Mouse Button Menu for Spitting Polygons
A right button mouse click will bring up a menu of options to be used when splitting polygons.
Figure 28: Menu Displayed with a Right Mouse Click
1. Delete Last Point - This option is displayed before the end point of the line is selected. It will delete
the last point specified and allow you to continue drawing the line.
2. Undo Feature Edit - This option will undo the feature edits one at a time.
3. Redo Feature Edit - This option will redo the undo option.
4. General and Interactive Snapping - These attributes can be set for the map theme you are working
on. If you have snapping (arc, node) settings for the map, you can either use the general selection
to snap to the closest vertex within a specified tolerance or you can use the interactive snapping
mode to select each snapping rule as you specify a vertex.
SPMAP Version 1.4.9
30
6.0 Crop Layer Edits Pull-Down Menu
5. Clear Selection - This option clears the last selection of a field. Additional selections can be made
with the Select tool.
6. Zoom In and Out - These options work the same as the zoom options
ArcView menu.
7. Pan - This option works the same as the pan option
in the main
in the main ArcView menu.
6.4 Merge Crop Layer Polygons
You can also merge or combine fields.
1. Using the Select tool
, choose the fields that you want to merge. You can use the shift key and
click to select multiple fields you want to merge. You can also use the selection box. If you do, you
do not need to capture the entire area of each field, but rather some portion of only the fields you
are combining.
2. The attributes of the first field in the table will be applied to the merged area. Figure 29 shows two
fields being selected.
Note - Make sure and check that the correct attributes have been applied to the merged field.
Figure 29: Selecting Polygons to Merge
3. Select Crop Layer Edits > Merge Crop Layer Polygons.
Note - The open area between the fields in Figure 29 will stay the same but the features of the two
fields will become identical.
SPMAP Version 1.4.9
31
Merge Crop Layer Polygons
User Manual - South Platte Mapping and Analysis Program
6.5 Save and Save As Crop Polygon Edits
These functions give you the option of committing changes to the crop shape file. Save Crop Polygon
Edits option with caution since it will write over your current crop theme. The Save Crop Polygon Edits
As option is selected a new name for the theme can be selected in the browse window displayed.
If the Save option is used a warning box will be displayed to make sure you want to write over your
original file, Figure 30.
.
Figure 30: Saving Polygon Edits
6.6 CU Configuration Window
Before running the CU Configuration option a crop theme should be active and saved and you should
also load a well and weather station theme.
If the crop theme has not been converted to an SPMAP crop theme, the CU Configuration window will
be displayed with grey options. Convert the crop theme to an SPMAP crop theme to fix this problem (See
Section 6.1 “Convert to new SPMAP Crop Theme”).
Figure 31: CU Configuration Window
1. Select a farm database file using the browser option to the right of the selection window. This file
can be named anything, with a *.dbf extension, and it will contain the data that is specific to the
farms.
2. When finished, select the Close button.
6.7 Field and Farm Editor Window
To open the Field and Farm Editor window select the Crop Layer Edits > CU Model Dialog option.
This window is used to specify the crop types and fields associated with a farm. The fields to be changed
can be selected with the selection tool in ArcView and the crop types or farm descriptions can be changed.
When the Update button is selected the changes will be implemented.
SPMAP Version 1.4.9
32
6.0 Crop Layer Edits Pull-Down Menu
Figure 32: Field and Farm Editor Window
6.7.1
Legend Mode
There are two types of information you can display in the view legend while using the Field and Farm
Editor dialog window:
1. Crop Type - This selection displays the information in the active view by crop type.
2. Farm Description - This mode is used to display farm descriptions in the legend fields with a farm.
6.7.2
Set selected fields to crop type
This function allows you to assign the crop type (corn, beans, etc.).
1. Make sure the theme you are editing is active and visible. Click once on the Select
tool.
2. Using the mouse, select the fields that you want to change. You do not need to be precise--just make
sure you get portions of the fields you want into the selection. The fields that you selected will be
highlighted.
3. Using the crop type pull-down field, select the new crop type.
4. Press update to associate the selected fields with the new crop type.
6.7.3
Farm Description Options
This function gives you two options. You can select fields and add them to an existing farm, or select
fields and save them as a new farm.
1. Click once on the Select
tool. Select the fields that you want to assign to a farm.
2. Select Crop Layer Edits > CU Model Dialog.
3. To organize fields into a new farm, choose the Add selected fields as new farm with description
radio button and type the farm name in the text field that appears.
4. If you choose Add selected fields to existing farm and select the existing farm from the adjacent
pull-down field.
5. Press the Update button to associate the selected fields to the farm.
SPMAP Version 1.4.9
33
Field and Farm Editor Window
User Manual - South Platte Mapping and Analysis Program
6.7.4
Add Selected Wells to Farm
This function allows you to add wells to a farm.
1. Open the well map theme. Make sure it is active. Using the select tool, select the wells that will
serve the farm.
2. Select the Add selected wells to farm button.
3. The Assign Wells to Farms window will be displayed (See Section 6.8 “Well Information”).
6.7.5
Build CU Button
This option will export all the farm data into a text file. The CU Model program, if installed, will be
started and initialized using this export file.
6.8 Well Information
This window will assign previously selected wells to farms, the wells can be selected in the Field and
Farm Editor window (See Section 6.7 “Field and Farm Editor Window”).
Figure 33: Well Information Window
1. Farm Name - Choose the farm with the wells you want to view or edit. A farm is comprised of fields
with crop types.
2. Associated Wells - This list of wells comes from the ones made during the selection in the active
view and the wells displayed will be the ones associated with the farm selected in the Farm Name
box. If extra wells were selected the Delete button can be used to delete them from the list.
3. SDF Options - There are four values that can be used for Stream Depletion Factors (SDF) for the
well selected, The values are entered in manually in the text boxes provided:
•
•
•
•
User Defined - This is an arbitrary user defined value.
Decreed Location - This value is populated from the “SDF_Form_I” attribute and was
computed using the SDF coverage.
Augmentation Plan - This is the official SDF designation from the well decree.
GPS Location - This SDF value is computed using the well’s GPS Location.
4. CU Analysis Type - The well can supply a portion of the water for the farm or it can be specified
by the acreage the well supplies. The fractions of each well should add up to 1 if this option is used.
The acreage supplied by wells does not have to total the farm acreage.
SPMAP Version 1.4.9
34
7.0 References
7.0 References
Environmental Systems Research Institute, Inc. (1996). ArcView GIS. Redlands, California.
Hurr, Theodore R. and Schneider, Paul A. 1972. Hydrogeologic characteristics of the valley-fill aquifer in
the Brighton reach of the South Platte River Valley, Colorado. Lakewood, Colorado: U.S. Geological
Survey.
Petroleum Information Corporation. (1993). PI Global Map Builder User Manual. Littleton, Colorado.
U.S. Geological Survey. 1983. Digital Cartographic Data Standards: Digital Line Graphs from 1:24,000scale maps. US GeoData, Geologic Survey Circular 895-C. United States Department of the Interior.
SPMAP Version 1.4.9
35
Well Information
User Manual - South Platte Mapping and Analysis Program
SPMAP Version 1.4.9
36
8.0 Index
8.0 Index
Numerics
D
100K PLSS Window - 25
Decreed Location - 34
Division 1 Wells Theme - 25
A
E
ABC Button - 13, 26, 27
Active Map Themes - 12
Add Themes Option - 14
ArcView GIS Version 3.2 - 3
Attribute Choices Window - 20
Augmentation Plan - 34
Edit Attributes of Active Theme - 22
Editing the Legend - 13
Extension Dialog - 3
Extension Selection Window - 4
Extensions Window - 3
B
Base Side - 25
C
Change Theme Directory - 19
Cities and Populations Theme - 9
Colorado State University - 1
Comparing Common Themes - 19
Convert TRS -> UTM - 21
County Boundaries Theme - 9
Creating a New View - 4
Crop Layer Edits - 29, 31
Crop Layer Edits > Convert to new SPMAP
Crop Theme - 29
Crop Layer Edits > CU Model Dialog
Option - 32
Crop Layer Edits Pull-Down Menu - 29
37
Entries
User Manual - South Platte Mapping and Analysis Program
F
L
Field Choices pull-down menu - 22
Fields Menu - 25
Fields Window - 25
File > Extensions - 3
File > Print Setup - 23
File > Save Project As - 5
File > Save Project Option - 5
Functions > Change Theme Directory - 19
Functions > Compare Common Themes -
Label Field Window - 13, 26, 27
Labeling Map Themes - 13
Labeling Township and Range - 26
Labeling Wells - 25
Legend Editor - 13
Legend, Rearranging - 12
Loading the South Platte Extension - 3
Locate by Legal Description - 23
Locate Dialog Window - 23
Locating an Area by Township, Baseline,
Range, and/or Section - 23
20
Functions > Convert TRS -> UTM - 21
Functions > Convert TRS to UTM - 22
Functions > Edit Attribute of Active Theme
- 22
Functions > Print PLSS Locations from
File - 27
Functions > Recalulate Area and Perimeter
of Active Coverage - 27
Functions Pull-Down Menu - 19, 23
M
Map Theme Information - 8
Map Themes - 24, 25
Map Themes > Counties - 13
Map Themes Pull-Down Menu - 7, 8, 11
Map Themes That Are Turned On - 11
Marker Palette Window - 13, 26, 27
Merge Crop Layer Polygons - 31
G
N
GPS Location - 34
H
New Button - 4
New Set - 25
New Value Choices Window - 23
Hydrography Map Theme - 10
I
Identify Results Window - 13
Image Select Tool - 16
Images Pull-Down Menu - 15
Introduction - 1
SPMAP Version 1.4.9
38
8.0 Index
P
S
PLSS (Township and Range, and Section)
Themes - 10
PLSS Theme - 26
Printing Multiple Sections - 24
Printing Sections Within the Selected
Township and Range - 27
Printing the Current View - 23
Printing Using Pre-defined Layouts - 24
Project Window - 4, 24
Save Crop Polygon Edits - 32
Saving Your Project - 5
Scale Labels - 26, 27
Select IRS 5M Satellite B & W Images - 16
Select Quads from Index - 16
Select TM 30M Satellite Images - 16
Select Tool - 31, 33
Setting the Directory for the Map
Coverages - 7
South Platte Analysis Mapping Map
Themes - 8
South Platte Extension - 3
South Platte Mapping and Analysis
Program (SPMAP) - 1
South Platte Research Project - 1
Spitting Polygons - 30
splatte.dir file - 7
Split Crop Layer Polygons - 29
Steps for Spitting Crop Layer Polygons - 29
Stream Depletion Factors (SDFs) Theme -
R
Range - 25
Recalculate Area and Perimeter - 27
References - 35
Right Mouse Button Menu - 30
11
T
Theme > Auto Label - 13, 26, 27
Theme > Query - 25
Theme > Select by Theme - 25
Theme Choices Window - 20, 21
Township - 25
Township Range Section Window - 25
U
Untitled Window - 4
Update Values Box - 25
Use Theme’s Text Label Placement
Property - 26, 27
39
Entries
User Manual - South Platte Mapping and Analysis Program
V
View > Zoom to Selected - 25
View 1 Window - 4
View 2 Window - 4
View Frame Properties Window - 24
View Legend - 25, 26
View Window - 4, 11
Views Icon - 4
W
Water District Boundaries Theme - 11
WD64 164 ft. B & W - 17
WD64 164 ft.Color - 16
Window > Show Symbol - 13, 26
SPMAP Version 1.4.9
40