1
Splunk 4.3.3
User Manual
Generated: 7/23/2012 5:00 pm
Copyright © 2012 Splunk, Inc. All Rights Reserved
Table of Contents
Welcome...............................................................................................................1
What's in this manual................................................................................1
Splunk Overview..................................................................................................2
Splunk overview........................................................................................2
Ways to access Splunk.............................................................................4
Splunk apps..............................................................................................6
Splunk Tutorial!....................................................................................................9
Welcome to the Splunk Tutorial................................................................9
Before you start the tutorial.....................................................................10
Start Splunk.............................................................................................13
Add data to Splunk..................................................................................16
The Search app.......................................................................................20
Start searching........................................................................................25
Use the timeline......................................................................................30
Change the time range............................................................................34
Use fields to search.................................................................................36
Save a search.........................................................................................43
Use Splunk's search language................................................................46
Use a subsearch.....................................................................................52
Use field lookups.....................................................................................54
More search examples............................................................................61
Reporting examples................................................................................66
Build and share a dashboard..................................................................75
Index New Data..................................................................................................82
About data and indexes..........................................................................82
Add data to your indexes........................................................................83
Search and Investigate......................................................................................85
About search...........................................................................................85
Searching in Splunk................................................................................86
Use search actions..................................................................................91
Search interactively with Splunk Web.....................................................93
Change the time range to narrow your search........................................96
Use the timeline to investigate patterns of events.................................102
Search and report in real time...............................................................105
Specify one or multiple indexes to search.............................................113
i
Table of Contents
Search and Investigate
Control index access via Splunk Web...................................................113
Search across one or more distributed search peers...........................114
About the search language...................................................................116
How subsearches work.........................................................................120
Create and use search macros.............................................................124
Add sparklines to your search results...................................................126
Capture Knowledge.........................................................................................131
About capturing knowledge...................................................................131
Use default fields...................................................................................131
Manipulate and evaluate fields with multiple values.............................139
Classify and group similar events.........................................................141
Tag and alias field values......................................................................144
Extract and add new fields....................................................................146
Extract fields with search commands....................................................148
Extract fields interactively in Splunk Web.............................................150
Use field lookups to add information to your events.............................153
Identify transactions..............................................................................160
Save searches and share search results..............................................161
Supervise your search jobs...................................................................168
Automate Monitoring.......................................................................................171
Monitor recurring situations...................................................................171
Create an alert.......................................................................................171
Set up alert actions...............................................................................195
Alert examples......................................................................................201
Review triggered alerts.........................................................................208
Analyze and Report.........................................................................................211
About reports, dashboards, and data visualizations.............................211
Use reporting commands......................................................................212
Real-time reporting................................................................................217
Visualization reference...........................................................................217
Data structure requirements for visualizations......................................236
Understand basic table and chart drilldown actions..............................240
Define reports........................................................................................248
Save reports and share them with others.............................................255
Splunk default dashboards....................................................................258
ii
Table of Contents
Analyze and Report
Create and edit simple dashboards......................................................262
Edit dashboard panel visualizations......................................................274
Schedule delivery of dashboard PDF printouts via email......................286
Search Examples and Walkthroughs.............................................................288
What's in this chapter............................................................................288
Reporting: Build a chart of multiple data series.....................................288
Reporting: Compare hourly sums between multiple days.....................290
Monitor and alert on Windows disk usage............................................291
iii
Welcome
What's in this manual
In this manual, you'll find information and procedures for the Splunk enterprise
user—if you use Splunk to investigate problems and report on results, this is the
manual for you.
Where to start?
If you're new to Splunk, check out the overview and then proceed to the Splunk
tutorial! It guides you through adding data, searching your data, and building
simple reports and dashboards. Let us know what you think!
Continue reading to:
• learn how to add data to your indexes
• start searching with terms, Boolean expressions, and fields
• learn how to use the search results and timeline to interactively narrow
your search
• learn how to save event types, extract new fields, and tag field values
• learn how to save searches and set alert conditions for scheduled
searches
• start building reports and charts to save and share with others
If you want to just jump right in and start searching, see the Search command
cheat sheet for a quick reference complete with descriptions and examples.
Make a PDF
If you'd like a PDF version of this manual, click the red Download the User
Manual as PDF link below the table of contents on the left side of this page. A
PDF version of the manual is generated on the fly for you, and you can save it or
print it out to read later.
1
Splunk Overview
Splunk overview
Splunk is powerful and versatile IT search software that takes the pain out of
tracking and utilizing the information in your data center. If you have Splunk, you
won't need complicated databases, connectors, custom parsers or controls--all
that's required is a web browser and your imagination. Splunk handles the rest.
Use Splunk to:
• Continually index all of your IT data in real time.
• Automatically discover useful information embedded in your data, so you
don't have to identify it yourself.
• Search your physical and virtual IT infrastructure for literally anything of
interest and get results in seconds.
• Save searches and tag useful information, to make your system smarter.
• Set up alerts to automate the monitoring of your system for specific
recurring events.
• Generate analytical reports with interactive charts, graphs, and tables and
share them with others.
• Share saved searches and reports with fellow Splunk users, and distribute
their results to team members and project stakeholders via email.
• Proactively review your IT systems to head off server downtimes and
security incidents before they arise.
• Design specialized, information-rich views and dashboards that fit the
wide-ranging needs of your enterprise.
Index new data
Splunk offers a variety of flexible data input methods to index everything in your
IT infrastructure in real time, including live log files, configurations, traps and
alerts, messages, scripts, performance data, and statistics from all of your
applications, servers, and network devices. Monitor file systems for script and
configuration changes. Enable change monitoring on your file system or
Windows registry. Capture archive files and SNMP trap data. Find and tail live
application server stack traces and database audit tables. Connect to network
ports to receive syslog and other network-based instrumentation.
No matter how you get the data, or what format it's in, Splunk indexes it the same
way--without any specific parsers or adapters to write or maintain. It stores both
2
the raw data and the rich index in an efficient, compressed, filesystem-based
datastore--with optional data signing and auditing if you need to prove data
integrity.
For more details on data indexing with Splunk, see the "Index new data" chapter
in this manual.
Search and investigate
Now you've got all that data in your system...what do you want to do with it? Start
by using Splunk's powerful search functionality to look for anything, not just a
handful of predetermined fields. Combine time and term searches. Find errors
across every tier of your IT infrastructure and track down configuration changes
in the seconds before a system failure occurs. Splunk identifies fields from your
records as you search, providing flexibility unparalleled by solutions that require
setup of rigid field mapping rulesets ahead of time. Even if your system contains
terrabytes of data, Splunk enables you to search across it with precision.
To get the full picture of Splunk's IT search capability, see the "Search and
investigate" chapter in this manual.
Capture knowledge
Freeform searching on raw data is just the start. Enrich that data and improve the
focus of your searches by adding your own knowledge about fields, events, and
transactions. Tag high-priority assets, and annotate events according to their
business function or audit requirement. Give a set of related server errors a
single tag, and then devise searches that use that tag to isolate and report on
events involving that set of errors. Save and share frequently-run searches.
Splunk surpasses traditional approaches to log management by mapping
knowledge to data at search time, rather than normalizing the data up front. It
enables you to share searches, reports, and dashboards across the range of
Splunk apps being used in your organization.
To get more details on capturing and utilizing knowledge with event types and
fields, see the "Capture knowledge" chapter in this manual.
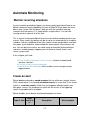
Automate monitoring
Any search can be run on a schedule, and scheduled searches can be set up to
trigger notifications or when specific conditions occur. This automated alerting
functionality works across the wide range of components and technologies
3
throughout your IT infrastructure--from applications to firewalls to access
controls. Have Splunk send notifications via email or SNMP to other
management consoles. Arrange for alerting actions to trigger scripts that perform
activities such as restarting an application, server, or network device, or opening
a trouble ticket. Set up alerts for known bad events and use sophisticated
correlation via search to find known risk patterns such as brute force attacks,
data leakage, and even application-level fraud.
For more information about monitoring recurring events, see the "Automate
monitoring" chapter in this manual.
Analyze and report
Splunk's ability to quickly analyze massive amounts of data enables you to
summarize any set of search results in the form of interactive charts, graphs, and
tables. Generate reports on-the-fly that use statistical commands to trend metrics
over time, compare top values, and report on the most and least frequent types
of conditions. Visualize report results as interactive line, bar, column, pie,
scatterplot and heat-map charts.
Splunk offers a variety of ways to share reports with team members and project
stakeholders. You can schedule reports to run at regular intervals and have
Splunk send each report to interested parties via email, print reports, save them
to community collections of commonly-run reports, and add reports to specialized
dashboards for quick reference.
For more information about defining reports, generating charts, and sharing them
with others, see the "Analyze and report" chapter in this manual.
Ways to access Splunk
This topic discusses the different ways in which you can connect to and use
Splunk.
Splunk Web
Splunk Web is Splunk's dynamic and interactive graphical user interface.
Accessed via a Web browser, Splunk Web is the primary interface used to
search and investigate, report on results, and manage one or more Splunk
deployment. For our list of supported operating systems and browsers, see the
"System requirements" in the Installation manual.
4
Launch Splunk Web in a browser
After you install and start Splunk, launch a Web browser and navigate to:
http://mysplunkhost:8000
Use whatever host and HTTP port you chose during installation. The HTTP port
defaults to 8000 if not otherwise specified.
The first time you log in to Splunk with an Enterprise license, use username
admin and password changeme. Splunk with a free license does not have access
controls.
Note: Starting in Splunk version 4.1.4, you cannot access Splunk Free from a
remote browser until you have edited $SPLUNK_HOME/etc/local/server.conf and
set allowRemoteLogin to Always. If you are running Splunk Enterprise, remote
login is disabled by default (set to requireSetPassword) for the admin user until
you have changed the default password.
Splunk apps in Splunk Web
When you first launch Splunk Web, you're looking at an app. For most users, this
will be the core Search app. Others may see platform-specific apps, with
dashboards and views for use with the OS. When you're using Splunk, you're
using an app at all times; the dashboards and views available to you depend on
the app you're currently using. For more information about Splunk and apps, see
the "Splunk apps" topic in this chapter.
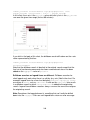
Splunk management pages
Whatever app you're in when you launch Splunk, you'll see at least two links in
the upper right corner of the screen: Manager and Jobs.
The Manager link takes you to configuration and management pages for your
Splunk system and apps. For more information about Splunk Manager, see
[coming soon!].
The Jobs link opens the Job Manager window, which allows you to manage all
search jobs, both completed and currently running. For more information about
job management, see "Supervise your search jobs" in the Capture Knowledge
chapter of this manual.
5
Splunk CLI
Splunk users can perform much of the core Splunk tasks directly from a
commandline interface (CLI). These tasks include: managing inputs and indexes,
searching, saving and scheduling searches as alerts, and exporting search
results. If you don't have access to the CLI, you should communicate with your
Splunk admin. For more information, see "About the CLI" in the Admin manual.
Splunk apps
When you use Splunk, you're experiencing it in the context of one or more apps.
Each Splunk app is a collection of dashboards and views. Some of them are
designed specifically to help you manage data in specific OS platforms or
address particular business objectives.
At all times, when you're using Splunk, you're using a Splunk app. We refer
to this as being "in" an app.
For more detailed information about Splunk and apps, see "What's an app?" in
the Admin Manual.
Splunk Home and the Getting Started app
Unless your Splunk administrator has configured your Splunk deployment
differently, the first time you install and log into Splunk, you'll see the Welcome to
Splunk screen. Click on the green Splunk Home tab. Splunk Home shows you
the list of apps that have been preinstalled for you and that you have permissions
to see. By default, one of these apps is the Getting Started app. This app has
been developed to introduce new users to Splunk's features. If you're new to
Splunk, we recommend you check it out and give us your feedback!
6
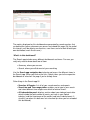
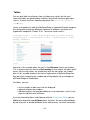
What else you get by default
Splunk also comes with the Search app and another app to support your OS by
default.
• The Search app provides an interface that provides the core functionality
of Splunk and is designed for general-purpose use. If you've used Splunk
before, the Search app replaces the main Splunk Web functionality from
earlier versions. In the Search app you see a search bar and a dashboard
full of graphs. When you are in the Search app, you change the
dashboard or view by selecting new ones from the Views drop-down
menu in the upper left of the window.
• The Deployment Monitor app is disabled by default. Enable it to gain
visibility into the performance of your Splunk instance.
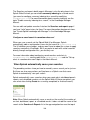
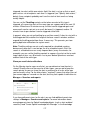
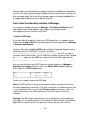
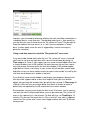
If you want to change the app you're in, select a new one from the app
drop-down menu at the top right:
You can also return to Splunk Home and select another app from there.
Get more apps
You can add other apps to the list of apps in Splunk Home or in the Apps menu.
7
For example, if the bulk of your data operations work involves tasks related to
things like security, change management or PCI (Payment Card Industry)
compliance, you'll be happy to know that Splunk has apps that specialize in
helping you with them.
To find more apps to download, click the Find More Apps button on the right in
Splunk Home.
Build apps to fit your needs
Splunk provides all the tools you need to create apps that answer the unique
data management needs faced by your organization. You can design apps that
have specialized dashboards and views and make them as simple or as
sophisticated as you wish.
For more information about the nuts and bolts of Splunk app design and
development, see the "Apps and add-ons: An introduction" in the Developing
Dashboards, Views, and Apps for Splunk Web manual.
8
Splunk Tutorial!
Welcome to the Splunk Tutorial
What is Splunk?
Splunk is software that indexes IT data from any application, server or network
device that makes up your IT infrastructure. It's a powerful and versatile search
and analysis engine that lets you investigate, troubleshoot, monitor, alert, and
report on everything that's happening in your entire IT infrastructure from one
location in real time.
Want to learn more about all the kinds of data Splunk can index? Read "What is
IT data?" on our website.
Who uses Splunk?
Splunk is versatile and thus has many uses and many different types of users.
System administrators, network engineers, security analysts, developers, service
desk, and support staff -- even Managers, VPs, and CIOs -- use Splunk to do
their jobs better and faster.
• Application support staff use Splunk for end-to-end investigation and
remediation across the application environment and to create alerts and
dashboards that proactively monitor performance, availability, and
business metrics across an entire service. They use roles to segregate
data access along lines of duties and give application developers and Tier
One support access to the information they need from production logs
without compromising security.
• System administrators and IT staff use Splunk to investigate server
problems, understand their configurations, and monitor user activity. Then,
they turn the searches into proactive alerts for performance thresholds,
critical system errors, and load.
• Senior network engineers use Splunk to troubleshoot escalated problems,
identify events and patterns that are indicators of routine problems, such
as misconfigured routers and neighbor changes, and turn searches for
these events into proactive alerts.
• Security analysts and incident response teams use Splunk to investigate
activity for flagged users and access to sensitive data, automatically
monitor for known bad events, and use sophisticated correlation via
search to find known risk patterns such as brute force attacks, data
9
leakage, and even application-level fraud.
• Managers in all solution areas use Splunk to build reports and dashboards
to monitor and summarize the health, performance, activity, and capacity
of their IT infrastructure and businesses.
What's in this tutorial?
If you're new to Splunk, this tutorial will teach you what you need to know to start
using Splunk, from a first-time download to creating rich, interactive dashboards.
Before you start the tutorial
Before you can begin to use Splunk, you need to download, install, and start up a
Splunk instance. Hey, no worries -- this only takes about 5 minutes!
If you already have access to a running Splunk server, skip down to Add data to
Splunk and start there.
Do you have what it takes to run Splunk?
Splunk runs on most computing platforms, but this tutorial will focus specifically
on the Windows and Mac OS X versions of Splunk. Of course, whatever platform
you choose to run it on, it's still Splunk, and you should be able to follow along
from Start Splunk onwards.
While Splunk is software that you install on your local machine, you access
Splunk through a Web browser. Splunk supports most versions of Firefox,
Internet Explorer, and Safari.
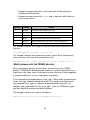
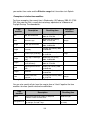
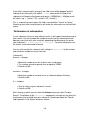
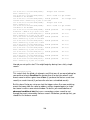
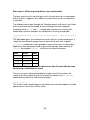
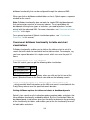
Splunk is a high-performance application, but for this tutorial, you really only
need an individual Windows or Mac machine that meets at least the following
specifications:
Platform
Minimum supported hardware capacity
Non-Windows platforms 1x1.4 GHz CPU, 1 GB RAM
Windows platforms
Pentium 4 or equivalent at 2Ghz, 2GB RAM
For the complete list of specifications, see the system requirements in the
Installation manual.
10
Which license is for you?
Splunk runs with either an Enterprise license or a Free license. When you
download Splunk for the first time, you get an Enterprise trial license that expires
after 60 days. This trial license enables 500 MB/day indexing and all of the
Enterprise features.
Once you install Splunk, you can run with the Enterprise trial license until it
expires, switch to the perpetual Free license (it's included!), or purchase an
Enterprise license.
Read more about Splunk licenses and features.
Download Splunk
The Windows installer is an MSI file. There are two Mac OS X installers; for this
tutorial, you'll use the DMG package.
Download the latest version of Splunk from the download page.
Log into Splunk.com to download Splunk. If you're not logged on, clicking the
download package will redirect you to a registration form. If you don't already
have a Splunk.com account, sign up for one.
Install Splunk
Splunk provides graphical installers for the Windows and Mac OS X platforms,
though you can also install using the command line interface, or CLI.
For command line instructions and installations on other platforms, see the
detailed installation procedures in the Installation manual.
Windows
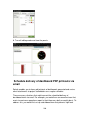
1. To start the installer, double-click the splunk.msi file.
2. In the Welcome panel, click Next.
3. Read the licensing agreement and check the box next to "I accept the terms in
the license agreement". Click Next to continue installing.
4. In the Customer Information, enter the requested details and click Next.
11
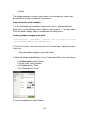
5. In the Destination Folder panel, click Change... to specify a different location
to install Splunk, or click Next to accept the default value.
Splunk is installed by default into the \Program Files\Splunk directory.
The Logon Information panel is displayed.
6. In the Logon Information panel, select Local system user and click Next.
If you want to learn about the other user option, refer to the detailed instructions
for installing Splunk on Windows.
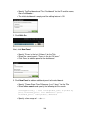
7. After you specify a user, the pre-installation summary panel is displayed. Click
Install to proceed.
8. In the Installation Complete panel, check the boxes to Launch browser with
Splunk and Create Start Menu Shortcut now.
9. Click Finish.
The installation completes, Splunk starts, and Splunk Web launches in a
supported browser.
Mac OS X
1. Double-click on the DMG file.
2. In the Finder window, double-click on splunk.pkg.
The Splunk installer opens and displays the Introduction.
3. Click Continue.
4. In the Select a Destination window, choose a location to install Splunk.
• To install in the default directory, /Applications/splunk, click on the
harddrive icon.
• To select a different location, click Choose Folder...
5. Click Continue.
The pre-installation summary displays. If you need to make changes,
12
• Click Change Install Location to choose a new folder, or
• Click Back to go back a step.
6. Click Install.
The installation will begin. It may take a few minutes.
7. When your install completes, click Finish.
The installation completes, and now you're ready to start Splunk.
Start Splunk
When you start Splunk, you're starting up two processes on your host, splunkd
and splunkweb:
• splunkd is a distributed C/C++ server that accesses, processes and
indexes streaming IT data and handles search requests.
• splunkweb is a Python-based application server that provides the Splunk
Web interface that you use to search and navigate your IT data and
manage your Splunk deployment.
Windows
To start Splunk on Windows, you have three options:
• start Splunk from the Start menu.
• use the Windows Services Manager to start and stop splunkd and
splunkweb.
• open a cmd window and go to \Program Files\Splunk\bin and type
> splunk start
Mac OS X
Open a terminal or shell to access the CLI. Go to /Applications/splunk/bin/,
and type:
$ ./splunk start
If you have administrator or root privileges you can simplify CLI usage by setting
a Splunk environment variable. For more information about how to do this, read
13
"About the CLI" in the Admin manual.
Accept the Splunk license
After you run the start command, Splunk displays the license agreement and
prompts you to accept the license before the startup continues.
After you accept the license, the startup sequence displays. At the very end,
Splunk tells you where to access Splunk Web:
The Splunk Web interface is at http://localhost:8000
If you run into any problems starting up Splunk, see Start Splunk for the first time
in the Installation manual.
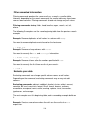
Other commands you might need
If you need to stop, restart, or check the status of your Splunk server, use these
CLI commands:
$ splunk stop
$ splunk restart
$ splunk status
Launch Splunk Web
Splunk's interface runs as a Web server and after starting up, Splunk tells you
where the Splunk Web interface is. Open a browser and navigate to that location.
Splunk Web runs by default on port 8000 of the host on which it's installed. If you
are using Splunk on your local machine, the URL to access Splunk Web is
http://localhost:8000.
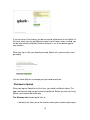
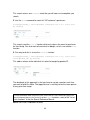
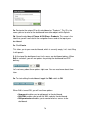
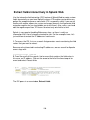
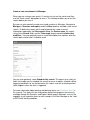
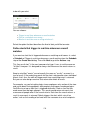
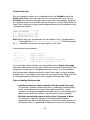
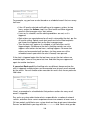
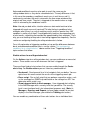
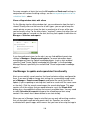
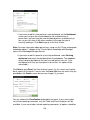
If you are using an Enterprise license, launching Splunk for the first time takes
you to this login screen. Follow the message to authenticate with the default
credentials:
14
If you are using a Free license, you do not need to authenticate to use Splunk. In
this case, when you start up Splunk you won't see this login screen. Instead, you
will be taken directly to Splunk Home or whatever is set as the default app for
your account.
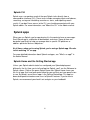
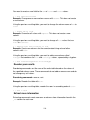
When you sign in with your default password, Splunk asks you to create a new
password.
You can either Skip this or change your password to continue.
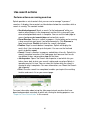
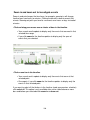
Welcome to Splunk
When you log into Splunk for the first time, you should see Splunk Home. This
app is designed to help you get started using Splunk. Before you can start using
Splunk, you need to add some data.
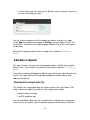
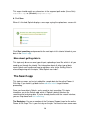
The Welcome tab includes quick links to:
• Add data: this takes you to the interface where you can define data inputs.
15
• Launch search app: this takes you to Splunk's search interface, where you
can start searching your data.
Use the system navigation bar at the upper right corner to access any apps
(under App) and configuration pages (in Manager) for your Splunk server. This
system bar is available in every Splunk page, though not all of the same options
will be there.
When you're ready, proceed to the next topic in this tutorial to Add data to
Splunk.
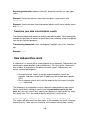
Add data to Splunk
This topic assumes that you have already downloaded, installed, and started a
Splunk server. If you haven't yet, go back to the previous topic for instructions to
do that.
Once you've started and logged into Splunk, you need to give it data that you can
search. This topic walks you through downloading the sample dataset and
adding it into Splunk.
Download the sample data file
This tutorial uses sample data from an fictitious online store, the Flower & Gift
shop, to teach you about using Splunk. The sample data includes:
• Apache web server logs
• mySQL database logs
You can feed Splunk data from files and directories, network ports, and custom
scripts, but for this tutorial, you will upload a compressed file directly to Splunk.
16
Also, this tutorial is designed to be completed in a matter of hours. But, if you
want to spread it out over a few days, just download a new sample data file and
add it!
To proceed with this tutorial, download (but do not uncompress) the sample
data from here: sampledata.zip This sample data file is updated daily.
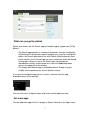
Get the sample data into Splunk
Logging into Splunk should have taken you to Splunk Home. If it isn't the first
view that you see, use the App list to select Home.
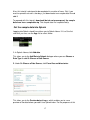
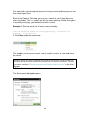
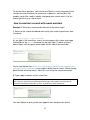
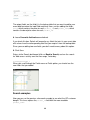
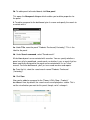
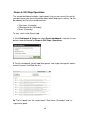
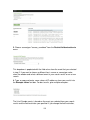
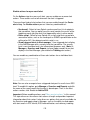
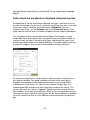
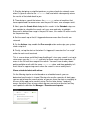
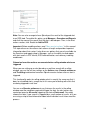
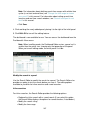
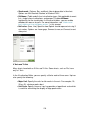
1. In Splunk Home, click Add data.
This takes you to the Add Data to Splunk dialogue where you can Choose a
Data Type to add Or Choose a Data Source.
2. Under Or Choose a Data Source, click From files and directories.
This takes you to the Preview data dialogue, which enables you to see a
preview of the data before you add it to a Splunk index. For the purposes of this
17
tutorial, you won't need to do this. If you're interested in reading more about data
preview, refer to "Overview of data preview" in the Getting Data In manual.
3. Select Skip preview and click Continue.
This takes you to the Home > Add data > Files & directories > Add new view.
This is where you will upload the sample data file. Normally, this is all you need
to do and Splunk handles the rest without any changes needed. For the
purposes of this tutorial, however, you will also edit some of the properties.
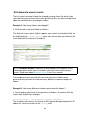
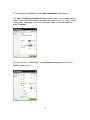
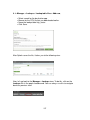
4. Under Source, select Upload and index a file and browse for the sample
data file that you just downloaded.
The source of an event tells you where it came from. If you collect data from files
and directories, the "source" is the full pathname of the file or directory. In the
case of a network-based source, the source is the protocol and port, such as
UDP:514.
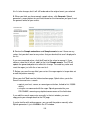
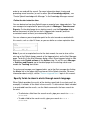
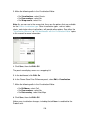
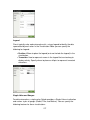
5. Select More settings.
This enables you to override Splunk's default settings for Host, Source type, and
Index. For this tutorial, you're just going to change the Host settings.
18
What about the Source type and Index settings?
The source type of an event tells you what kind of data it is, usually based on
how it's formatted. Examples of source types are access_combined or
cisco_syslog. This classification lets you search for the same type of data
across multiple sources and hosts. For more information about how Splunk
source types your data, read "Why source types matter" in the Getting Data In
manual.
The index setting tells Splunk where to put the data. By default, it's stored in
main, but you might want to consider partitioning your data into different
indexes if you have many types. For more information about creating custom
indexes, read "Set up multiple indexes" in the Admin manual.
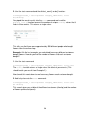
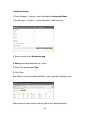
6. Under Host and Set host, choose regex on path.
An event's host value is typically the hostname, IP address, or fully qualified
domain name of the network host from which the event originated. If you take a
look at the Sampledata.zip file, it contains four directories (folders): three of the
folders are named for Apache web servers and one is a MySQL server. You want
to set the host value to the names of these folders.
By selecting regex on path, you're telling Splunk to use a regular expression
(regex) to match the segment of the path within the compressed file that you
want to set as your host value.
7. Under Regular expression, copy and paste:
For Linux\Unix:
Sampledata\.zip:./([^/]+)/
For Windows:
Sampledata\.zip:.\\([^\\]+)\\
19
This regex should match any characters in the segment path under (Linux/Unix)
Sampledata.zip/ or (Windows) Sampledata.zip\ .
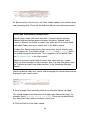
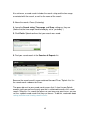
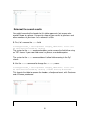
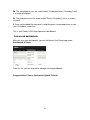
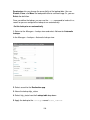
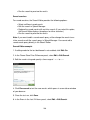
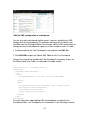
8. Click Save.
When it's finished, Splunk displays a message saying the upload was successful.
Click Start searching and proceed to the next topic in this tutorial to look at your
data in the Search app.
More about getting data in
This topic only discusses one type of input, uploading a local file, which is all you
need to run through the tutorial. For information about all other type of data
inputs Splunk can handle and how to add them, refer to the Getting Data In
manual beginning with the topic, "What Splunk can index".
The Search app
This topic assumes you've just added the sample data for the online Flower &
Gift shop. If you haven't, go back to the add data tutorial to get it before
proceeding.
Once you have data in Splunk, you're ready to start searching. This topic
introduces you to the Search app, which is Splunk's default interface for
searching and analyzing data. If you're already familiar with the search interface,
you can skip ahead and start searching.
The Backstory: You are a member of the Customer Support team for the online
Flower & Gift shop. This is your first day on the job. You want to learn some more
20
about the shop. Some questions you want answered are:
• What does the store sell? How much does each item cost?
• How many people visited the site? How many bought something today?
• What is the most popular item that is purchased each day?
The Splunk server already has data in it--let's take a look at it.
Find the Search app
You can access the Search app from anywhere in Splunk from the App list in the
system navigation bar located at the upper right corner.
If the App list is not available, click the << Back to Home link at the top left
corner of the page:
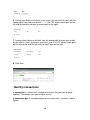
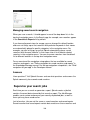
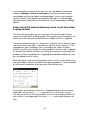
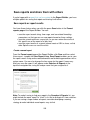
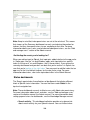
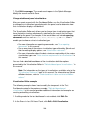
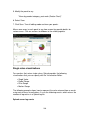
Once you're back in Home, select Search from the App list. The first view that
you see in the Search app is the Summary dashboard.
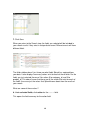
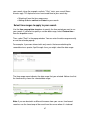
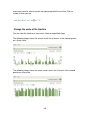
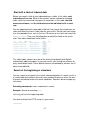
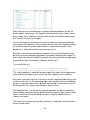
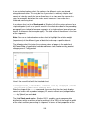
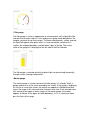
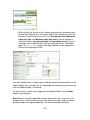
The Summary dashboard
The Search app's Summary dashboard displays information about the data that
you just uploaded to this Splunk server and gives you the means to start
searching this data.
21
The metrics displayed on this dashboard are generated by saved searches that
run behind-the-scenes whenever you access and reload this page. (By the end of
this tutorial, you'll be able to run searches, save them, and use them to build your
own dashboard, much like this one.)
What's in this dashboard?
The Search app includes many different dashboards and views. For now, you
really only need to know about two of them:
• Summary, where you are now
• Search, where you will do most of your searching
Use the Search app navigation bar to locate and access the different views in
the Search app. When you click on the links, Splunk takes you to the respective
dashboards or refreshes the page if you're already there.
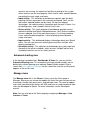
Other things in the Search app UI:
• Searches & Reports: lists all of your saved searches and reports.
• Search bar and Time range picker: enables you to type in your search
and select different time ranges over which to retrieve events.
• All indexed data panel: displays metrics about your indexed event data.
which include the total number of events you have in your Splunk
index(es) and the timestamps of the earliest and latest indexed event. It
also tells you when this data was last refreshed (or when you last reloaded
this dashboard).
22
• Sources panel: displays the top sources from the data on your Splunk
server.
• Sourcetypes panel: displays the top source types from your Splunk
server's data.
• Hosts: displays the top hosts from your Splunk server's data.
If you're using a freshly installed Splunk server for this tutorial, you'll only see the
sample data files that you just uploaded. Because it's a one-time upload of a file,
this data will not change. When you add more data, there will be more
information on this dashboard. If you add data inputs that point to sources that
are not static (such as log files that are being written to by applications), the
numbers on the Summary page will change as more data comes in from your
source(s).
If you're using a shared or pre-installed Splunk server that is deployed in an
enterprise environment, you'll probably see much more information on this
dashboard.
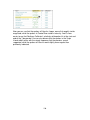
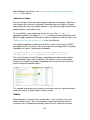
Kick off a search
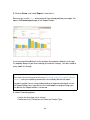
1. Take a closer look at the Summary dashboard.
In the Sources panel, you should see three Apache Web server logs and a
mySQL database log for the online Flower & Gift shop data that you just
uploaded. If you're familiar with Apache Web server logs, you might recognize
the access_combined_wcookie Source type as one of the log formats
associated with Web access logs. All the data for this source type should give
you information about people who access the Flower & Gift shop website.
Searching in Splunk is very interactive. Although you have a search bar in the
Summary dashboard, you don't need to type anything into it just yet. Each of the
sources, sourcetypes, and hosts listed in the Summary dashboard is a link that
will kick off a search when you click on them.
23
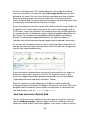
2. In the Sourcetypes panel, click access_combined_wcookie.
Splunk takes you to the Search dashboard, where it runs the search and shows
you the results:
There are a lot of components to this view, so let's take a look at them before
continuing to search.
Splunk paused my search?
If you are searching on a Splunk installation that has more data on it than just
this tutorial's sample data, your search might take a bit longer. If your search
takes longer than 30 seconds, Splunk will automatically pause it. If autopause
pops up, click Resume search. You can read more about autopause in the
Admin manual.
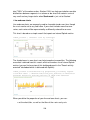
What's in this Search dashboard?
The search bar and time range picker should be familiar to you -- it was also in
the Summary dashboard. But, now you also see a count of events, the timeline,
the fields menu, and the list of retrieved events or search results.
• Search actions: Use these buttons to save a search, create a report or
dashboard, or print your report to a PDF file.
• Count of matching and scanned events: As the search runs, Splunk
displays two running counts of the events as it retrieves them: one is a
matching event count and the other is the count of events scanned. When
the search completes, the count that appears above the timeline displays
the total number of matching events. The count that appears below the
timeline and above the events list, tells you the number of events during
24
the time range that you selected. As we'll see later, this number changes
when you drill down into your investigations.
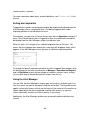
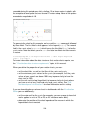
• Timeline of events: The timeline is a visual representation of the number
of events that occur at each point in time. As the timeline updates with
your search results, you might notice clusters or patterns of bars. The
height of each bar indicates the count of events. Peaks or valleys in the
timeline can indicate spikes in activity or server downtime. Thus, the
timeline is useful for highlighting patterns of events or investigating peaks
and lows in event activity. The timeline options are located above the
timeline. You can zoom in, zoom out, and change the scale of the chart.
• Fields sidebar: We mentioned before that when you index data, Splunk
by default automatically recognizes and extracts information from your
data that is formatted as name and value pairs, which we call fields. When
you run a search, Splunk lists all of the fields it recognizes in the fields
sidebar next to your search results. You can select other fields to show in
your events.
♦ selected fields are fields that are set to be visible in your search
results. By default, host, source, and sourcetype are shown.
♦ interesting fields are other fields that Splunk has extracted from
your search results.
♦ Field discovery is an on/off switch at the top of the Fields menu.
Splunk turns Field discovery on by default. If you want to speed up
your search, you can turn Field discovery off, and Splunk will
extract only the fields required to complete your search.
• Results area: The results area, located below the timeline, displays the
events that Splunk retrieves to match your search. By default the results
are displayed as a list, but you can also choose to view a table or chart in
the area.
When you're ready, proceed to the next topic to start searching and find out
what's up at the flower shop.
Start searching
This topic walks you through simple searches using the Search interface. If
you're not familiar with the search interface, go back to the Search app tutorial
before proceeding.
It's your first day of work with the Customer Support team for the online Flower &
Gift shop. You're just starting to dig into the Web access logs for the shop, when
you receive a call from a customer who complains about trouble buying a gift for
his girlfriend--he keeps hitting a server error when he tries to complete a
25
purchase. He gives you his IP address, 10.2.1.44.
Typeahead for keywords
Everything in Splunk is searchable. You don't have to be familiar with the
information in your data because searching in Splunk is free-form and as simple
as typing keywords into the search bar and hitting Enter (or clicking that green
arrow at the end of the search bar).
In the previous topic, you ran a search from the Summary dashboard by clicking
on the Web access source type (access_combined_wcookie). Use that same
search to find this customer's recent access history at the online Flower & Gift
shop.
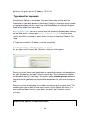
1. Type the customer's IP address into the search bar:
sourcetype=access_combined_wcookie 10.2.1.44
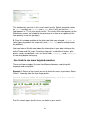
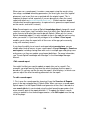
As you type into the search bar, Splunk's search assistant opens.
Search assistant shows you typeahead, or contextual matches and completions
for each keyword as you type it into the search bar. These contextual matches
are based on what's in your data. The entries under matching terms update as
you continue to type because the possible completions for your term change as
well.
Search assistant also displays the number of matches for the search term. This
number gives you an idea of how many search results Splunk will return. If a
term or phrase doesn't exist in your data, you won't see it listed in search
assistant.
What else do you see in search assistant?
26
For now, ignore everything on the right panel next to the contextual help.
Search assistant has more uses once you start learning the search language,
as you'll see later. And, if you don't want search assistant to open, click "turn
off auto-open" and close the window using the green arrow below the search
bar.
More keyword searches
2. If you didn't already, run the search for the IP address. (Hit Enter.)
Splunk retrieves the customer's access history for the online Flower & Gift shop.
Each time you run a search, Splunk highlights in the search results what you
typed into the search bar.
3. Skim through the search results.
You should recognize words and phrases in the events that relate to the online
shop (flower, product, purchase, etc.).
The customer mentioned that he was in the middle of purchasing a gift, so let's
see what we find by searching for "purchase".
4. Type purchase into the search bar and run the search:
sourcetype=access_combined_wcookie 10.2.1.44 purchase
When you search for keywords, your search is not case-sensitive and Splunk
retrieves the events that contain those keywords anywhere in the raw text of the
event's data.
27
Among the results that Splunk retrieves are events that show each time the
customer tried to buy something from the online store. Looks like he's been busy!
Use Boolean operators
If you're familiar with Apache server logs, in this case the access_combined
format, you'll notice that most of these events have an HTTP status of 200, or
Successful. These events are not interesting for you right now, because the
customer is reporting a problem.
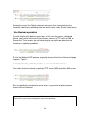
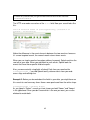
5. Use the Boolean NOT operator to quickly remove all of these Successful page
requests. Type in:
sourcetype=access_combined_wcookie 10.2.1.44 purchase NOT 200
You notice that the customer is getting HTTP server (503) and client (404) errors.
But, he specifically mentioned a server error, so you want to quickly remove
events that are irrelevant.
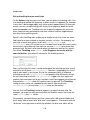
Splunk supports the Boolean operators: AND, OR, and NOT. When you include Boolean
expressions in your search, the operators have to be capitalized.
28
The AND operator is always implied between search terms. So the search in
Step 5 is the same as:
sourcetype=access_combined_wcookie AND 10.2.1.44 AND purchase AND NOT
200
Another way to add Boolean clauses quickly and interactively to your search is to
use your search results.
6. Mouse-over an instance of "404" in your search results and alt-click.
This updates your search string with "NOT 404" and filters out all the events that
contain the term.
From these results, you see each time that the customer attempted to complete a
purchase and received the server error. Now that you have confirmed what the
customer reported, you can continue to drill down to find the root cause.
More about searching for keywords and phrases
When you run a search, you're implicitly using the search command. The search
command enables you to use keywords, phrases, fields, boolean expressions,
and comparison expressions to specify exactly which events you want to retrieve
from a Splunk index(es).
To search with comparison expressions:
• You can use the "=" and "!=" operator with all field/value pairs.
• Other comparison operators, ("<", "<=", ">", and ">=") work only with fields
29
that have numeric values.
Also, when specifying phrases to match, you can use the TERM() directive.
TERM forces Splunk to match whatever is inside the parentheses as a single
term in the index, even if it contains characters that are usually recognized as
breaks or delimiters (such as underscores and spaces). Read more about this in
the search command reference topic.
Interactive searching
Splunk lets you highlight and select any segment from within your search results
to add, remove, and exclude them quickly and interactively using your keyboard
and mouse:
• To add more search terms, highlight and click the word or phrase you
want from your search results.
• To remove a term from your search, click a highlighted instance of that
word or phrase in your search results.
• To exclude events from your search results, alt-click on the term you don't
want Splunk to match.
When you're ready to proceed, go to the next topic to learn how to investigate
and troubleshoot interactively using the timeline in Splunk.
Use the timeline
This topic assumes that you're comfortable running simple searches to retrieve
events. If you're not sure, go back to the last topic where you searched with
keywords, wildcards, and Booleans to pinpoint an error.
Back at the Flower & Gift shop, let's continue with the customer (10.2.1.44) you
were assisting. He reported an error while purchasing a gift for his girlfriend. You
confirmed his error, and now you want to find the cause of it.
Continue with the last search, which showed you the customer's failed purchase
attempts.
1. Search for:
30
sourcetype=access_combined_wcookie 10.2.1.44 purchase NOT 200 NOT 404
In the last topic, you really just focused on the search results listed in the events
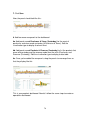
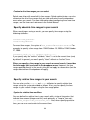
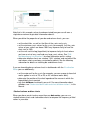
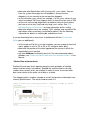
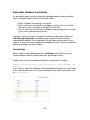
viewer area of this dashboard. Now, let's take a look at the timeline.
The location of each bar on the timeline corresponds to an instance when the
events that match your search occurred. If there are no bars at a time period, no
events were found then.
2. Mouse over one of the bars.
A tooltip pops up and displays the number of events that Splunk found during the
time span of that bar (1 bar = 1 hr).
The taller the bar, the more events occurred at that time. Often seeing spikes in
the number of events or no events is a good indication that something has
happened.
3. Click one of the bars, for example the tallest bar.
This updates your search results to show you only the events at the time span.
Splunk does not run the search when you click on the bar. Instead, it gives you a
preview of the results zoomed-in at the time range. You can still select other bars
at this point.
31
4. Double-click on the same bar.
Splunk runs the search again and retrieves only events during that one hour
span you selected.
You should see the same search results in the Event viewer, but, notice that the
search overrides the time range picker and it now shows "Custom time". (You'll
see more of the time range picker later.) Also, each bar now represents one
minute of time (1 bar = 1 min).
One hour is still a wide time period to search, so let's narrow the search down
more.
5. Double-click another bar.
Once again, this updates your search to now retrieve events during that one
minute span of time. Each bar represents the number of events for one second of
time.
32
Now, you want to expand your search to see everything else, if anything
happened during this minute.
6. Without changing the time range, replace your previous search in the search
bar with:
*
Splunk supports using the asterisk (*) wildcard to search for "all" or to retrieve
events based on parts of a keyword. Up to now, you've just searched for Web
access logs. This search tells Splunk that you want to see everything that
occurred at this time range:
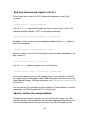
This search returns events from all the logs on your server. You expect to see
other user's Web activity--perhaps from different hosts. But instead you see a
cluster of mySQL database errors. These errors were causing your customer's
purchases to fail. Now, you can report this issue to someone in the IT Operations
team.
What else can you do with the timeline?
• To show all the results for the timeline again, click select all above the
timeline.
• To lock-in the selected span of events to your search, click zoom in.
• To expand the timeline view to show more events, click zoom out.
When you're ready, proceed to the next topic to learn about searching over
different time ranges.
33
Change the time range
This topic assumes that you're familiar with running ad hoc searches and using
the timeline. If you're not sure, review the previous topics on searching and using
the timeline.
This topic shows you how to narrow the scope of your investigative searching
over any past time range. If you have some knowledge about when an event
occurred, use it to target your search to that time period for faster results.
It's your second day of work with the Customer Support team for the online
Flower & Gift shop. You just got to your desk. Before you make yourself a
cappuccino, you decide to run a quick search to see if there were any recent
issues you should be aware of.
1. Return to the Search dashboard and type in the following search over all time:
error OR failed OR severe OR (sourcetype=access_* (404 OR 500 OR 503))
This search uses parentheses to group together expressions for more complicated searches.
When evaluating Boolean expressions, Splunk performs the operations within the innermost
parentheses first, followed by the next pair out. When all operations within parentheses are
completed, Splunk evaluates OR clauses, then, AND or NOT clauses.
Also, this search uses the wildcarded shortcut, "access_*", to match the Web
access logs. If you have different source types for your Apache server logs,
such as access_common and access_combined, this will match them all.
This searches for general errors in your event data over the course of the last
week. Instead of matching just one type of log, this searches across all the logs
in your index. It matches any occurrence of the words "error", "failed", or "severe"
in your event data. Additionally, if the log is a Web access log, it looks for HTTP
error codes, "404", "500", or "503".
34
This search returns a significant amount of errors. You're not interested in
knowing what happened over All time, even if it's just the course of a week. You
just got into work, so you want to know about more recent activity, such as
overnight or the last hour. But, because of the limitations of this dataset, let's look
at yesterday's errors.
2. Drop down the time range picker and change the time range to Other >
Yesterday.
Out-of-the box, Splunk searches across all of your data; that is, the default time range for a
search is across "All time". If you have a lot of data, searching on this time range when you're
investigating an event that occurred 15 minutes ago, last night, or the previous week just
means that Splunk will take a long time to retrieve the results that you want to see.
3. Selecting a time range from this list automatically runs the search for you. If it
doesn't, just hit Enter.
This search returns events for general errors across all your logs, not just Web
access logs. (If your sample data file is more than a day old, you can still get
these results by selecting Custom time and entering the last date for which you
have data.) Scroll through the search results. There are more mySQL database
errors and some 404 errors. You ask the intern to get you a cup of coffee while
you contact the Web team about the 404 errors and the IT Operations team
about the recurring server errors.
Splunk also provides options for users to define a custom time range to search or select to
search a continuous stream of incoming events.
35
• Real-time enables searching forward in time against a continuous
stream of live incoming event data. Because the sample data is a
one-time upload, running a real-time search will not give us any results
right now. We will explore this option later. For more information about
real-time searches and how to run them, read "Search and report in
real-time" in the User Manual.
• Custom time... pops up a new window and enables you to define your
own time ranges based on specific dates, relative dates, real-time
windows, or using the search language. For more information about
how to define custom time ranges, read "Change the time range of your
search" in the User Manual.
Up to now, you've run simple searches that matched the raw text in your events.
You've only scratched the surface of what you can do in Splunk. When you're
ready to proceed, go on to the next topic to learn about fields and how to search
with fields.
Use fields to search
This topic assumes you know how to run simple searches and use the time
range picker and timeline. If you're not sure, review the previous topics,
beginning with Start searching.
You can learn a lot about your data from just running ad hoc searches, using
nothing more than keywords and the time range. But you can't take full
advantage of Splunk's more advanced searching and reporting features without
understanding what fields are and how to use them. This part of the tutorial will
familiarize you with:
• default fields and other fields that Splunk automatically extracts
• using the fields menu and fields picker to find helpful fields
• searching with fields
Let's return to the happenings at the online Flower and Gift shop. It's your second
day as a member of the Customer Support team. You spent the morning
investigating some general issues and reporting the problems you found to other
teams. You feel pretty good about what you've learned about the online shop and
its customers, but you want to capture this and share it with your team. When
you ask a coworker how you can do this, he recommends that you use fields.
36
What are fields?
Fields exist in machine data in many forms. Often, a field is a value (with a
fixed, delimited position on the line) or a name and value pair, where there is a
single value to each field name. A field can also be multivalued; that is, it
appears more than once in an event and has a different value for each
appearance.
In Splunk, fields are searchable name/value pairings that distinguish one
event from another because not all events will have the same fields and field
values. Fields enable you to write more tailored searches to retrieve the
specific events that you want. Fields also enable you to take advantage of the
search language, create charts, and build reports.
Some examples of fields are clientip for IP addresses accessing your Web
server, _time for the timestamp of an event, and host for domain name of a
server. One of the more common examples of multivalue fields is email
address fields. While the "From" field will contain only a single email address,
the "To" and "Cc" fields may have one or more email addresses associated
with them.
For more information, read About fields in the Knowledge Manager manual.
The fields sidebar and dialog
1. Go back to the Search dashboard and search for web access activity. Select
Other > Yesterday from the time range picker:
sourcetype="access_*"
2. Scroll through the search results.
If you're familiar with the access_combined format of Apache logs, you will
recognize some of the information in each event, such as:
• IP addresses for the users accessing the website.
• URIs and URLs for the page request and referring page.
• HTTP status codes for each page request.
• Page request methods.
37
As Splunk retrieves these events, the Fields sidebar updates with selected fields
and interesting fields. These are the fields that Splunk extracted from your data.
Default and automatically extracted fields
Splunk extracts fields from event data twice. It extracts default and other
indexed fields during event processing when that data is indexed. And it
extracts a different set of fields at search time, when you run a search. Read
more about "Index time versus search time" in the Admin manual.
At index time, Splunk automatically finds and extracts default fields for each
event it processes. These fields include host, source, and sourcetype (which
you should already be familiar with). For a complete list of the default fields,
see "Use default fields" in the User manual.
Splunk also extracts certain fields at search time--when you run a search.
You'll see some examples of these searches later. For more information, read
the "Overview of search-time field extractions" in the Knowledge Manager
manual.
Notice that default fields host, source, and sourcetype are selected fields and are
displayed in your search results:
3. Scroll through Other interesting fields to see what else Splunk extracted.
You should recognize the field names that apply to the Web access logs. For
example, there's clientip, method, and status. These are not default fields;
they have (most likely) been extracted at search time.
4. Click the Edit link in the fields sidebar.
38
The Fields dialogue opens and displays all the fields that Splunk extracted.
• Available Fields are the fields that Splunk identified from the events in
your current search (some of these fields were listed under interesting
fields).
• Selected Fields are the fields you picked (from the available fields) to
show in your search results (by default, host, source, and sourcetype
are selected).
5. Scroll through the list of Available Fields.
You're already familiar with the fields that Splunk extracted from the Web access
logs based on your search. You should also see other default fields that Splunk
defined--some of these fields are based on each event's timestamp (everything
beginning with date_*), punctuation (punct), and location (index).
But, you should also notice other extracted fields that are related to the online
store. For example, there are action, category_id, and product_id. From
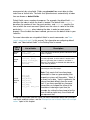
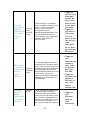
conversations with your coworker, you may know that these fields are:
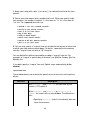
Field name
Description
action
what a user does at the online shop.
category_id
the type of product a user is viewing or buying.
product_id
the catalog number of the product the user is viewing or buying.
6. From the Available fields list, select action, category_id, and product_id.
39
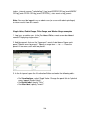
7. Click Save.
When you return to the Search view, the fields you selected will be included in
your search results if they exist in that particular event. Different events will have
different fields.
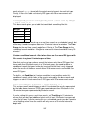
The fields sidebar doesn't just show you what fields Splunk has captured from
your data. It also displays how many values exist for each of these fields. For the
fields you just selected, there are 2 for action, 5 for category_id, and 9 for
product_id. This doesn't mean that these are all the values that exist for each of
the fields--these are just the values that Splunk knows about from the results of
your search.
What are some of these values?
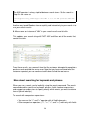
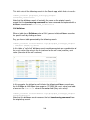
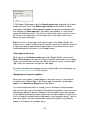
8. Under selected fields, click action for the action field.
This opens the field summary for the action field.
40
This window tells you that, in this set of search results, Splunk found two values
for action and they are purchase and update. Also, it tells you that the action
field appears in 71% of your search results. This means that three-quarters of the
Web access events are related to the purchase of an item or an update (of the
item quantity in the cart, perhaps).
9. Close this window and look at the other two fields you selected, category_id
(what types of products the shop sells) and product_id (specific catalog names
for products).
Now you know a little bit more about the information in your data relating to the
online Flower and Gift shop. The online shop sells a selection of flowers, gifts,
plants, candy, and balloons. Let's use these fields, category_id and product_id,
to see what people are buying.
Use fields to run more targeted searches
These next two examples illustrate the difference between searching with
keywords and using fields.
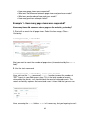
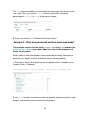
Example 1: Return to the search you ran to check for errors in your data. Select
Other > Yesterday from the time range picker:
error OR failed OR severe OR (sourcetype=access_* (404 OR 500 OR 503))
Run this search again, but this time, use fields in your search.
41
To search for a particular field, just type the field name and value into the search bar:
fieldname=fieldvalue
The HTTP error codes are values of the status field. Now your search looks like
this:
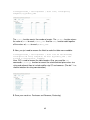
error OR failed OR severe OR (sourcetype=access_* (status=404 OR
status=500 OR status=503))
Notice the difference in the count of events between the two searches--because
it's a more targeted search, the second search returns fewer events.
When you run simple searches based on arbitrary keywords, Splunk matches the
raw text of your data. When you add fields to your search, Splunk looks for
events that have those specific field/value pairs.
Also, you were actually using fields all along! Each time you searched for
sourcetype=access_*, you told Splunk to only retrieve events from your web
access logs and nothing else.
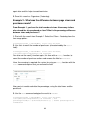
Example 2: Before you learned about the fields in your data, you might have run
this search to see how many times flowers were purchased from the online shop:
sourcetype=access_* purchase flower*
As you typed in "flower", search assistant shows you both "flower" and "flowers'
in the typeahead. Since you don't know which is the one you want, you use the
wildcard to match both.
42
If you scroll through the (many) search results, you'll see that some of the events
have action=update and category_id that have a value other than flowers.
These are not events that you wanted!
Run this search instead. Select Other > Yesterday from the time range picker:
sourcetype=access_* action=purchase category_id=flower*
Note: Field names are case sensitive, but field values are not!
For the second search, even though you still used the wildcarded word "flower*",
there is only one value of category_id that it matches (FLOWERS).
Notice the difference in the number of events that Splunk retrieved for each
search; the second search returns significantly fewer events. Searches with fields
are more targeted and retrieves more exact matches against your data.
As you run more searches, you want to be able to save them and reuse them or
share them with your teammates. When you're ready, proceed to the next topic
to learn how to save your search and share it it with others.
Save a search
This topic assumes you're comfortable running searches with fields. If you're not,
go back to the previous topic and review how to Use fields to search.
43
This topic walks you through the basics of saving a search and how you can use
that search again later.
Back at the Flower & Gift shop, you just ran a search to see if there were any
errors yesterday. This is a search you will run every morning. Rather than type it
in manually every day, you decide to save this search.
Example 1. Run the search for all errors seen yesterday:
error OR failed OR severe OR (sourcetype=access_* (status=404 OR
status=500 OR status=503))
1. Click Save under the search bar.
This enables you to save a search, save a search's results, or save and share
the results.
Saving the results of a search is different from saving the search itself; you do this when you
want to be able to review the outcome of a particular run of a search at a later time. For more
information, read about "Saving searches and sharing search results" in the User
Manual.
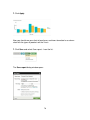
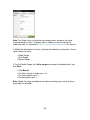
2. Select Save search... from the list.
The Save search dialog box opens.
44
At a minimum, a saved search includes the search string and the time range
associated with the search, as well as the name of the search.
3. Name the search, Errors (Yesterday)
4. Leave the Search string, Time range, and Share settings as they are.
(Notice that the time range should already by set to "yesterday".)
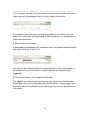
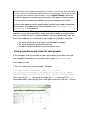
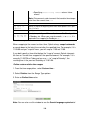
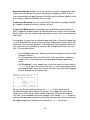
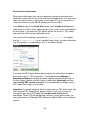
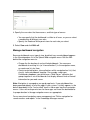
5. Click Finish. Splunk confirms that your search was saved:
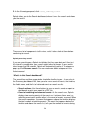
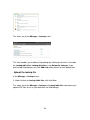
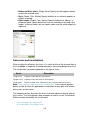
6. Find your saved search in the Searches & Reports list:
Because the saved search's name contained the word "Error," Splunk lists it in
the saved search submenu for Errors.
The green dot next to your saved search means that it's local to your Splunk
account; right now you are the only one that is authorized to access this saved
search. Since this is a search that others on your team may want to run, you can
set it as a global saved search that they can access. To do this, read more about
saving searches and sharing search results.
45
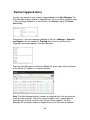
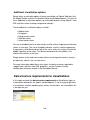
Manage searches and reports
If you want to modify a search that you saved, use the Searches & Reports
menu to select Manage Searches & Reports. This takes you the Splunk
Manager page for all the searches and reports you're allowed to access (if
you're allowed to access them). From here you can select your search from
the list. This take you to the searches edit window where you can then change
or update the search string, description, time range, and schedule options.
Schedule saved searches and alerts
If you have an Enterprise license, Splunk also lets you configure the searches
you saved to run on a schedule and to set alerts based off the scheduled
searches. When you download Splunk for the first time, you're given an
Enterprise trial license that expires after 60 days. If you're using the Free
license, you do not have the capability to schedule a saved search. Read
more about scheduling saved searches and setting alerts in the "Monitoring
recurring situations" chapter of the User manual.
Now, you can save your searches after you run them. When you're ready,
proceed to the next topic to learn more ways to search.
Use Splunk's search language
This topic assumes that you are familiar with running simple searches using
keywords and field/value pairs. If you're not sure, go back and read "Use fields to
search".
Back at the online Flower & Gift shop Customer Support office, the searches
you've run to this point have only retrieved matching events from your Splunk
index. For example, in a previous topic, you ran this search for to see the
purchases of flowers:
sourcetype=access_* action=purchase category_id=flowers
The search results told you approximately how many flowers were bought. But,
this doesn't help you answer questions, such as:
• What items were purchased most at the online shop?
• How many customers bought flowers? How many flowers did each
customer buy?
46
To answer these questions, you need to use Splunk's search language, which
includes an extensive library of commands, arguments, and functions that
enables you to filter, modify, reorder, and group your search results. For this
tutorial you'll only use a few of them.
How to construct a search with search assistant
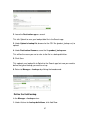
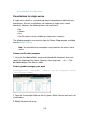
Example 1. What items were purchased most at the online shop?
1. Return to the search dashboard and restrict your search to purchases over
Yesterday:
sourcetype=access_* action=purchase
As you type in the search bar, search assistant opens with syntax and usage
information for the search command (on the right side). If search assistant
doesn't open, click the green arrow under the left side of the search bar.
You've seen before that search assistant displays typeahead for keywords that
you type into the search bar. It also explains briefly how to search. We've already
gone through retrieving events. Now, let's start using the search commands.
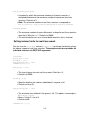
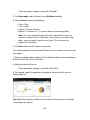
2. Type a pipe character into the search bar.
The pipe indicates to Splunk that you want to take the results of the search to the left of the pipe
and use that as the input to the command after the pipe. You can pass the results of one
command into another command in a series, or pipeline, of search commands.
You want Splunk to give you the most popular items bought at the online
47
store--the top command looks promising.
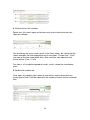
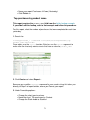
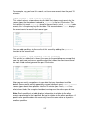
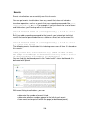
3. Under common next commands, click top.
Splunk appends the top command to your search string.
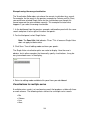
According to search assistant's description and usage examples, the top
command "displays the most common values of a field"--exactly what you
wanted.
You wanted to know what types of items were being bought at the online shop,
not just flowers. It also shows you interesting fields that you can click on to add
to the search.
4. Either click the category_id field in the list or type it into the search bar to
complete your search:
sourcetype=access_* action=purchase | top category_id
This gives you a table of the top or most common values of category_id. By
default, the top command returns ten values, but you only have five different
types of items. So, you should see all five, sorted in descending order by the
count of each type:
The top command also returns two new fields: count is the number of times each
value of the field occurs, and percent is how large that count is compared to the
total count. Read more about the top command in the Search reference manual.
48
Drill down into search results
The last search returned a table that showed you what items the online shop
sells and how many of those items were purchased. But, you want to know more
about an individual item, for example, flowers.
Example 2: How many flowers were bought?
1. Click the row in the result table for Flowers.
This kicks off a new search. Splunk updates your search, to include the filter for
the field/value pair category=flowers, which was the row item you clicked in the
result table from the search in Example 2.
drilldown actions enable you to delve deeper into the details of the
information presented to you in the tables and charts that result from your
search. Read more about drilldown actions in the User manual.
Splunk's
The number of events returned tells you how many times flowers were
purchased, but you want to know how many different customers bought the
flowers.
Example 3: How many different customers purchased the flowers?
1. You're looking specifically for the purchase of flowers, so continue with the
search from the previous example:
sourcetype=access_* action=purchase category_id=flowers
The customers who access the Flower & Gift shop are distinguished by their IP
addresses, which are values of the clientip field.
49
2. Use the stats command and the distinct_count() or dc() function:
sourcetype=access_* action=purchase category_id=flowers | stats
dc(clientip)
You piped the search results into the stats command and used the
distinct_count() function to count the number of unique clientip values
that it
finds in those events. This returns a single value:
This tells you that there were approximately 300 different people who bought
flowers from the online shop.
Example: 4 In the last example, you calculated how many different customers
bought flowers. How do you find the number of flowers that each customer
bought?
1. Use the stats command:
sourcetype=access_* action=purchase category_id=flowers | stats count
The count() function returns a single value, the count of your events. (This
should match your result from Example 2.)
Now, break this count down to see how many flowers each customer bought.
2. Add a by clause to the stats command:
sourcetype=access_* action=purchase category_id=flowers | stats count
BY clientip
This search gives you a table of the different customers (clientip) and the number
of flowers purchased (count).
50
Reformat the search results
You might know what the header for this table represents, but anyone else
wouldn't know at a glance. You want to show off your results to your boss and
other members of your team. Let's reformat it a little:
3. First, let's rename the count field:
sourcetype=access_* action=purchase category_id=flowers | stats count
AS "# Flowers Purchased" by clientip
The syntax for the stats command enables you to rename the field inline using
an "AS" clause. If your new field name is a phrase, use double quotes.
The syntax for the stats command doesn't allow field renaming in the "by"
clause.
4. Use the rename command to change the clientip name:
sourcetype=access_* action=purchase category_id=flowers | stats count
AS "# Flowers Purchased" by clientip | rename clientip AS Customer
This formats the table to rename the headers, clientip and count, with Customer
and # Flowers purchased:
51
For more information about the stats command and its usage, arguments, and functions, see
the stats command in the Search reference manual and the list of stats functions. For more
information about the rename command, see the rename command in the Search reference
manual.
In this last search, you found how many flowers each customer to the online
shop bought. But what if you were looking for the one customer who buys the
most items on any given day? When you're ready, continue on to the next topic
to learn another way to search, this time using subsearches.
Use a subsearch
The last topic introduced search commands, the search pipeline, and drilldown
actions. If you're not familiar with them, review more ways to search.
This topic walks you through another search example and shows you two
approaches to getting the results that you want.
Back at the Flower & Gift shop, your boss asks you to put together a report that
shows the customer who bought the most items yesterday and what he or she
bought.
Part 1: Break the search down.
Let's see which customer accessed the online shop the most yesterday.
1. Use the top command and limit the search to Yesterday:
sourcetype=access_* action=purchase | top limit=1 clientip
Limit the top command to return only one result for the clientip. If
you wanted
to see more than one "top purchasing customer", change this limit value. For
more information about usage and syntax, refer to the the "top" command's page
in the Search Reference Manual.
52
This search returns one clientip value that you will now use to complete your
search.
2. Use the stats command to count this VIP customer's purchases:
sourcetype=access_* action=purchase clientip=10.192.1.39 | stats count
by clientip
This search used the count() function which only returns the count of purchases
for the clientip. You also want to know what he bought, so let's use another stats
function.
3. One way to do this is to use the values() function:
sourcetype=access_* action=purchase clientip=10.192.1.39 | stats count,
values(product_id) by clientip
This adds a column to the table that lists what he bought by product ID.
The drawback to this approach is that you have to run two searches each time
you want to build this table. The top purchaser is not likely to be the same person
at any given time range.
For more information about usage and syntax, refer to the the "stats" command's page in the
Search Reference Manual. Also, for the list of other stats functions, refer to the "List of
stats functions" in the the Search Reference Manual.
Part 2: Let's use a subsearch instead.
53
A subsearch is a search with a search pipeline as an argument. Subsearches are contained in
square brackets and evaluated first. The result of the subsearch is then used as an argument
to the primary, or outer, search. Read more about "How subsearches work" in the User
manual.
1. Use a subsearch to run the searches from Part 1 inline. Type or copy/paste in:
sourcetype=access_* action=purchase [search sourcetype=access_*
action=purchase | top limit=1 clientip | table clientip] | stats count,
values(product_id) by clientip
Because the top command returns count and percent fields as well, you use the
table command to keep only the clientip value.
These results should match the previous result, if you run it on the same time
range. But, if you change the time range, you might see different results because
the top purchasing customer will be different!
2. Reformat the results so that it's easier to read:
sourcetype=access_* action=purchase [search sourcetype=access_*
action=purchase | top limit=1 clientip | table clientip] | stats count,
values(product_id) as product_id by clientip | rename count AS "How
much did he buy?", product_id AS "What did he buy?", clientip AS "VIP
Customer"
While this report is perfectly acceptable, you want to make it better. For example,
you don't expect your boss to know the shop items by their product ID numbers.
You want to display the VIP customer's purchases by the product names, rather
than the cryptic product ID. When you're ready continue on to the next topic to
learn about adding more information to your events using field lookups.
Use field lookups
The last topic walked you through using a subsearch. If you're not familiar with it,
go back and review how to Use a subsearch.
54
This topic walks you through using field lookups to add new fields to your events.
What are field lookups?
Field lookups enable you to reference fields in an external CSV file that match
fields in your event data. Using this match, you can enrich your event data by
adding more meaningful information and searchable fields to them.
For an example that shows you how to use field lookups to add HTTP status
code descriptions to your Web access event data, see this User manual topic.
In the previous example, you created a report table that listed how many items
the top purchasing customer bought and which items they were. The items were
listed by a product ID number that, on it's own, is pretty meaningless because
you don't know what it refers to. Before you show this report to your boss and
coworkers, you want to add the actual product name. This information doesn't
exist in your data, but you can add it from an external file using field lookups.
To proceed, download and uncompress this CSV file:
product_lookup.csv.zip
Important: To complete the rest of the tutorial, you have to follow the procedures
in this topic. If you don't follow this topic, the searches in the following topics will
not produce the correct results.
Find the Lookups manager
1. In the Splunk navigation menus, on the upper right corner, click on Manager.
This takes you to Splunk Manager, which enables you to access and configure
your Splunk server's apps, knowledge objects, and other settings such as
system, data, deployment, and authentication settings. If you don't see some of
these options, it just means that you do not have the permissions to view or edit
them.
For now, we're only interested in the Knowledge configurations.
2. Under Knowledge, click Lookups.
55
This takes you to the Manager > Lookups view.
This view enables you to edit existing lookups by clicking on the links in the table
for Lookup table files, Lookup definitions, and Automatic lookups. If you
want to add new lookups, just click Add new under actions for that lookup item.
Upload the lookup file
In the Manager > Lookups view:
1. Under Actions for Lookup table files, click Add New.
This takes you to the Manager > Lookups > Lookup table files view where you
upload CSV files to use in your definitions for field lookups.
56
2. Leave the Destination app as search.
This tells Splunk to save your lookup table file in the Search app.
3. Under Upload a lookup file, browse for the CSV file (product_lookup.csv) to
upload.
4. Under Destination filename, name the file product_lookup.csv.
This will be the name you use to refer to the file in a lookup definition.
5. Click Save.
This uploads your lookup file to Splunk to the Search app, but now you need to
define the type of lookup you want to set up.
6. Return to Manager > Lookups by clicking the breadcrumb:
Define the field lookup
In the Manager > Lookups view:
1. Under Actions for Lookup definitions, click Add New.
57
This takes you to the Manager > Lookups > Lookup table files view where you
define your field lookup.
2. Leave the Destination app as search.
3. Name your lookup product_lookup.
4. Under Type, select File-based.
5. Under Lookup file, select product_lookup (the name of your lookup table).
6. Leave Configure time-based lookup and Advanced options unchecked.
7. Click Save.
Now Splunk knows that product_lookup is a file-based lookup.
Make the lookup automatic
In the Manager > Lookups view:
1. Under Actions for Automatic lookups, click Add New.
This takes you to the Manager > Lookups > Automatic lookups >> Add New
view where you configure the lookup to run automatically.
58
2. Leave the Destination app as search.
3. Name your automatic lookup product_lookup.
4. Under Lookup table, select product_lookup.
5. Under Apply to and named, select sourcetype and type in
access_combined_wcookie.
6. Under Lookup input fields type in:
The input field is the field in your event data that you are using to match the field
in the lookup table.
7. Under Lookup output fields, type in the following. Use the Add another field
link to add more fields after the first one:
59
The output fields are the field(s) in the lookup table that you want to add to your
event data based on the input field matching. Here, you are adding the fields:
price, which contains the price for each product_id, and product_name, which
contains the descriptive name for each product_id.
8. Leave Overwrite field values unchecked.
If you check this box, Splunk will overwrite any fields that exist in your event data
with values from the corresponding field that you map to it from the lookup table.
Since you are adding two new fields, you don't need to worry about this option.
9. Click Save.
Return to the Search dashboard (click << Back to Search) and run the search
for Web access activity over the time range, Yesterday:
sourcetype=access_*
When you scroll through the Fields menu or Fields picker, you should see the
new fields that you added.
Search examples
Now you can run the previous subsearch example to see what the VIP customer
bought. This time, replace the product_id field with the more readable
product_name:
60
sourcetype=access_* action=purchase [search sourcetype=access_*
action=purchase | top limit=1 clientip | table clientip] | stats count,
values(product_name) AS product_name by clientip | sort - count |
rename count AS "How much did he buy?", product_name AS "What did he
buy?", clientip AS "VIP Customer"
The result is exactly the same as in the previous subsearch example, except that
the VIP customer's purchases are more meaningful.
Save the search as "VIP Customer".
When you're ready, proceed to the next topic where you will run more searches.
More search examples
In the last topic, you added two new fields to the online shop event data using a
lookup table. If you didn't add those fields, go back and review how to use field
lookups and follow the procedure to add the fields. Without them, the searches
below will not return the correct results.
This topic walks you through more searches using what you learned from
previous topics.
The search reference manual
These examples use only a handful of the search commands and functions
available to you. For complete syntax and descriptions of usage of all the
search commands, see the Search reference manual.
• The complete list of search commands
• The list of functions for the eval command
• The list of functions for the stats command
Back at the Flower & Gift shop, you're running searches to gather information to
build a report for your boss about yesterday's purchase records:
61
• How many page views were requested?
• What was the difference between page views and purchases made?
• What was purchased and how much was made?
• How many purchase attempts failed?
Example 1 - How many page views were requested?
How many times did someone view a page on the website, yesterday?
1. Start with a search for all page views. Select the time range, Other >
Yesterday:
sourcetype=access_* method=GET
Next you want to count the number of page views (characterized by the method
field).
2. Use the stats command:
sourcetype=access_* method=GET | stats count AS Views
Here, you use the stats command's count() function to count
the number of
"GET" events in your Web access logs. This is the total number of events
returned by the search, so it should match the count of retrieved events. This
search essentially captures that count and saves it into a field that you can use.
Here, renaming the count field as Views isn't necessary, but you're going to use it
62
again later and this helps to avoid confusion.
3. Save this search as Pageviews (Yesterday).
Example 2 - What was the difference between page views and
purchases made?
From Example 1, you have the total number of views. How many visitors
who viewed the site purchased an item? What is the percentage difference
between views and purchases?
1. Start with the search from Example 1. Select the Other > Yesterday from the
time range picker:
sourcetype=access_* method=GET | stats count AS views
2. Use stats to count the number of purchases (characterized by the action
field):
sourcetype=access_* method=GET | stats count AS Views,
count(eval(action="purchase")) AS Purchases
You also use the count() function again, this time with an eval() function, to
count the number of purchase actions and rename the field as Purchases.
Here, the renaming is required--the syntax for using an eval() function with the
stats command requires that you rename the field.
Now you just need to calculate the percentage, using the total views and the
purchases.
3. Use the eval command and pipe the results to rename:
sourcetype=access_* method=GET | stats count AS Views,
count(eval(action="purchase")) as Purchases | eval
percentage=round(100-(Purchases/Views*100)) | rename percentage AS "%
Difference"
63
The eval command enables you to evaluate an expression and save the result
into a field. Here, you use the round() function to round the calculated
percentage of Purchases to Views to the nearest integer.
5. Save your search as "% Difference Purchases/Views".
Example 3 - What was purchased and how much was made?
This example requires the two fields, product_name and price, added in the
fields lookup example. If you didn't add them, refer to that example and
follow the procedure.
Build a table to show what products were purchased yesterday, how many of
each item was bought, and the calculated revenue for each product.
1. Start with a search for all purchases by the product name. Change the time
range to Other > Yesterday:
sourcetype=access_* action=purchase | stats count by product_name
2. Use stats functions to include the count of products purchased, price of each
product, and the total revenue made for each product.
64
sourcetype=access_* action=purchase | stats count, values(price),
sum(price) by product_name
The count() function counts the number of events. The values() function returns
the value of price for each product_name. And the sum() function adds together
all the values of price for each product_name.
3. Now, you just need to rename the fields to make the table more readable:
sourcetype=access_* action=purchase | stats count AS "# Purchased",
values(price) AS Price, sum(price) AS Total by product_name | eval
Total="$ ".tostring(Total, "commas")
Here, 'AS' is used to rename the table headers. Also, you used the eval
command's tostring() function to convert the calculated total price values to
a
string and reformat them to include a dollar sign "$" and commas. (The dot '.' is a
shortcut notation for string concatenation.)
5. Save your search as Purchases and Revenue (Yesterday).
65
Example 4 - How many purchase attempts failed?
In the previous examples you searched for successful purchases, but you also
want to know the count of purchase attempts that failed!
1. Run the search for failed purchase attempts, selecting Yesterday from the time
range picker:
sourcetype=access_* action=purchase status=503
(You should recognize this search from the Start searching topic, earlier in this
tutorial.)
This search returns the events list, so let's count the number of results.
2. Use the stats command:
sourcetype=access_* action=purchase status=503 | stats count
This returns a single value:
This means that there were no failed purchases yesterday!
3. Save this search as Failed purchases (Yesterday).
Now you should be comfortable using the search language and search
commands. When you're ready, proceed to the next topic to learn how to create
charts and build reports.
Reporting examples
This topic builds on the searches that you ran and saved in the previous search
examples to walk you through creating charts and building reports.
66
Splunk can dynamically update generated charts as it gathers search results. When you initiate
a search, you can start building your report before the search completes. You can use the fields
menu to quickly build simple pre-defined reports or use the Report Builder, which lets
you define, generate, and fine-tune the format of your report, from the type of
chart you want to create to the contents you want to display on this chart.
To learn more about using the report builder to define basic report parameters,
format charts, and export or print finished reports, see "Define reports and
generate charts" in this manual.
Back at the Flower & Gift shop, you're still building your reports. The previous
searches you ran returned either a single value (for example, a count of failed
errors) or a table of results (a table of products that were purchased). Now, you
want to also add some visualizations to your reports of yesterday's activities:
• The count of purchases and views for each product category
• The count of products purchased over time
• A trend of the count of products purchased over time
Chart of purchases and views for each product
In this example, chart the number of views and number of purchases for each
type of product. Recall that you saved a similar search in a previous topic.
Let's modify it a little.
1. Run this search over the time range, Yesterday:
sourcetype=access_* method=GET | chart count AS views,
count(eval(action="purchase")) AS purchases by category_id | rename
views AS "Views", purchases AS "Purchases", category_id AS "Category"
Here, you use the chart command instead of the stats command. The chart
command enables you to create charts and specify the x-axis with the by clause.
67
2. Click on Create, and select Report... from the list.
Because you use the chart command and have already defined your report, this
opens the Format report page of the Report Builder.
If you see something different in this window, for example a different chart type,
it's probably because you're not looking at the default settings. You don't need to
worry about this though.
If your search string includes reporting commands, you access the Report Builder by clicking
Show report. Splunk will jump you directly to the formatting stage of the report-building
process, since your reporting commands have already defined the report.
You don't need to have a strong understanding of reporting commands to use
the Report Builder, but if you do have this knowledge the range of things you
can do with the Report builder is increased.
3. Under Formatting options:
• Leave the chart type set to column.
• Name the chart, Purchases and Views by Product Type.
68
Because you're using the chart command, you have to define the axes of the
chart.
4. Under General, leave the settings as it is.
5. Under Format, click X-axis:
Type in "Product type" for the X-axis title.
6. Under Format, click Y-axis:
Type in "Count of events" for the y-axis title.
69
7. Click Apply.
Now you should see your chart of purchases and views formatted as a column
chart with the types of products on the X-axis.
7. Click Save and select Save report... from the list.
The Save report dialog window opens:
70
• Name your report Purchases & Views (Yesterday).
• Click Finish >>.
Top purchases by product name
This report requires the product_name field from the fields lookup example.
If you didn't add the lookup, refer to that example and follow the procedure.
For this report, chart the number of purchases that were completed for each item
yesterday.
1. Search for:
sourcetype=access_* | timechart count(eval(action="purchase")) by
product_name usenull="f"
Once again, use the count() function. But also, use the usenull argument to
make sure the chart only counts events that have a value for product_name.
2. Click Create and select Report....
Because you used the timechart command in your search string, this takes you
directly to Step 2 of report builder, where you Format your report.
3. Under Formatting options:
• Change the chart type to column.
• Name the chart, Top purchases by Product.
• Change the Stack mode to Stacked.
71
Because you used the timechart command, the axes are already named: the
x-axis is time and the y-axis is count of events.
4. Click Apply.
Each of the columns represents the different products bought in that half-hour
period.
5. Click Save and select Save report...
• Name your report Products Purchased (Yesterday).
• Click Finish >>.
There are alternate ways to access the Report builder:
• Click Build report in the Actions dropdown menu after you initiate a new
search or run a saved search.
• Click a field in the search results sidebar to bring up the interactive menu
for that field. Depending on the type of field you've clicked, you'll see
links to reports in the interactive menu such as average over time,
maximum value over time, and minimum value over time (if you've
selected a numerical field) or top values over time and top values
overall (if you've selected a non-numerical field). Click on one of these
72
links, and Splunk opens the Format report page of the Report Builder,
where it generates the chart described by the link.
Top purchases trend
For stats and chart searches, you can add sparklines to their results tables.
Sparklines are inline charts that appear within the search results table and are
designed to display time-based trends associated with the primary key of each
row. For more information, read "Add sparklines to your search results" in the
User Manual.
This example uses sparklines to trend the count of purchases made yesterday.
This example requires the product_name field from the fields lookup
example. If you didn't add the lookup, refer to that example and follow the
procedure.
Run this search over the time range "Yesterday":
sourcetype=access_* | chart sparkline(count(eval(action="purchase")))
AS "Purchases Trend (Yesterday)" by product_name
This search is similar to the last two searches you just ran to build reports. It uses
the chart command to count the number of purchases,
count(eval(action="purchase")), made for each product, product_name. The
difference here is that the count of purchases is now an argument of the
sparkline() function. (Also, the results are renamed to "Purchases Trend
(Yesterday)" to indicate that you are trending the count of purchases made
throughout the day, yesterday.)
Let's add this to a report to display, not only the total purchases made yesterday,
but a trend of the purchases throughout the day:
sourcetype=access_* | chart sparkline(count(eval(action="purchase")))
AS "Purchases Trend (Yesterday)" count(eval(action="purchase")) AS
73
Total by product_name | rename product_name AS "Product Name"
Save this search as, Top Purchases Trend (Yesterday).
Access saved reports
After you save a report, go << back to Search. Splunk lists all your saved
reports in the Searches & Reports menu on the search dashboard:
Save and share reports
When you're happy with the report you've created, you have a number of options
for saving it and sharing it with others. Read more about saving your reports in
"Save reports and share them with others".
You can also design specialized views and dashboards that include reports that
you've defined. Dashboards can be made up of multiple panels that each display
charts, lists, and other data that are generated by hidden, predefined searches.
When you're ready, proceed to the next topic which walks you through creating
and sharing a dashboard.
74
Build and share a dashboard
Before you proceed with this topic you should review Reporting on field values,
where you have already built and saved a few reports. This topic walks you
through creating simple dashboards that use the same searches and reports that
you saved in the previous topics.
Back at the Flower & Gift Shop, your boss asks you to put together a dashboard
to show metrics about the products sold at the online shop. You also decide to
build yourself a dashboard to help you or another member of the IT team find and
troubleshoot problems with the online shop.
Flower & Gift Shop Products
The first dashboard will show metrics related to the day-to-day purchase of
different products at the Flower & Gift shop. For this dashboard, you'll use the
saved searches:
• Products Purchased (Yesterday)
• Products & Revenue (Yesterday)
• Purchases & Views (Yesterday)
To start, make sure you're in the Search app.
1. Click Dashboards & Views and select Create dashboard... from the list.
This opens the Create new dashboard dialogue which enables you to define a
new dashboard.
2. To create the new dashboard:
75
2a. Designate the unique ID for this dashboard as "Products". This ID is the
name you use to refer to the dashboard from other objects within Splunk.
2b. Name the dashboard, Flower & Gift Shop - Products. This name is the
label that you will see listed in the navigation menus and at the top of your
dashboard.
2c. Click Create.
This takes you to your new dashboard, which is currently empty. Let's start filling
it with panels.
3. At the top of the dashboard, next to its name, are dashboard options. When
Edit is turned off, you will see options for printing the dashboard and PDF
delivery.
Let's not worry about these options right now. You can read more about them
later
3a. To start editing the dashboard, toggle the Edit switch to ON.
When Edit is turned ON, you will see three options:
• New panel enables you to add panels to the dashboard.
• Edit XML enables you to edit the XML code for the dashboard.
• Edit permissions enables you to control who has access to the
dashboard.
76
3b. To add a panel to the dashboard, click New panel.
This opens the New panel dialogue which enables you to define properties for
the panel.
4. To add a new panel to the dashboard, give it a name and specify the search to
associate with it:
4a. Under Title, name the panel "Products Purchased (Yesterday)". This is the
label for the panel.
4b. Under Search command, select "Saved search".
All dashboard panels are associated with searches. You can specify whether a
panel runs off of a predefined, saved search, or whether it uses a search that has
been specifically designed for the panel and associated with it in an "inline"
manner. For these dashboards, you'll just use saved searches and reports.
4c. From the list, select the saved search named "Products Purchased
(Yesterday)".
4d. Click Save.
Now you've added a new panel to the "Flower & Gifts Shop - Products"
dashboard. Here, by default, the search results are displayed as a table. This is
not the visualization you want for this panel, though, so let's change it.
77
5. For the panel, click Edit and select Edit visualization... from the list.
This opens the Edit visualization dialogue which enables you to modify how the
search results are represented in the panel: data table, events list, charts, single
value panels, and gauges. For more information about visualization options,
read... Link me!
6. From the list of "Visualizations", select Column to display your results in a
stacked column chart.
78
7. Click Save.
Now, the panel should look like this:
8. Add two more new panels to the dashboard:
8a. Add panel named Purchases & Views (Yesterday) for the count of
purchases and views made yesterday (# Purchases & Views). Edit the
visualization type to display a column chart.
8b. Add panel named Products & Revenue (Yesterday) to list the products that
were sold yesterday and the revenue made from the sales (Purchases and
Revenue (Yesterday). Edit the visualization type to display a data table.
8c. Once you've added the new panels, drag the panels to rearrange them so
that they display like this:
This is your products dashboard. Now let's follow the same steps to create an
operations dashboard.
79
Flower & Gift Shop Operations
The second dashboard includes simple reports that you can view at the start of
your day to give you some information about recent web access activity. For this
dashboard, you'll use the saved searches:
• Total views (Yesterday)
• Failed purchases (Yesterday)
• Errors (Yesterday)
To start, return to the Search app.
1. Click Dashboards & Views and select Create dashboard... from the list and
define a new dashboard for Flower & Gift Shop - Operations.
2. For this dashboard, you will add three panels: two single value panels and an
events list panel. It will look like this:
2a. The first panel uses the saved search "Total views (Yesterday)" and is a
single value panel.
80
2b. The second panel uses the saved search "Failed purchases (Yesterday)" and
is a single value panel.
2c. The third panel uses the saved search "Errors (Yesterday)" and is an events
list panel.
3. Once you've added the new panels, drag the panels to rearrange them as you
see in the above screenshot.
This is your Flower & Gift Shop Operations dashboard.
View saved dashboards
After you save your dashboards, you can find them in the Search app under
Dashboards & Views:
From this list, you can also edit or manage existing dashboards.
Congratulations! You've finished the Splunk Tutorial!
81
Index New Data
About data and indexes
When you use Splunk, you are working with data in a Splunk index. In general,
this manual assumes that a Splunk admin has already added data to your Splunk
index. If this is the case, you can skip right to the "Search and investigate"
chapter in this manual.
Read on to:
• Learn about the types of data Splunk indexes.
• See how to add new data to your Splunk index.
What types of data does Splunk index
Splunk can index any IT data from any source in real time. Point your servers
or network devices' syslog at Splunk, set up WMI polling, monitor any live
logfiles, enable change monitoring on your filesystem or the Windows registry,
schedule a script to grab system metrics, and more. No matter how you get the
data, or what format it's in, Splunk will index it the same way — without any
specific parsers or adapters to write or maintain. It stores both the raw data and
the rich index in an efficient, compressed, filesystem-based datastore — with
optional data signing and auditing if you need to prove data integrity.
Ways to get data into Splunk
When adding data to Splunk, you have a variety of flexible input methods to
choose from: Splunk Web, Splunk's CLI, and the inputs.conf configuration file.
You can add most data sources using Splunk Web. If you have access to the
configuration files, you can use inputs.conf, which has more extensive
configuration options. Any changes you make using Splunk Web or the Splunk
CLI are written to inputs.conf.
The "Add data to your indexes" topic briefly outlines the general procedure for
using Splunk Web to add new data. For more specific information about
configuring inputs, see the "What Splunk can index" chapter in the Getting Data
In manual.
82
Where does Splunk store the data
You'll notice that we use the term "index" to refer to a couple of different things.
First and foremost, when Splunk indexes new data, it processes the raw data to
make it searchable. Second, when we talk about Splunk indexes, we mean the
data store where Splunk stores all or parts of the data. So, when you index new
data, Splunk stores the data in indexes. Additionally, when you search, you're
matching against data in one or multiple indexes.
Apps and inputs
When you add an input to Splunk, that input gets added relative to the app you're
in. Some apps write input data to their specific index (for example, the Splunk
App for Unix and Linux uses the 'os' index). If you're not finding data that you're
certain is in Splunk, be sure that you're searching the right index.
For the Splunk user, this is all you need to know before you begin searching and
learning more about your data. If you want to read more about managing the
data in your indexes, see the "Manage indexes" chapter in the Admin manual.
Add data to your indexes
As you read in the "About data and indexes" topic, Splunk can index logs,
configuration files, traps and alerts, messages, scripts and code, and
performance data from all your applications, servers and network devices. You
can add most of these data sources via Splunk Web.
Access the data inputs configuration page
If you have the appropriate permissions, you can view and manage all of the data
in your indexes from Splunk Manager's data inputs configuration page. To
access this page:
1. Click the Manager link on the upper right hand corner of the screen. This link
should always be available, regardless of the app you are currently in.
2. From the list of Splunk system configuration pages, click Data inputs. The
data inputs configuration page displays a table listing the type of data and a
count of the existing inputs for each type.
83
To add new data from files and directories, via TCP or UDP, or using a script,
click the appropriate Add new link.
For more specifics about data inputs and how to add them, see "What Splunk
can index" in the Getting Data In Manual.
Can't find the data you know is in Splunk?
When you add an input to Splunk, that input gets added relative to the app you're
in. Some apps write input data to their own specific index (for example, the
Splunk App for Unix and Linux uses the 'os' index). If you're not finding data that
you're certain is in Splunk, be sure that you're searching the right index.
If you add an input, Splunk adds that input to a copy of inputs.conf that
belongs to the app you're in when you add that input. This means that if you
navigated to Splunk Manager, directly from the Launcher your input will be added
to $SPLUNK_HOME/etc/apps/launcher/local/inputs.conf.
84
Search and Investigate
About search
Now you've got all that data in your system...what do you want to do with it? Start
by using Splunk's powerful search functionality to look for anything, not just a
handful of predetermined fields. Combine time and term searches. Find errors
across every tier of your IT infrastructure and track down configuration changes
in the seconds before a system failure occurs.
Splunk identifies fields from your records as you search, providing flexibility
unparalleled by solutions that require setup of rigid field mapping rulesets ahead
of time. Even if your system contains terabytes of data, Splunk enables you to
search across it with precision.
In this chapter, you will:
• Start searching with simple terms, Booleans, wildcards, and fields.
• Learn how to search interactively with Splunk Web.
• Learn how to search across one or multiple indexes.
• Learn how to search across one or multiple Splunk servers.
• Perform actions on running and completed searches.
• See how to narrow your search by changing the time range.
• Use the timeline to investigate patterns of events.
• Learn how search commands work on your data.
• Search your data in real-time and preview reports.
Note: If you want to just jump right in and start searching, see the Search
command cheat sheet for a quick reference complete with descriptions and
examples.
Event data, fields, and search
When you search in Splunk, you're matching search terms against segments of
your event data. We generally use the phrase event data to refer to your data
after it has been added to Splunk's index. Events, themselves, are a single
record of activity or instance of this event data. For example, an event might be a
single log entry in a log file. Because Splunk breaks out individual events by their
time information, an event is distinguished from other events by a timestamp.
Here's a sample event:
85
172.26.34.223 - - [01/Jul/2005:12:05:27 -0700] "GET
/trade/app?action=logout HTTP/1.1" 200 2953
Events contain pairs of information, or fields. When you add data and it gets
indexed, Splunk automatically extracts some useful fields for you, such as the
host the event came from and the type of data source it is.
You can use field names (sometimes called attributes or keys) and field values to
narrow your search for specific event data. For more information about fields, see
the Data interpretation: Fields and field extractions chapter in the Knowledge
Manager manual, beginning with the "About fields" topic.
Search and knowledge
As you search, you may begin to recognize patterns and identify more
information that could be useful as searchable fields. You can configure Splunk
to recognize these new fields as you index new data or you can create new fields
as you search. Whatever you learn, you can use, add, and edit this knowledge
about fields, events, and transactions to your event data. This capturing of
knowledge helps you to construct more efficient searches and build more
detailed reports.
For more information about capturing knowledge from your event data and
adding information from external sources, see the "Capture knowledge" chapter
in this manual.
Use the CLI to search
This chapter discusses search using Splunk Web. You can also execute
searches on your Splunk server using the command line interface (CLI). For
more information, you can read "About the CLI" and "Get help with the CLI" in the
Admin manual.
Searching in Splunk
The first time you use Splunk, you'll probably start by just searching the raw data
to investigate problems — whether it's an application error, network performance
problem, or security alert. Searching in Splunk is free form -- you can use familiar
Boolean operators, wildcards and quoted strings to construct your searches.
Type in keywords, such as a username, an IP address, a particular message...
You're never limited to a few predetermined fields and you don't need to confront
86
a complicated query builder, learn a query language, or know what field to search
on. You can search by time, host and source.
This topic discusses how to start searching in Splunk Web from the Search app
and by typing into the search bar. The following examples use Web access logs
that contain the following information: IP addresses, browser versions, Web
request protocols, HTTP status codes, website URLs, etc. Each of these
examples stand alone; however, you can read the "Start searching tutorial" and
"Use fields to search tutorial" for a more complete example.
Check the Search Reference Manual if you're looking for a reference for the
commands in the Splunk search language or the Search command cheatsheet.
Go to the Search app
After logging into Splunk, you will see either the Welcome view or Splunk Home
view.
• If you're in the Welcome view, select Launch search app.
• If you're in Splunk Home, select Search.
• If you are in another app, select the Search app from the App menu,
which is located in the upper right corner of the window.
This takes you to the Summary dashboard of the Search app. For more
information about what you will find in the Search App, read the Search App
tutorial before you continue.
Start with simple terms
To begin your Splunk search, type in terms you might expect to find in your event
data. For example, if you want to find events that might be HTTP 404 errors, type
in the keywords:
http 404
Your search results are all events that have both HTTP and 404 in the raw text;
this may or may not be exactly what you want to find. For example, your search
results will include events that have website URLs, which begin with "http://", and
any instance of "404", including a string of characters like "ab/404".
You can narrow the search by adding more keywords:
http 404 "not found"
87
Enclosing keywords in quotes tells Splunk to search for literal, or exact, matches.
If you search for "not" and "found" as separate keywords, Splunk returns events
that have both keywords, though not necessarily the phrase "not found".
You can also use Boolean expressions to narrow your search further.
Add Boolean expressions
Splunk supports the Boolean operators: AND, OR, and NOT; the operators have to
be capitalized. You can use parentheses to group Boolean expressions. For
example, if you wanted all events for HTTP client errors not including 404 or 403,
search with:
http client error NOT (403 OR 404)
In a Splunk search, the AND operator is implied; the previous search is the
same as:
http AND client AND error AND NOT (403 OR 404)
This search returns all events that have the terms "HTTP", "client", and "error"
and do not have the terms "403" or "404". Once again, the results may or may
not be exactly what you want to find. Just as the earlier search for http 404 may
include events you don't want, this search may both include events you don't
want and exclude events you want.
Note: Splunk evaluates Boolean expressions in the following order: first,
expressions within parentheses; then, OR clauses; finally, AND or NOT clauses.
Search with wildcards
Splunk supports the asterisk (*) wildcard for searching. Searching for * by itself
means "match all" and returns all events up to the maximum limit. Searching for *
as part of a word matches based on that word.
The simplest beginning search is the search for *. Because this searches your
entire index and returns an unlimited number of events, it's also not an efficient
search. We recommend that you begin with a more specific search on your
index.
If you wanted to see only events that matched HTTP client and server errors, you
might search for:
http error (4* OR 5*)
88
This indicates to Splunk that you want events that have "HTTP" and "error" and
4xx and 5xx classes of HTTP status codes. Once again, though, this will result in
many events that you may not want. For more specific searches, you can extract
information and save them as fields.
Search with fields
When you index data, Splunk automatically adds fields to your event data for
you. You can use these fields to search, edit the fields to make them more
useful, extract additional knowledge and save them as custom fields. For more
information about fields and how to use, edit, and add fields, read the "Capture
Knowledge" chapter in this manual.
Splunk lists fields that it has extracted in the Field Picker to the left of your search
results in Splunk Web. Click a field name to see information about that field, add
it to your search results, or filter your search to display only results that contain
that field. When you filter your search with a field from the Field Picker, Splunk
edits the search bar to include the selected field.
Alternately, you can type the field name and value directly into your search bar. A
field name and value pair can be expressed in two ways:
fieldname="fieldvalue" or fieldname=fieldvalue.
Note: Field names are case sensitive.
Let's assume that the event type for your Web access logs is
eventtype=webaccess and you saved a field called status for the HTTP status
codes in your event data. Now, if you wanted to search for HTTP 404 errors, you
can restrict your search to the specific field:
status=404
Use wildcards to match multiple field values
If you're interested in seeing multiple values for the status field, you can use
wildcards. For example, to search for Web access events that are HTTP client
errors (4xx) or HTTP server errors (5xx), type:
eventtype=webaccess status=4* OR status=5*
Use comparison operators to match field values
You can use comparison operators to match a specific value or a range of field
values. Comparison operators only when when searching with field/value pairs.
89
• Comparison expressions with = and != work with all field/value pairs,
including multivalued fields.
• Comparison expressions with <, <=, >, and >= work only with fields that
have numeric values.
Operator Example
Result
=
field=foo
Field values that exactly match "foo".
!=
field!=foo
Field values that don't exactly match "foo".
<
field<x
Numerical field values that are less than x.
>
field>x
Numerical field values that are greater than x.
<=
field<=x
Numerical field values that are less than and equal to x.
>=
field>=x
Numerical field values that are greater than and equal to x.
This example searches for a range of client and server errors from 400 to 503,
inclusive.
eventtype=webaccess status>400 OR status<=503
This example searches for all web access events, counts them, and then only
returns the errors that have a count greater than 10.
eventtype=webaccess | stats count by host, status | search count > 10
Match phrases with the TERM() directive
When searching for phrases in your events, you can also use the TERM()
directive. TERM forces Splunk to match whatever is inside the parentheses as a
single term in the index, even if it contains characters that are usually recognized
as breaks or delimiters (such as underscores and spaces).
If you searched for the quoted phrase "error_type", Splunk ends up searching for
"error" and "type" and post filtering the results. This would also include events
that contained "error_type" as segments of other keywords or phrases, for
example "error_type.default" or "this_error_type". If you use TERM(error_type),
you force Splunk to exclude these other keywords.
This example searches for a specific IP address:
TERM(srcip=192.168.12.34) OR srcip=TERM(*192.168.12.34)
90
Use search actions
Perform actions on running searches
Splunk provides a set of controls that you can use to manage "in process"
searches. It displays these controls as blue buttons below the search bar while a
search is running. The controls include:
• Send to background: Sends a search "to the background" while you
work on other projects in the foreground, and has the system notify you
when a backgrounded search is complete. You can use the Jobs page to
access backgrounded search jobs and review their results.
• Pause/Resume: Pauses a search in progress. Useful when you're running
a long search but want to put it on hold momentarily. Click Resume to
keep searching or Finalize to finalize the search (see below).
• Finalize: Stops a search before it completes. Splunk will display the
results that it has retrieved up to that point. You can use the finalized
results to build a report.
• Cancel: Cancels searches in progress and deletes all results. Splunk lists
recently canceled searches in the Jobs page, but, because their results
are deleted, it does not provide a view link for them.
• Job Inspector: Opens the Search Job Inspector, a tool which lets you
take a closer look at what your search is doing and see where Splunk is
spending most of its time. You can select this action while the search is
running or after it completes. For more information, see "About the Search
Job Inspector".
• Print: Once the search has completed, enables you to print the resulting
timeline and events list on your current page.
For more information about using the Jobs page to track searches that have
been backgrounded, canceled, or which are running for alerting purposes see
"Supervise Your Search Jobs" in this manual.
91
Save searches and create reports
Splunk also provides options to save your searches and create reports. It
displays these options listed when you click the green buttons below the search
bar.
Save options include:
• Save search...: Saves the search, so you can easily run the search again
without having to retype the search string. For more information, see
"Save searches and share search results" in this manual.
• Save results: Saves the results of the search and enables you to retrieve
them from the Jobs manager.
• Save & share results: Saves the results of the search and provides a url
that enables you to share the results. For more information, see "Save
searches and share search results".
Create options enables you to create:
• Dashboard panel...: Click this if you'd like to generate a dashboard panel
based on your search and add it to a new or existing dashboard. Learn
more about dashboards in "Create and edit simple dashboards" in this
manual.
• Alert... Click to define an alert based on your search. Alerts run saved
searches in the background (either on a schedule or in real time). When
the search returns results that meet a condition you have set in the alert
definition, the alert is triggered. For more information, see "Create an
alert" in this manual.
• Report...: If you're dealing with a long search and don't want to wait until
the search completes to start defining a report based on it, click this to
launch the Report Builder and give yourself a head start. The search
continues running after the Report Builder is launched, and the finished
report covers the full range of the event data returned. For more
information, see "Define reports" in this manual.
• Event type... Event types let you classify events that have common
characteristics. If the search doesn't include a pipe operator or a
subsearch , you can use this to save it as an event type. For more
information, see "About event types" and "Define and maintain event types
in Splunk Web".
• Scheduled search... Select this to schedule the search, define alert
actions, and sharing settings. For more information, see "Monitor recurring
situations".
92
Search interactively with Splunk Web
Both the raw results and timeline are interactive, so you can click to drill down to
events of interest, focus on anomalies, or eliminate noise to find the needle in a
haystack. Whether you're troubleshooting a customer problem or investigating a
security alert, you'll get to the bottom of what happened in minutes rather than
hours or days.
In this topic, you'll learn how to:
• Use search results to narrow your search.
• Use the fields picker to add search terms.
• Use the Search assistant to help construct your searches.
• Use the Show source window to view raw events.
Use search results to narrow your search
Anytime after you run a search, you can highlight and select segments from your
search results to add, remove, and exclude those keywords quickly and
interactively.
Add new terms to your search
Fields and terms that you include in your search string will appear highlighted in
the list of search results. Certain segments (words or phrases) in your search
results will highlight as you move your mouse over the list; this indicates that you
can add these terms to your search. To add any one of these other segments
into your search, click it. Your search updates and filters out all the previous
results that don't match.
For example, while searching for Web access events that are errors:
eventtype=webaccess errors
Perhaps, you notice one particular host machine, alpha, appears more frequently
than others. You decide to just focus on this host. Instead of typing host=alpha
into your search bar, you highlight one occurrence of the field value and click.
Your search string automatically appends the new filter and your search results
update to reflect the new search:
eventtype=webaccess errors host=alpha
93
Remove existing terms from your search
Just as easily as you can add new search terms to your search, you can remove
search terms. To do so, click on any of the highlighted segments in your list of
search results.
For example, if you searched for Web access errors on a machine called alpha:
eventtype=webaccess errors host=alpha
Then, as you scroll through your results, you decide that you want to see what
other Web access activity has occurred on alpha. To do this quickly and without
having to edit your search string, you click on one highlighted occurrence of the
term "errors" in your results. Your search string and results automatically update
to match:
eventtype=webaccess host=alpha
Exclude terms from your search
As you scroll through the list of your search results, you may also notice events
that are of no interest to you in your current investigation. To eliminate this noise
without manually typing anything into your search bar, use alt-click (for
Windows, use ctrl-click). Splunk updates your search to exclude the term you
selected.
For example, if you searched for all Web access errors:
eventtype=webaccess errors
Then, you decide that you don't want to see any events from alpha; alt-click (or
ctrl-click) on the host value in your results. Your search bar updates to read:
eventtype=webaccess errors NOT host=alpha
All events from alpha are removed from your list of search results.
Add search terms from available fields
Splunk automatically extracts fields from your data when you add it to your index.
After you run a search, you'll notice that only three of these default fields display
in your event data: host, sourcetype, and source. You can view all the other fields
that Splunk identified (if they exist in these search results) and select to make
them visible in your event data as well.
In the Search view, the field sidebar is on the left and underneath the Timeline.
After you run a search, this sidebar contains the list of fields that are visible in
94
your search results.
Click "Pick fields" underneath the Timeline, to open the Fields popup window. In
the Fields window, you can view all the fields that are available in your search
results. Select fields from this list to make visible in your search results.
To hide fields (that are already visible), you can click on them in the "Available
Fields" list or the "Selected Fields" list. Click "Save" and you'll see your changes
applied to the event data in your search results.
Use Search assistant to help construct your searches
Search assistant is a quick reference for users who are constructing searches.
By default, search assistant is active; whenever you type terms into the search
bar, it will give you typeahead information. When you type in search commands,
it will give you descriptions and examples of usage for the command. You can
access the search assistant within Splunk Web; click the green down-arrow
under the search bar.
The default view displays a short description, some examples, common usage,
and common next command. If the search bar is empty (there is no search
command in it), Search assistant displays information for the search command.
You can also see lists of common usage and common next commands and
expand the lists by clicking the more links next to the headers. When you click
on any item in the lists, Splunk appends it to your search.
To see more information, click the more >> link at the end of the short
description. This detailed view contains a longer description, command syntax,
and related commands (if they are relevant). To return to the default view, click
<< less.
Note: You can use the search assistant to quickly access the search command
documentation; just click the help link next to the search command. This opens
the search command's reference page in a new browser tab.
Use show source to view the raw event
After you run a search, you may want to view a particular result's raw format. To
do this, click on the dropdown arrow at the left of the search result and select
"Show Source". The Show source window opens and displays the raw data for
the event you selected and some surrounding events.
95
You can also use the Show source window to view the validity of your indexed
data. When you open Show source, the event that you selected to view is
highlighted in yellow. Events highlighted in pink contain gaps in the data. Events
highlighted in red may have been tampered with and are not valid. For example,
if your data was tampered with, it may be indexed out of order and thus contain
gaps.
Turn field discovery off to improve search performance
If you are running a search that ordinarily takes a long time to complete, you can
set the Field discovery toggle to Off to make the search run faster.
The tradeoff is that turning off Field discovery disables automatic field
extraction, except for fields that are required to fulfill your search (such as fields
that you are specifically searching on) and default fields such as _time, host,
source, and sourcetype. The search runs faster because Splunk is no longer
trying to extract every field possible from your events.
Field discovery is set to On by default. You should leave it on if you don't know
what fields exist in your data and think you might need them to help you narrow
down your search in some way.
For more information about searching with fields, see the Capture Knowledge
chapter of this manual. For general information about fields and field extraction,
see "About fields" in the Knowledge Manager Manual.
Change the time range to narrow your search
Time is crucial for determining what went wrong ? you often know when. Looking
at events that happened around the same time can help correlate results and find
the root cause. Having an overly-broad time range wastes system resources and
will produce more results than you can handle.
Adding a time range to your search is as simple as selecting it from a list of time
ranges provided (for example, Last business week) or including the attributes in
96
your search string (for example, earliest="-15m" starts your search fifteen
minutes ago). This topic discusses how to add time to your search by:
• Selecting it from the time range menu.
• Adding attributes earliest and latest to your search.
Select time ranges to apply to your search
Use the time range picker dropdown to specify the time period you want to run
your search. If you want to specify a custom date range, select Custom time...
from the dropdown menu.
Then, select "Date" in the popup window. You can enter the date range manually
or use the calendar pop-up.
For example, if you were interested in only events that occurred during the
second business quarter, April through June, you might select the date range:
The time range menu indicates the date range that you selected. Notice also that
the timeline only shows the selected date range:
Note: If you are located in a different timezone from your server, time-based
searches use the timestamp of the event from the server where it is indexed.
97
Customize the time ranges you can select
Splunk now ships with more built-in time ranges. Splunk administrators can also
customize the set of time ranges that you view and select from the drop down
menu when you search. For more information about configuring these new time
ranges, see the times.conf reference in the Admin Manual.
Specify absolute time ranges in your search
When searching or saving a search, you can specify time ranges using the
following attributes:
earliest=<time_modifier>
latest=<time_modifier>
For exact time ranges, the syntax of time_modifier is: %m/%d/%Y:%H:%M:%S. For
example, to specify a time range from 12AM October 19, 2009 to 12AM October
27, 2009:
earliest=10/19/2009:0:0:0 latest=10/27/2009:0:0:0
If you specify only the "earliest" attribute, "latest" is set to the current time (now)
by default. In general, you won't specify "latest" without an "earliest" time.
When you specify a time range in your search or saved search, it overrides
the time range that is selected in the dropdown menu. However, the time
range specified directly in the search string will not apply to subsearches (but the
range selected from the dropdown will apply).
Specify relative time ranges in your search
You can also use the earliest and latest attributes to specify relative time
ranges using the syntax described as follows. Also, you can specify the time
ranges in your search string or using the time range picker.
Syntax for relative time modifiers
You can define the relative time in your search with a string of characters that
indicate time amount (integer and unit) and, optionally, a "snap to" time unit:
[+|-]<time_integer><time_unit>@<time_unit>. Also, when specifying relative
time, you can use now to refer to the current time.
98
1. Begin your string with a plus (+) or minus (-) to indicate the offset of the time
amount.
2. Define your time amount with a number and a unit. When you specify single
time amounts, the number is implied: 's' is the same as '1s', 'm' is the same as
'1m', etc. The supported time units are:
• second: s, sec, secs, second, seconds
• minute: m, min, minute, minutes
• hour: h, hr, hrs, hour, hours
• day: d, day, days
• week: w, week, weeks
• month: mon, month, months
• quarter: q, qtr, qtrs, quarter, quarters
• year: y, yr, yrs, year, years
3. You can also specify a "snap to" time unit to indicate the nearest or latest time
to which your time amount rounds down. To do this, separate the time amount
from the "snap to" time unit with an "@" character.
You can define the relative time modifier as only a "snap to" time unit. For
example, to "snap to" a specific day of the week, use @w0 for Sunday, @w1 for
Monday, etc.
If you don't specify a "snap to" time unit, Splunk snaps automatically to the
second.
Special time units
These abbreviations are reserved for special cases of time units and snap time
offsets.
Time Unit
0
Description
(and latest!=0), the start time of your
search is UTC epoch 0.
When earliest=0
When earliest=0 and latest=now or latest=<a large
number>, the search will run over all time. The difference is
that:
• Specifying latest=now (which is the default) does not
return future events.
99
• Specifying latest=<a big number> returns future
events.
Note: Future events refer to events that contain timestamps
later than the current time, now.
now
The current time.
@q, @qtr, or
@quarter
Specify a snap to the beginning of the most recent quarter: Jan 1, Apr 1,
July 1, or Oct 1.
rt
Specify a real-time search time window.
w0, w1, w2, w3,
w4, w5, and w6
days of the week; where w0 is Sunday, w1
is Monday, etc. When you snap to a week, @w or @week, it is
equivalent to snapping to Sunday or @w0.
Specify "snap to"
More about snap-to-time
When snapping to the nearest or latest time, Splunk always snaps backwards
or rounds down to the latest time not after the specified time. For example, if it is
11:59:00 and you "snap to" hours, you will snap to 11:00 not 12:00.
If you don't specify a time offset before the "snap to" amount, Splunk interprets
the time as "current time snapped to" the specified amount. For example, if it is
currently 11:59 PM on Friday and you use @w6 to "snap to Saturday", the
resulting time is the previous Saturday at 12:01 AM.
Define custom relative time ranges
1. From the time range picker, select Custom time...
2. Select Relative from the Range Type options.
3. Enter an Earliest time value.
Note: You can also use this window to see the Search language equivalent of
100
your earliest time value and the Effective range that it translates to in Splunk.
Examples of relative time modifiers
For these examples, the current time is Wednesday, 05 February 2009, 01:37:05
PM. Also note that 24h is usually but not always equivalent to 1d because of
Daylight Savings Time boundaries.
Time
modifier
Description
Equivalent
modifiers
Resulting time
now
Now, the current time
Wednesday, 05 February
2009, 01:37:05 PM
now
-60m
60 minutes ago
Wednesday, 05 February
2009, 12:37:05 PM
-60m@s
-1h@h
1 hour ago, to the hour
Wednesday, 05 February
2009, 12:00:00 PM
-1d@d
Yesterday
Tuesday, 04 February 2009,
12:00:00 AM
-24h
24 hours ago (yesterday)
Tuesday, 04 February 2009,
01:37:05 PM
-7d@d
7 days ago, 1 week ago
today
Wednesday, 28 January
2009, 12:00:00 AM
-7d@m
7 days ago, snap to
minute boundary
Wednesday, 28 January
2009, 01:37:00 PM
@w0
Beginning of the current
week
Sunday, 02 February 2009,
12:00:00 AM
+1d@d
Tomorrow
Thursday, 06 February 2009,
12:00:00 AM
+24h
24 hours from now,
tomorrow
Thursday, 06 February 2009,
+24h@s
01:37:05 PM
-24h@s
Examples of chained relative time offsets
You can also specify offsets from the snap-to-time or "chain" together the time
modifiers for more specific relative time definitions.
Time
modifier
Description
Resulting time
@d-2h
Snap to the beginning of today (12AM) and
subtract 2 hours from that time.
10PM last night.
-mon@mon+7d
One month ago, snapped to the first of the month
at midnight, and add 7 days.
The 8th of last month
(at 12AM).
101
Examples of searches with relative time modifiers
Example 1: Web access errors from the beginning of the week to the current
time of your search (now).
eventtype=webaccess error earliest=@w0
This search returns matching events starting from 12:00 AM of the Sunday of the
current week to the current time. Of course, this means that if you run this search
on Monday at noon, you will only see events for 36 hours of data.
Example 2: Web access errors from the current business week (Monday to
Friday).
eventtype=webaccess error earliest=@w1 latest=+7d@w6
This search returns matching events starting from 12:00 AM of the Monday of the
current week and ending at 11:59 PM of the Friday of the current week.
If you run this search on Monday at noon, you will only see events for 12 hours of
data. Whereas, if you run this search on Friday, you will see events from the
beginning of the week to the current time on Friday. The timeline however, will
display for the full business week.
Example 3: Web access errors from the last full business week.
eventtype=webaccess error earliest=-7d@w1 latest=@w6
This search returns matching events starting from 12:00 AM of last Monday and
ending at 11:59 PM of last Friday.
Use the timeline to investigate patterns of events
The timeline is a visual representation of the number of events that occur at each
point in time. It shows the distribution of events over time. Mouseover a bar to
see the count of events. Click on a bar to drill-down to that time. Drilling down in
this way does not run a new search, it just filters the results from the previous
search. You can use the timeline to highlight patterns or clusters of events or
investigate peaks (spikes in activity) and lows (possible server downtime) in
event activity.
The timeline options are located above the timeline. You can zoom in and zoom
out and change the scale of the chart. Collapsing the time line is handy if you
102
want more room for events and are not concerned with the time line. Click to
restore it when you are.
Change the scale of the timeline
You can view the timeline on two scales: linear or logarithmic (log).
The following image shows the search results for all events in the second quarter
on a linear scale.
The following image shows the same search results for all events in the second
quarter on a log scale.
103
Zoom in and zoom out to investigate events
Zoom in and out changes the time focus; for example, zooming in will change
timeline bars from hours to minutes. Clicking the bar drills down to events that
minute. Zooming out pulls up a level to see events over hours or days instead of
minutes.
Click and drag your mouse over a cluster of bars in the timeline.
• Your search results update to display only the events that occurred in that
selected time range.
• If you click zoom in, the timeline updates to display only the span of
events that you selected.
Click on one bar in the timeline.
• Your search results update to display only the events that occur at that
selected point.
• Once again, if you click zoom in, the timeline updates to display only the
events in that selected point.
If you want to select all the the bars in the timeline (undo your previous selection)
click select all. This option is only available after you've selected one or more
bars and before you selected either zoom in or zoom out.
104
Search and report in real time
With real-time searches and reports, you can search events before they are
indexed and preview reports as the events stream in. This topic discusses:
• The mechanics behind real-time search and time range windows.
• How to invoke real-time search in Splunk Web and the CLI.
• Performance considerations for real-time searches and reports.
• How to disable real-time search in indexes.conf.
• How to set search and indexer limits on real-time searches.
You can design alerts based on real-time searches that run continuously in the
background. Such real-time alerts can provide timelier notifications than alerts
that are based on scheduled searches. For more information, see the "Create
an alert" topic, in this manual.
You can also display real-time search results and reports in your custom
dashboards using the visual dashboard editor and simple XML. For more
information about the visual dashboard editor, see "Create simple dashboards
with the visual dashboard editor" in this manual.
For more information about using real-time dashboards with advanced features
that go beyond what the visual dashboard editor can provide, see Build a
real-time dashboard in the Developer manual.
Note: When Splunk is used out-of-the-box, only users with the Admin role can
run and save real-time searches. For more information on managing roles and
assigning them to users, see "Add and edit roles" in the Admin Manual.
Real-time search mechanics
Real-time searches search through events as they stream into Splunk for
indexing. When you kick off a real-time search, the Splunk scans incoming
events that contain index-time fields that indicate they could be a match for your
search. Splunk identifies these events in the UI as scanned events. This number
is cumulative and represents the sum of all events scanned since the search was
launched.
As the real-time search runs, Splunk periodically evaluates the scanned events
against your search criteria to find actual matches. These events are identified in
105
the UI as matching events. This number represents the number of matching
events that currently exist within the sliding time range window that you have
defined for the search. As such it can fluctuate up or down over time as Splunk
discovers matching events at a faster or slower rate. If you are running the
search in Splunk Web, the search timeline also displays the matching events that
the search has returned within the chosen time range.
Here's an example of a real-time search with a one minute time range window. At
the point that this screen capture was taken, the search had scanned a total of
3,105 events since it was launched. The matching event count of 558 represents
the number of events matching the search criteria that had been identified in the
past minute. This number fluctuated between 530 and 560 for the following
minute; if it had spiked or dropped dramatically, that could have been an
indication that something interesting was happening that required a closer look.
As you can see, the newest events are on the right-hand side of the timeline. As
time passes, they move right until they move off the left-hand side, disappearing
from the time range window entirely.
A real-time search should continue running until you or another user stops it or
deletes the search job; it should not "time out" for any other reason. If your
events are stopping it could be a performance-related issue (see the subtopic
"Expected performance and known limitations," below).
Real-time searches can take advantage of all Splunk search functionality,
including advanced functionality like lookups, transactions, and so on. We've also
designed search commands that are to be used specifically in conjunction with
real-time searches, such as streamstats and rtorder.
Real-time searches in Splunk Web
You run a real-time search and build a real-time report in exactly the same way
you run standard searches. However, because you are searching a live and
continuous stream of data, the timeline updates as the events stream in and you
106
can only view the report in preview mode. Also, some search commands are
more applicable to real-time searches than standard searches. For example,
streamstats and rtorder were designed for use in real-time searches.
To kick off a real-time search in Splunk Web, use the time range menu to select
a preset Real-time time range window, such as 30 seconds or 1 minute. You
can also specify a sliding time range window to apply to your real-time search.
Run this search to see pageview events as they stream in.
eventtype="pageview"
The raw events that are streamed from the input pipeline are not time-ordered.
You can use the rtorder command to buffer the events from a real-time search
and emit them in ascending time order.
The following example keeps a buffer of the last 5 minutes of pageview events,
emitting events in ascending time order once they are more than 5 minutes old.
Newly received events that are older than 5 minutes are discarded if an event
after that time has already been emitted.
eventtype="pageview" | rtorder discard=t buffer_span=5m
Real-time search relies on a stream of events. Thus, you cannot run a real-time
search with any other leading search command, such as | metadata which does
not produce events or | inputcsv which just reads in a file. Also, if you try to
send the search results to | outputcsv, the CSV file will not be written until the
real-time search is Finalized.
Real-time reports in Splunk Web
Run a report to preview the IP addresses that access the most web pages. In this
case, the top command returns a table with three columns: clientip, count, and
percent. As the data streams in, the table updates with new values.
eventtype="pageview" | top clientip
For each pageview event, add a count field
that represents the number of events
seen so far (but do not include the current event in the count).
eventtype="pageview" | streamstats count current=false
You can also drilldown into real-time reports. However, real-time drilldown does
not spawn another real-time search. Instead, it spawns a historic search, as you
will drilldown into the events that have already been retrieved and indexed. For
more information, see Understand table and chart drilldown actions in the User
manual.
107
Real-time searches and reports in the CLI
To run a real-time search in the CLI, replace the command "search" with
"rtsearch":
./splunk rtsearch 'eventtype=pageview'
Use the highlight command to emphasize terms in your search results. The
following example highlights "GET" in your page view events:
./splunk rtsearch 'eventtype=pageview | highlight GET'
By default, search results have line wrapping enabled. Use the -wrap option to
turn off line wrapping:
./splunk rtsearch 'eventtype=pageview' -wrap 0
Real-time reports in the CLI will also display in preview mode and update as the
data streams in.
./splunk rtsearch 'error | top clientip'
Use the -preview option to suppress the results preview:
./splunk rtsearch 'error | top clientip' -preview false
If you turn off preview, you can still manage (Save, Pause, Finalize, or Delete)
the search from the Jobs page in Splunk Web. After you finalize the search, the
report table will display. For more information, see "Manage your search jobs" in
this manual.
You can view all CLI commands by accessing the CLI help reference. For more
information, see "Get help with the CLI" in this manual.
Specify real-time time range windows
Time bounds for historical searches are set at the time the search runs. With
real-time searches, the time bounds are constantly updating and by default, the
results accumulate from the start of the search. You can also specify a time
108
range that represent a sliding window of data, for example, the last 30 seconds.
When you specify a sliding window, Splunk takes that amount of time to
accumulate data. For example, if your sliding window is 5 minutes, you will not
start to see data until after the first 5 minutes have passed. You can override this
behavior so that Splunk backfills the initial window with historical data before
running in the normal real-time search mode (see "Real-time backfill," below).
You can specify real-time windows with pre-configured options listed in the time
range picker, or by defining a custom real-time window in the time range picker.
Time ranges for real-time search follow the same syntax as for historical
searches, except that you precede the relative time specifier with "rt", so that it's
rt<time_modifier>.
The syntax for real-time time modifiers is:
rt[+|-]<time_integer><time_unit>@<time_unit>.
Read about the syntax for
time modifiers in the topic, Change the time range of your search.
These values are not designed to be used from within the search language. They
are configuration values that you can specify in the time range picker when you
select Custom > Real-time. Also, you can use them in times.conf (to add options
to the time range picker), or in the saved search dialog, or if you were directly
using the REST API to access the Splunk back end search engine.
When you use time range windows with real-time searches, some of the
events that occur within the latest second may not display in Splunk. This is
expected behavior and is due to the latency between the timestamps within the
events and the time when the event arrives. Because the time range window is
with respect to the timestamps within the events and not the time when the event
arrives, events that arrive after the time window won't display.
Real-time searches over "all time"
It's important to keep in mind that there is a small difference between real-time
searches that take place within a set time window (30 seconds, 1 minute, 2
hours) and real-time searches that are set to "all time."
• In "windowed" real time searches, the events in the search can
disappear as they fall outside of the window, and events that are newer
than the time the search job was created can appear in the window when
they occur.
• In "all-time" real-time searches, the window spans all of your events, so
events do not disappear once they appear in the window, but events that
109
are newer than the time the search job was created can appear in the
window as they occur.
• In comparison, in standard searches, events never disappear from within
the set range of time that you are searching and the latest event is always
earlier than the job creation time (with the exception of searches that
include events that have future-dated timestamps).
Real-time backfill
For real-time windowed searches, you can specify that Splunk backfill the initial
window with historical data. This is run as a single search, just in two phases:
first, a search on historical data to backfill events; then, a normal real-time
search. Real-time backfill ensures that real-time dashboards seeded with data on
actual visualizations and statistical metrics over time periods are accurate from
the start.
You can enable real-time backfill in limits.conf in the [realtime] stanza:
[realtime]
default_backfill = <bool>
* Specifies if windowed real-time searches should backfill events
* Defaults to true
Expected performance and known limitations
Splunk's performance is expected to be acceptable as long as the indexers are
not currently heavily loaded and do not have more than a few concurrent
real-time searches. However, real-time searches will have a significant impact on
performance in high volume environments and network load when you have
many concurrent real-time searches.
You can run multiple real-time and historical searches concurrently, within
the limits of your hardware. There are no restrictions on separate searches for
the same or different users.
When planning your real-time searches, you should consider how it will affect the
performance of both:
• The indexer that must forward the live events
• The searcher that must process the live events
110
The more work that is done on the indexer, the less that is required on the
searcher, and vice versa. The indexer is important to the overall system function,
so you do not want to burden it with too much filtering of live events. However, if
the indexer does not filter at all, the bandwidth required to send all the live events
to the searcher may prove costly, especially when multiple real-time searches
running concurrently.
In the case where the searcher can't keep up with the indexer, the queue on
the index processor will drop events. However, the events will have a
sequence number, so we can tell when and how many events were dropped.
How to disable real-time search
Disable real-time search in indexes.conf
Searching in real time may be very expensive on the indexer. If you want to
disable it on an indexer, you can edit a [default] setting in that indexer's
indexes.conf.
[default]
enableRealtimeSearch = <bool>
Note: A search head that connects to multiple indexers will still be able to get
real-time search results from the indexers that do have it enabled.
Disable real-time search for a user or role
Real-time search is a capability that you can map to specific users or roles in
Splunk Web from Manager > Access Controls. By default, the rtsearch
capability is assigned to the Admin and Power roles and not the User role. A role
without the rtsearch capability will not be able to run a real-time search on that
search head, regardless what indexers that search head is connected to.
Setting search limits on real-time searches
You can use the [search] stanza in limits.conf to change the maximum
number of real-time searches that can run concurrently on your system.
[search]
max_rt_search_multiplier = <decimal number>
realtime_buffer = <int>
111
max_rt_search_multiplier
• A number by which the maximum number of historical searches is
multiplied to determine the maximum number of concurrent real-time
searches. Defaults to 3.
• Note: The maximum number of real-time searches is computed as:
max_rt_searches = max_rt_search_multiplier x max_hist_searches
realtime_buffer
• The maximum number of accessible events to keep for real-time searches
from the UI. Must be >= 1. Defaults to 10000.
• The real-time buffer acts as a circular buffer once this limit is reached.
Setting indexer limits for real-time search
You can use the [realtime] stanza in limits.conf to change the default settings
for indexer support of real-time searches. These options can be overridden for
individual searches via REST API arguments.
[realtime]
queue_size = <int>
blocking = [0|1]
max_blocking_secs = <int>
indexfilter = [0|1]
queue_size = <int>
• The size of queue for each real-time search. Must be > 0.
• Defaults to 10000.
blocking =[0|1]
• Specifies whether the indexer should block if a queue is full.
• Defaults to false (0).
max_blocking_secs = <int>
• The maximum time to block if the queue is full. This option is meaningless,
if blocking = false.
• Means "no limit" if set to 0.
• Defaults to 60.
indexfilter = [0|1]
112
• Specifies whether the indexer should pre-filter events for efficiency.
• Defaults to true (1).
Specify one or multiple indexes to search
You have always been able to create new indexes and manage where you want
to store your data. Now, when you have data split across different indexes, you're
no longer limited to searching one index at a time — you can search across
multiple indexes at once!
The Splunk administrator can set the default indexes that a user searches.
Based on the user's roles and permissions, he may have access to one or many
indexes; for example the user may only be able to search main or all public
indexes. The user can then specify a subset of these indexes, either an individual
index or multiple indexes, to search. For more information about setting up users
and roles, see the "About users and roles" chapter in the Admin manual.
For more information about managing your indexes and setting up multiple
indexes, see the "About managing indexes" chapter in the Admin manual.
Control index access via Splunk Web
Navigate to 'Manager >> Access controls >> Roles'. Select the role that the User
has been assigned to and then on the bottom of the next screen you'll find the
index controls. You can control the indexes that particular role has access to, as
well as the default search indexes.
Syntax
You can specify different indexes to search in the same way that you specify field
names and values. In this case, the field name is index and the field value is the
name of a particular index:
index=<indexname>
Note: When you type "index=" into the search bar, typeahead displays all the
indexes that you can search, based on your roles and permissions settings.
Alternatively, you can specify indexes to exclude from your search using
"index!=". When you specify indexes to exclude, all indexes are scanned to know
which ones to exclude.
113
You can use the * wildcard to specify groups of indexes; for example, if you
wanted to search both "mail" and "main" indexes, you can search for:
index=mai*
You can also use parentheses to partition different searches to certain indexes.
See Example 3 for details.
Examples
Example 1: Search across all public indexes.
index=*
Example 2: Search across all indexes, public and internal.
index=* OR index=_*
Example 3: Partition different searches to different indexes; in this example,
you're searching three different indexes: main, _internal, and mail. You want to
see events that match "error" in all three indexes; but also, errors that match
"warn" in main or "failed" in mail.
(index=main (error OR warn)) OR (index=_internal error) OR (index=mail
(error OR failed))
Example 4: Search across multiple indexes on different distributed Splunk
servers.
(splunk_server=local index=main 404 ip=10.0.0.0/16) OR
(splunk_server=remote index=mail user=admin)
Not finding the events you're looking for?
When you add an input to Splunk, that input gets added relative to the app you're
in. Some apps write input data to their own specific index (for example, the
Splunk App for Unix and Linux uses the 'os' index).
If you're not finding data that you're certain is in Splunk, be sure that you're
looking at the right index. You might need to add an app-specific index to the list
of default indexes for the role you're using. For more information about roles,
refer to the topic about roles in this manual.
Search across one or more distributed search
peers
114
When performing a distributed search from a search head, you can restrict your
searches to specific search peers (also known as "indexer nodes") by default and
in your saved and scheduled searches. The names of your Splunk search peers
are saved as values in the "splunk_server" field. For more information about
distributed search, see "What is distributed search?" in the Distributed
Deployment manual.
If no search peer is specified, your search accesses all search peers you have
permission to access. The default peers that you can access are controlled by
the roles and permissions associated with your profile and set by your Splunk
admin. For more information, see "About users and roles" in the Admin manual.
The ability to restrict your searches to specific peers can be useful when there is
high latency to certain search peers and you do not want to search them by
default. When you specify one or more peers, those are the only servers that are
included in the search.
You can specify different peers to search in the same way that you specify other
field names and values. In this case, the field name is "splunk_server" and the
field value is the name of a particular distributed peer:
splunk_server=<peer_name>
Note: You can use the value "local" to refer to the Splunk instance that you are
searching from; in other words, the search head itself.
splunk_server=local
Keep in mind that field names are case sensitive; Splunk will not recognize a
field name if the case doesn't match.
Examples
Example 1: Return results from specified search peers.
error (splunk_server=NYsplunk OR splunk_server=CAsplunk) NOT
splunk_server=TXsplunk
Example 2: Search different indexes on distributed search peers "foo" or "bar".
(splunk_server=foo index=main 404 ip=10.0.0.0/16) OR (splunk_server=bar
index=mail user=admin)
115
About the search language
When you search, you're either retrieving events from an index or summarizing
results into a tabular or visual format. A Splunk search consists of search terms,
search commands, functions, arguments, and clauses.
The search terms are keywords, phrases, boolean expressions, key/value pairs,
etc. that specify what you want to retrieve from the index(es).
The matching events can then be passed as inputs into a search command using
a pipe character, "|". This enables you to refine or enhance the data at each step
along the pipeline. The "search pipeline" refers to the structure of a Splunk
search, in which consecutive commands are chained together using a pipe
character that tells Splunk to use the output or result of one command as the
input for the next command.
Search commands tell Splunk what to do to the events you retrieved from the
indexes. For example, you might use commands to filter unwanted information,
extract more information, evaluate new fields, calculate statistics, reorder your
results, or create a chart. Some commands have functions and arguments
associated with them. These functions and their arguments enable you to specify
how the commands act on your results and which fields to act on; for example,
how to create a chart, what kind of statistics to calculate, and what fields to
evaluate. Some commands also enable you to use clauses to specify how you
want to group your search results. For the complete list of search commands,
refer to the Search Reference manual and the individual search command
reference topic for its syntax and usage.
The anatomy of a search
To better understand how search commands act on your data, it helps to
visualize all your indexed data as a table. Each search command redefines the
shape of your table. This topic illustrates how the different types of search
commands act on your data.
Also, if you want to just jump right in and start searching, the Search command
cheatsheet is a quick reference complete with descriptions and examples.
116
Start with a table of indexed data
Before you search, think of your indexed data as a table. In this table, each
indexed event is a row. Each of these events contain indexed or extracted
fields, which are name and value pairs of information. In this table, the field
names are columns, and the field values are the individual cells in each
row.
You can approximate this data table in Splunk if you search for everything in an
index and select the Events Table view for your results. Restrict your time range
to a short period of time, such as the Last 15 minutes or last hour and search for
index=_internal. Then, use the field picker to add all the fields to the results
view. Your table should look similar to this:
This table shows columns for a few of the internal and default fields Splunk
automatically adds to the data. In your own results, you should see columns for
many more default fields. These default columns are followed by columns for all
other extracted fields.
Search at the beginning or elsewhere
You can search at any point in the search command pipeline. A search results in
a smaller table that contains the exact same number of columns minus the rows
of events that did not match the search conditions. Searches do not change any
cell values.
Searching commands: crawl, savedsearch, search.
Example: Search for matching host.
Let's say you have this beginning table:
You want to find all the HTTP servers in your events:
host=http*
117
Filter unwanted information
Filtering commands produce the same results as a search: a smaller table.
However, depending on the search command, the smaller table may have fewer
rows or fewer columns. Filtering commands also do not change any cell values.
Filtering commands: dedup, fields, head, localize, regex, search, set, tail,
where.
The following 3 examples use the same beginning table from the previous search
example.
Example: Remove duplicates of cell values in a column with dedup.
You want to remove duplicate events based on the hostname:
* | dedup host
Example: Remove or keep columns with fields.
You want to see only the host and sourcetype information:
* | fields + host, sourcetype
Example: Remove all rows after the number specified with head.
You want to see only the first three results of your search:
* | head 3
Evaluate your data
Evaluating commands can change specific column names or cell values.
Depending on the command, evaluating commands may or may not add
columns.
Evaluating commands: abstract, addtotals, bucket, cluster, collect, convert,
correlate, diff, eval, eventstats, format, fillnull, format, kmeans, makemv,
mvcombine, mvexpand, nomv, outlier, overlap, replace, strcat, transaction,
typelearner, xmlunescape.
The next example uses this beginning table; each succeeding example builds on
it.
Example: Create a new column where the cells are the results of an eval
expression.
118
You want to create a new field for the sum of count1 and count2 values.
* | eval sum=count1+count2
Example: Change one or more column names with rename. This does not create
a new column.
Using the previous resulting table, you want to change the column name of sum to
total
* | rename sum as total
Example: Overwrite cell values with replace. This does not create a new
column.
Using the previous resulting table, you want to change all host values that are
host1 to localhost.
* | replace host1 with localhost in host
Example: Create new columns for the concatenated string value of other
columns with eval.
Using the previous resulting table, you want to add a new column called
hosttype that combines the host and sourcetype values, separated by a hyphen.
* | eval hostsourcetype=host."-".sourcetype
Reorder your results
Reordering commands sort the rows of the entire table based on the values of
the specified column name. These commands do not add or remove rows and do
not change any cell values.
Reordering commands: reverse, sort.
Example: Reorder the table with sort.
Using the previous resulting table, reorder the rows in ascending order of total.
* | sort + total
Extract more information
Extracting commands create new rows or columns from information found in the
_raw column for each row.
119
Extracting commands: addinfo, extract/kv, iplocation, multikv, rex, top, typer,
xmlkv.
Example: Create new columns from key/value pairs in your events with
extract/kv.
Example: Create new rows from information found in multi-line or tabular events
with multikv.
Transform your data into statistical results
Transforming commands create an entirely new table of data. These commands
change the specified cell values for each event into numerical values that Splunk
can use for statistical purposes.
Transforming commands: chart, contingency, highlight, rare, stats, timechart,
top.
Example: chart
How subsearches work
A subsearch is a search with a search pipeline as an argument. Subsearches are
contained in square brackets and evaluated first. The result of the subsearch is
then used as an argument in the primary or outer search. Subsearches are
mainly used for two purposes:
• Parameterize one search, using the output of another search (for
example, find every record from IP addresses that visited some specific
URL).
• Run a separate search, but stitch the output to the first search using the
append command.
The following is an example of using a subsearch to parameterize one search.
You're interested in finding all events from the most active host in the last
hour; but, you can't search for a specific host because it might not be the same
host every hour. First, you need to identify which host is most active.
sourcetype=syslog earliest=-1h | top limit=1 host | fields + host
This search will only return one host value. In this example, the result is the host
named "crashy". Now, you can search for all the events coming from "crashy":
120
sourcetype=syslog host=crashy
But, instead of running two searches each time you want this information, you
can use a subsearch to give you the hostname and pass it to the outer search:
sourcetype=syslog [search sourcetype=syslog earliest=-1h | top limit=1
host | fields + host]
Use subsearch to correlate data
You can use subsearches to correlate data, including data across different
indexes or Splunk servers in a distributed environment.
For example, you may have two or more indexes for different application logs.
The event data from these logs may share at least one common field. You can
use the values of this field to search for events in one index based on a value
that is not in another index:
sourcetype=some_sourcetype NOT [search sourcetype=another_sourcetype |
fields field_val]
Note: This is equivalent to the SQL "NOT IN" functionality:
SELECT * from some_table
WHERE field_value
NOT IN (SELECT field_value FROM another_table)
Change the format of subsearch results
When you use a subsearch, the format command is implicitly applied to your
subsearch results. The format command changes your subsearch results into a
single linear search string. This is used when you want to pass the returned
values in the returned fields into the primary search.
If your subsearch returned a table, such as:
| field1 | field2 |
------------------event/row1 | val1_1 | val1_2 |
event/row2 | val2_1 | val2_2 |
The format command returns:
(field1=val1_1 AND field2=val1_2) OR (field1=val2_1 AND field2=val2_2)
121
For more information, see the format search command reference.
There are a couple of exceptions to this. First, all internal fields (fields that begin
with a leading underscore "_*") are ignored and not reformatted in this way.
Second, the "search" and "query" fields have their values rendered directly in the
reformatted search string.
Using "search"
Generally,"search" can be useful when you need to append some static data or
do some eval on the data in your subsearch and then pass it to the primary
search. When you use "search", the first value of the field is used as the actual
search term. For example, if field2 was "search" (in the table above), the format
command returns:
(field1=val1_1 AND val1_2) OR (field1=val2_1 AND val2_2)
You can also use "search" to modify the actual search string that gets passed to
the primary search.
Using "query"
"Query" is useful when you are looking for the values in the fields returned from
the subsearch, but not in these exact fields. The "query" field behaves similarly to
format. Instead of passing the field/value pairs, as you see with format, it passes
the values:
(val1_1 AND val1_2) OR (val2_1 AND val2_2)
Examples
Let's say you have the following search, which searches for a clID associated
with a specific Name. This value is then used to search for several sources.
index="myindex" [ search index="myindex" host="myhost" <Name> | top
limit=1 clID | fields + clID ]
The subsearch returns something like: ( (clID="0050834ja") )
If you want to return only the value, 0050834ja, run this search:
index=myindex [ search index=myindex host=myhost MyName | top limit=1
clID | fields + clID | rename clID as search ]
122
If the field is named search (or query) the field name will be dropped and the
subsearch (or technically, the implicit | format command at the end of the
subsearch) will drop the field name and return ( ( 0050834ja ) ). Multiple results
will return, e.g., ( ( value1 ) OR ( value2 ) OR ( value3 ) ).
This is a special case only when the field is named either "search" or "query".
Renaming your fields to anything else will make the subsearch use the new field
names.
Performance of subsearches
If your subsearch returns a large table of results, it will impact the performance of
your search. You can change the number of results that the format command
operates over inline with your search by appending the following to the end of
your subsearch: | format maxresults = <integer> . For more information, see
the format search command reference.
You can also control the subsearch with settings in limits.conf for the runtime
and maximum number of results returned:
[subsearch]
maxout = <integer>
• Maximum number of results to return from a subsearch.
• This number cannot be greater than or equal to 10500.
• Defaults to 100.
maxtime = <integer>
• Maximum number of seconds to run a subsearch before finalizing
• Defaults to 60.
ttl = <integer>
• Time to cache a given subsearch's results.
• Defaults to 300.
After running a search you can click the Actions menu and select "Inspect
Search". Scroll down to the remoteSearch component, and you can see what the
actual query that resulted from your subsearch. Read more about the "Search
Job Inspector" in the Search reference manual.
123
Answers
Have questions? Visit Splunk Answers and see what questions and answers the
Splunk community has about using subsearches.
Create and use search macros
Search macros are chunks of a search that you can reuse in multiple places,
including saved and ad hoc searches. Search macros can be any part of a
search, such as an eval statement or search term, and do not need to be a
complete command. You can also specify whether or not the macro field takes
any arguments.
This topic discusses how to create and then use search macros via Splunk Web.
For more information about how and why to use search macros, see the Design
macro searches in the Knowledge Manager manual.
Create search macros in Splunk Web
In Manager > Advanced Search > Search macros, click "New" to create a new
search macro.
Define the search macro and its arguments
Your search macro can be any chunk of your search string or search command
pipeline that you want to re-use as part of another search.
• Destination app is the name of the app you want to restrict your search
macro to; by default, your search macros are restricted to the Search app.
• Name is the name of your search macro, such as mymacro. If your search
macro takes an argument, you need to indicate this by appending the
number of arguments to the name; for example, if mymacro required two
arguments, it should be named mymacro(2). You can create multiple
search macros that have the same name but require different numbers of
arguments: foo, foo(1), foo(2), etc.
• Definition is the string that your search macro expands to when
referenced in another search. If the search macro includes arguments,
they are filled in and wrapped by dollar signs; for example, $arg1$.
• If Eval Generated Definition? is checked, then the 'Definition' is expected
to be an eval expression that returns a string that represents the
expansion of this macro.
124
• Arguments are a comma-delimited string of argument names. Argument
names may only contain the characters: alphanumeric 'a-Z, A-Z, 0-9';
underscore '_'; and dash '-'. This list should not contain any repeated
elements.
If a macro definition includes a leading pipe character ("|"), you may not
use it as the first term in searches from the UI. Example: "| metadata
type=sources". The UI does not do the macro expansion and cannot correctly
identify the initial pipe to differentiate it from a regular search term. The UI
constructs the search as if the macro name were a search term, which after
expansion would cause the metadata command to be incorrectly formed and
therefore invalid.
If a macro argument includes quotes, you need to escape the quotes when
you call the macro in your search. For example, if you wanted to pass a
quoted string as your macro's argument, you would use: `my-macro("He said
\"hello!\"")`.
Validate your argument values
You can verify that the argument values used to invoke the search macro are
acceptable. How to invoke search macros are discussed in the following section,
"Apply macros to saved and ad hoc searches".
• Validation Expression is a string that is an 'eval' expression that
evaluates to a boolean or a string.
• If the validation expression is a boolean expression, validation succeeds
when it returns true. If it returns false or is null, validation fails, and the
Validation Error Message is returned.
If the validation expression is not a boolean expression, it is expected to return a
string or NULL. If it returns null, validation is considered a success. Otherwise,
the string returned is rendered as the error string.
Apply macros to saved and ad hoc searches
To include a search macro in your saved or ad hoc searches, use the left quote
(also known as a grave accent) character; on most English-language keyboards,
this character is located on the same key as the tilde (~). You can also reference
a search macro within other search macros using this same syntax.
Note: Do NOT use the straight quote character that appears in the same key as
the double quote (").
125
Example - Combine search macros and transactions
Transactions and macro searches are a powerful combination that you can use
to simplify your transaction searches and reports. This example demonstrates
how you can use search macros to build reports based on a defined transaction.
Here, a search macro, named "makesessions", defines a transaction session
from events that share the same clientip value that occurred within 30 minutes of
each other:
transaction clientip maxpause=30m
This search takes pageview events and breaks them into sessions, using the
"makesessions" search macro:
eventtype=pageview | `makesessions`
This search returns a report of the number of pageviews per session for each
day:
eventtype=pageview | `makesessions` | timechart span=1d sum(eventcount)
as pageviews count as sessions
If you wanted to build the same report, but with varying span lengths, just save it
as a search macro with an argument for the span length. Let's call this search
macro, "pageviews_per_second(1)":
eventtype=pageview | `makesessions` | timechart $spanarg$
sum(eventcount) as pageviews count as sessions
Now, you can specify a span length when you run this search from the Search
app or add it to a saved search:
`pageviews_per_second(span=1h)`
Add sparklines to your search results
If you are working with stats and chart searches, you can increase their
usefulness and overall information density by adding sparklines to their result
tables. Sparklines are inline charts that appear within table cells in search results,
and are designed to display time-based trends associated with the primary key of
each row.
126
For example, say you have this search, set to run over events from the past 15
minutes:
index=_internal | chart count by sourcetype
This search returns a two-column results table that shows event counts for the
source types that have been indexed to _internal in the last 15 minutes. The
first column lists each sourcetype found in the past hour's set of _internal index
events; this is the primary key for the table. The second column, count, displays
the event counts for each listed source type:
You can add sparklines to the results of this search by adding the sparkline
function to the search itself:
index=_internal | chart sparkline count by sourcetype
This results in a table that is almost the same as the preceding one, except that
now, for each row you have a sparkline chart that shows the event count trend
for each listed source type over the past 15 minutes.
Now you can easily see patterns in your data that may have been invisible
before. Some search activity apparently caused a bump in most index=_internal
source types about three quarters into the 15 minute span. And splunkd has
what almost looks like a regular heartbeat running over the entire span of time.
Note: Each sparkline in a table displays information in relation to the other
events represented in that sparkline, but not in relation to the other sparklines. A
peak in one sparkline does not necessarily have the same value as a peak in
another sparkline.
127
Using sparklines with the stats and chart commands
You always use the sparklines feature in conjunction with chart and stats
searches, because it is a function of those two search commands. It is not a
command by itself. The functionality of sparklines is the same for both search
commands.
Note: Sparklines are not available as a dashboard chart visualization by
themselves, but you can set up a dashboard panel with a table visualization that
displays sparklines. For more information, see the "Visualization reference" topic
in this manual.
For more information about the chart and stats commands, including details on
the syntax around the sparkline function, see "chart" and "stats" in the Search
Reference.
Example:Stats, sparklines, and earthquake data
Here are some examples of stats searches that use sparklines to provide
additional information about earthquake data.
These examples use earthquake data downloaded from the USGS Earthquakes website, for the
seven-day period extending from September 13-20, 2011. The data is a comma-separated
ASCII text file containing the source network (Src), ID (Eqid), version, date, location,
magnitude, depth (km) and number of reporting stations (NST) for each
earthquake over the last 7 days.
Download the text file, M 2.5+ earthquakes, past 7 days, save it as a CSV file,
and upload it to Splunk. Splunk should extract the fields automatically. Note that
you'll be seeing data from the 7 days previous to your download, so your results
will vary from the ones displayed below.
Let's say you want to use the USGS Earthquakes data to show the regions that
had the most earthquakes over the past week, with a column that shows the
average quake magnitude for each region. You could use the following search:
source=eqs7day-M2.5.csv | stats sparkline count, avg(Magnitude) by
Region | sort count
This search returns the following table, with sparklines that illustrate the quake
count over the course of the week for each of the top earthquake regions (in this
case, Region is the table's primary key):
128
Right away you can see differences in quake distribution between the top 10
quake regions. Some areas, like Southern Alaska and the Virgin Islands, had a
pretty steady series of quakes, while the Fox Islands and Vanuatu experienced
their seismic activity all at one point.
You can easily get the minimum and maximum count for a particular region by
mousing over the sparkline; in this example you can see that in Southern Alaska,
the minimum count of quakes experienced in a single day during the 7-day
period was 1, while the maximum count per day was 6.
But what if you want your sparkline to represent not only the earthquake count,
but also the relative average magnitude of the quakes affecting each region? In
other words, how can you make the sparkline line chart represent average quake
magnitude for each "time bucket" (segment) of the chart?
Try a search like this:
source=eqs7day-M2.5.csv | stats sparkline(avg(Magnitude),6h) as
magnitude_trend, count, avg(Magnitude) by Region | sort count
This search produces a sparkline for each region that shows the average quake
magnitude for the quake events that fall into each segment of the sparkline..
But it does a bit more than that. It also asks that the sparkline divide itself up into
smaller chunks of time. The preceding table had a sparkline that was divided up
by day, so each data point in the sparkline represented an event count for a full
24 hour period. This is why those sparklines were so short.
The addition of the 6h to the search language overrides this default and makes
Splunk display sparklines that are broken up into discrete six-hour chunks, which
makes it easier to see the distribution of events along the sparkline for the
chosen time range.
The search also renames the sparkline column as "magnitude_trend" to make it
easier to understand.
129
Now you can see that the quakes off Honshu, Japan, were all of roughly similar
magnitude, while the quakes in Puerto Rico varied in intensity. And it's now
easier to see that Southern California's relatively mild quakes hit at the start and
end of the 7-day period. You can also discern that the quakes in the Virgin
Islands didn't occur with the steady frequency that the previous search
suggested, while the quakes off Honshu were slightly more regular than
previously indicated.
130
Capture Knowledge
About capturing knowledge
Once you master the basics of freeform search as described in the "Search and
Investigate" chapter, you'll want to take things to a higher level of precision,
because the raw data you get from those searches won't always get you to the
answers you need.
Leverage Splunk's ability to marry the flexibility of unstructured search with the
power of working with structured data. Add knowledge about the events, fields,
transactions, and patterns in your data. Discover similar events and group them
together with a collective name (an "event type") so you can search on them like
you do any other field. Identify transactions that are associated with clusters of
events and track them. Group related fields together with tags and aliases.
Interactively extract new fields based on event data or external information (such
as lookup tables) and add them to your searches.
In this chapter you will:
• Learn how to identify similar or related events and group them together as
event types.
• See a list of the default fields automatically extracted by Splunk during the
indexing process and see examples of their use in searches.
• Find out how to group fields with related values together through tags and
aliases.
• Learn how to interactively extract and add new fields.
• Discover how you can identify event clusters related to transactions and
use them to your advantage in searches.
• See a detailed example of interactive field extraction.
• Learn how to create a saved search string and share the results of
searches with others.
• Manage both in-process and completed search jobs and review their
results.
Use default fields
Fields are searchable name/value pairs in event data. When you search, you're
matching search terms against segments of your event data; you can search
131
more precisely by using fields. Fields are extracted from event data at either
index time or search time. The fields that Splunk extracts automatically at index
time are known as default fields.
Default fields serve a number of purposes. For example, the default field index
identifies the index in which the event is located. The default field linecount
describes the number of lines the event contains, and timestamp specifies the
time at which the event occurred. Splunk uses the values in some of the fields,
particularly sourcetype, when indexing the data, in order to create events
properly. Once the data has been indexed, you can use the default fields in your
searches.
For more information on using default fields in search commands, see "How
search commands work" in this manual. For information on configuring default
fields, see "About default fields" in the Getting Data In manual.
Type of
field
List of fields
Description
Internal
fields
_raw, _time,
_indextime, _cd
These are fields that contain general information about
events in Splunk.
Default
fields
host, index,
linecount, punct,
source, sourcetype,
splunk_server,
timestamp
These are fields that contain information about where
an event originated, in which index it's located, what
type it is, how many lines it contains, and when it
occurred. These fields are indexed and added to the
Fields menu by default.
These are fields that provide additional searchable
granularity to event timestamps.
Note: Only events that have timestamp
information in them as generated by their
date_hour,
date_mday,
respective systems will have date_* fields. If
Default
date_minute,
an event has a date_* field, it represents the
datetime date_month,
value of time/date directly from the event
fields
date_second,
itself. If you have specified any timezone
date_wday,
date_year, date_zone conversions or changed the value of the
time/date at indexing or input time (for
example, by setting the timestamp to be the
time at index or input time), these fields will
not represent that.
A field can have more than one value; for more information about how to handle
such fields and their values, see the "Manipulate and evaluate fields with multiple
values" topic in this chapter.
132
You can extract additional (non-default) fields with Splunk Web or by using
extracting search commands. For more information, see the "Extract and add
new fields" topic in this chapter.
You might also want to change the name of a field, or group it with other similar
fields. This is easily done with tags or aliases for the fields and field values. For
more information, see the "Tag and alias field values" topic in this chapter.
This topic discusses the internal and other default fields that Splunk automatically
adds when you index data.
Internal fields
Fields that begin with an underscore are internal fields.
Note: We do not recommend that you override internal fields unless you are
absolutely sure you know what you are doing.
_raw
The _raw field contains the original raw data of an event. Splunk's search
command uses the data in _raw when performing searches and data extraction.
You can't always search directly on values of _raw, but you can filter on it with
commands like regex or sort.
Example: Return sendmail events that contain an IP address that starts with
"10".
eventtype=sendmail | regex _raw=*10.\d\d\d\.\d\d\d\.\d\d\d\*
_time
The _time field contains an event's timestamp expressed in Unix time. Splunk
uses this field to create the event timeline in Splunk Web.
Note: The _time field is stored internally in UTC format. It is translated to
human-readable Unix time format when Splunk renders the search results (the
very last step of search time event processing).
Example: Search all sources of type "mail" for mail addressed to the user
"[email protected]", then sorts the search results by timestamp.
sourcetype=mail [email protected] | sort _time
133
_indextime
The _indextime field contains the time that an event was indexed, expressed in
Unix time. You might use this field to focus on or filter out events that were
indexed within a specific range of time.
_cd
The _cd field essentially provides an "address" for an event within the index. It is
composed of two numbers, a short number and a long number. The short
number indicates the specific index bucket that the event resides in. The long
number is an index bucket offset. It provides the exact location of the event within
its bucket. Because _cd is used for internal reference only, we don't recommend
that you set up searches that involve it.
Other default fields
host
The host field contains the originating hostname or IP address of the network
device that generated the event. . Use the host field to narrow searches by
specifying a host value that events must match. You can use wildcards to specify
multiple hosts with a single expression (Example: host=corp*).
You can use host to filter results in data-generating commands, or as an
argument in data-processing commands.
Example 1: Search for events on all "corp" servers for accesses by the user
"strawsky". It then reports the 20 most recent events.
host=corp* eventtype=access user=strawsky | head 20
Example 2: Search for events containing the term "404", and are from any host
that starts with "192".
404 | regex host=*192.\d\d\d\.\d\d\d\.\d\d\d\*
index
The_index field contains the name of the index in which a given event is indexed.
Specify an index to use in your searches by using: index="name_of_index". By
default, all events are indexed in the main index (index="main").
Example: Search the myweb index for events that have the ".php" extension.
134
index="myweb" *.php
linecount
The linecount field contains the number of lines an event contains. This is the
number of lines an event contains before it is indexed. Use linecount to search
for events that match a certain number of lines, or as an argument in
data-processing commands. To specify a matching range, use a greater-than
and less-than expression (Example: linecount>10 linecount<20).
Example: Search corp1 for events that contain "40" and have 40 lines, and omit
events that contain 400.
40 linecount=40 host=corp1 NOT 400
punct
The punct field contains a punctuation pattern that is extracted from an event.
The punctuation pattern is unique to types of events. Use punct to filter events
during a search or as a field argument in data-processing commands.
You can use wildcards in the punct field to search for multiple punctuation
patterns that share some common characters that you know you want to search
for. You must use quotation marks when defining a punctuation pattern in the
punct field.
Example 1: Search for all punctuation patterns that start and end with :
punct=":*:"
Example 2: Search the php_error.log for php error events that have the
punctuation pattern:"[--_::]__:___:____/-..-///.___".
source="/var/www/log/php_error.log"
punct="[--_::]__:___:____''/-..-''///.___"
source
The source field contains the name of the file, stream, or other input from which
the event originates. Use source to filter events during a search, or as an
argument in a data-processing command. You can use wildcards to specify
multiple sources with a single expression (Example: source=*php.log*).
You can use source to filter results in data-generating commands, or as an
argument in data-processing commands.
Example: Search for events from the source "/var/www/log/php_error.log".
135
source="/var/www/log/php_error.log"
sourcetype
The sourcetype field specifies the format of the data input from which the event
originates, such as access_combined or cisco_syslog. Use sourcetype to filter
events during a search, or as an argument in a data-processing command. You
can use wildcards to specify multiple sources with a single expression (Example:
sourcetype=access*).
Example: Search for all events that are of the source type "access log".
sourcetype=access_log
splunk-server
The splunk-server field contains the name of the Splunk server containing the
event. Useful in a distributed Splunk environment.
Example: Restrict a search to the main index on a server named "remote".
splunk-server=remote index=main 404
timestamp
The timestamp field contains an event's timestamp value. The method by which
Splunk extracts timestamps is configurable. You can use timestamp as a search
command argument to filter your search.
For example, you can add timestamp=none to your search to filter your search
results to include only events that have no recognizable timestamp value.
Example: Return the number of events in your data that have no recognizable
timestamp.
timestamp=none | stats count(_raw) as count
Default datetime fields
You can use datetime fields to filter events during a search or as a field argument
in data-processing commands.
If you are located in a different timezone from the Splunk server,
time-based searches use the timestamp of the event as specified on the
server where the event was indexed. The datetime values are the literal values
parsed from the event when it is indexed, regardless of its timezone. So, a string
136
such as "05:22:21" will be parsed into indexed fields: "date_hour::5
date_minute::22 date_second::21".
date_hour
The date_hour field contains the value of the hour in which an event occurred
(range: 0-23). This value is extracted from the event's timestamp (the value in
_time).
Example: Search for events with the term "apache" that occurred between 10pm
and 12am on the current day.
apache (date_hour >= 22 AND date_hour <= 24)
date_mday
The date_mday field contains the value of the day of the month on which an event
occurred (range: 1-31). This value is extracted from the event's timestamp (the
value in _time).
Example: Search for events containing the term "apache" that occurred between
the 1st and 15th day of the current month.
apache (date_mday >= 1 AND date_mday <= 15)
date_minute
The date_minute field contains the value of the minute in which an event
occurred (range: 0-59). This value is extracted from the event's timestamp (the
value in _time).
Example: Search for events containing the term "apache" that occurred between
the 15th and 20th minute of the current hour.
apache (date_minute >= 15 AND date_minute <= 20)
date_month
The date_month field contains the value of the month in which an event occurred.
This value is extracted from the event's timestamp (the value in _time).
Example: Search for events with the term "apache" that occurred in January.
apache date_month=1
137
date_second
The date_second field contains the value of the seconds portion of an event's
timestamp (range: 1-59). This value is extracted from the event's timestamp (the
value in _time).
Example: Search for events containing the term "apache" that occurred between
the 1st and 15th second of the current minute.
apache (date_second >= 1 AND date_second <= 15)
date_wday
The date_wday field contains the day of the week on which an event occurred
(Sunday, Monday, etc.). Splunk extracts the date from the event's timestamp (the
value in _time) and determines what day of the week that date translates to. This
day of the week value is then placed in the date_wday field.
Example: Search for events containing the term "apache" that occurred on
Sunday.
apache date_wday="sunday"
date_year
The date_year field contains the value of the year in which an event occurred.
This value is extracted from the event's timestamp (the value in _time).
Example: Search for events containing the term "apache" that occurred in 2008.
apache date_year=2008
date_zone
The date_zone field contains the value of time for the local timezone of an event,
expressed as hours in Unix Time. This value is extracted from the event's
timestamp (the value in _time). Use date_zone to offset an event's timezone by
specifying an offset in minutes (range: -720 to 720).
Example: Search for events containing the term "apache" that occurred in the
current timezone (local).
apache date_zone=local
138
Manipulate and evaluate fields with multiple values
Splunk parses multivalue fields at search time, and allows you to process the
values in the search pipeline. Search commands that work with multivalue fields
include makemv, mvcombine, mvexpand, and nomv. The eval and where
commands support functions, such as mvcount(), mvfilter(), mvindex(), and
mvjoin() that you can use with multi-valued fields. For more information on these
functions see the Functions for eval and where in the Search Reference manual
and the examples on this page.
You can configure multi-value fields in fields.conf to tell Splunk how to recognize
more than one field value in a single extracted field value. Edit fields.conf in
$SPLUNK_HOME/etc/system/local/, or your own custom application directory in
$SPLUNK_HOME/etc/apps/. For more information on how to do this, see "Configure
multivalue fields" in the Knowledge Manager manual.
Manipulate multivalued fields
Use nomv to convert a multivalue field into a single value
You can use the nomv command to convert values of the specified multivalued
field into one single value. The nomv command overrides multivalue field
configurations set in fields.conf.
In this example for sendmail events, you want to combine the values of the
senders field into a single value.
eventtype="sendmail" | nomv senders
Use makemv to separate a multivalue field
You can use the makemv command to separate multivalue fields into multiple
single value fields. In this example for sendmail search results, you want to
separate the values of the "senders" field into multiple field values.
eventtype="sendmail" | makemv delim="," senders
After you separate the field values, you can pipe it through other commands. For
example, you can display the top senders.
eventtype="sendmail" | makemv delim="," senders | top senders
139
Use mvexpand to create multiple events based on a multivalue field
You can use the mvexpand command to expand the values of a multivalue field
into separate events for each value of the multivalue field. In this example,
Splunk creates new events for each value of multivalue field, "foo".
... | mvexpand foo
Use mvcombine to create a multivalue field from similar events
Combine the values of "foo" with ":" delimiter.
... | mvcombine delim=":" foo
Evaluate multivalued fields
One of the more common examples of multivalue fields is that of email address
fields, which typically appears two to three times in a single sendmail event--once
for the sender, another time for the list of recipients, and possibly a third time for
the list of Cc addresses, if one exists.
Count the number of values in a field
Use the mvcount() function to count the number of values in a single-valued or
multivalued field.
In this example, mvcount() returns the number of email addresses in the To,
From, and Cc fields and saves them in the specified "_count" fields.
eventtype="sendmail" | eval To_count=mvcount(to) | eval
From_count=mvcount(from) | eval Cc_count=mvcount(cc)
Note: If only a single email address to exists in the sender field (as you would
expect), mvcount(from) returns 1. Also, if there is no Cc address included, the Cc
field might not exist for the event and mvcount(cc) returns NULL.
Filter values from a multivalued field
Use the mvfilter() function to filter a multivalued field using an arbitrary
Boolean expression.
In this example, mvfilter() keeps all values of the field email that end in .net or
.org:
eventtype="sendmail" | eval email=mvfilter(match(email, "\.net$") OR
match(email, "\.org$"))
140
Important: This function works with ONLY ONE field at a time.
Note: This example also uses the match() function to compare the pattern
defined in quotes to the value of email. For more information, see Functions for
eval and where in the Search Reference manual.
Return a subset of values from a multivalued field
Use the mvindex() function to reference a specific value or a subset of values in
a multivalued field. Since the index numbering starts at 0, if you want to
reference the 3rd value of a field, you would specify it as 2.
In this example, mvindex() returns the first email address in the "To" field for
every email sent by Sender:
eventtype="sendmail" from=Sender@* | eval to_first=mvindex(to,0)
If you wanted to see the top 3 email addresses that Sender writes to each time:
eventtype="sendmail" from=Sender@* | eval top_three=mvindex(to,0,2)
Note: In this case, top_three is, itself, a multivalued field.
Classify and group similar events
An event is not the same thing as an event type. An event is a single instance of
data — a single log entry, for example. An event type is a classification used to
label and group events.
The names of the matching event types for an event are set on the event, in a
multi-valued field called eventtype. You can search for these groups of events
(for example, SSH logins) the same way you search for any field value.
This topic discusses how to save event types and use them in searches. For
more information about events, how Splunk recognizes them, and what it does
when it processes them for indexing, see the "Overview of event processing"
topic in the Getting Data In manual.
Important: You cannot save a search pipeline as an event type; that is, when
saving a search as an event type, it cannot include a search command.
141
Save a search as a new event type
When you search your event data, you're essentially weeding out all unwanted
events. Therefore, the results of your search are events that share common
characteristics, and you can give them a collective name.
For example, if you often search for failed logins on different host machines, you
can save an eventtype for the events and call it failed_login:
"failed login" OR "FAILED LOGIN" OR "Authentication failure" OR "Failed
to authenticate user"
To save this search as an eventtype:
1. Click Create and select Event type...
2. In Save As Event Type, give your search a Name. For our search example,
we'll name it "failed_login".
If necessary, you can modify the Search string field, which should be populated
automatically with the search you just ran.
You can also optionally add a list of tags that should be applied to the event type
in the Tag(s) field. For more about this see the subsection about tagging event
types, below.
3. Click "Save" to save your event type name.
Now, you can quickly search for all the events that match this event type the
same way you can search for any field.
For example, you may be interested it in finding failed logins on specific host
machines:
142
host=target eventtype=failed_login
Or you may want to investigate a suspicious user's activities:
user=suspicious eventtype=failed_login
For more information about searching for fields, see the "Start searching" topic in
the Search and Investigate chapter of this manual.
Identify similar events with punct
Because the punctuation of an event is often unique to a specific type of event,
Splunk indexes the punctuation characters of event in the punct field. The values
of this field may look cryptic, but they can be an effective way of characterizing
similar events.
To apply the punct field to your search results, use the Fields popup discussed in
the "Search interactively with Splunk Web" topic in the Search and Investigate
chapter of this manual. Select the punct value for an SSH login event. This
updates your search to include this punct combination in the search bar. You
may want to consider wildcarding the punctuation to match insignificant
variations (for example, "punct=::[]*/*").
Use typelearner to discover new event types
Pass any of your searches into the typelearner command to see Splunk's
suggestions for event types. By default, typelearner compares the punctuation
of the events resulting from the search, grouping those that have similar
punctuation and terms together.
You can specify a different field for Splunk to group the events; typelearner
works the same way with any field. The result is a set of events (from your
search results) that have this field and phrases in common.
For more information and examples, see "typelearner" in the search command
reference.
Use tags to group and find similar events
Event types can have one or more tags associated with them. You can add these
tags while you save a search as an event type and from the event type manager,
located in Manager > Event types. From the list of event types in this window,
select the one you want to edit.
143
After you add tags to your event types, you can search for them in the same way
you search for any tag. Let's say you saved a search for firewall events as the
event type firewall_allowed, and then saved a search for login events as the
event type login_successful. If you tagged both of these event types with allow,
all events of either of those event types can be retrieved by using the search:
tag::eventtype="allow"
For more information about using tags, see the "Tag and alias field values" topic
in this chapter.
Tag and alias field values
In your data, you might have groups of events with related field values. To help
you search more efficiently for these groups of fields, you can assign tags to their
field values. You can assign one or more tags to any extracted field (including
event type, host, source, or source type).
For more information, read "About tags and aliases" in the Knowledge Manager
manual.
How to tag and alias field values
You can tag field/value pairs. You can also alias field names.
Tag field value pairs
You can use Splunk Web to tag any field value pair directly from the search
results. In any resulting event that has the field value pair that you want to tag,
click on the arrow next to that field value. A dropdown menu opens with an option
to tag that value. For example, if you selected a syslog source type, you will see:
After you select the Tag action for your field value pair, you can add the tag or
tags in the "Tag this field" popup window:
144
Alias field names
You can add multiple aliases to a field name or use these field aliases to
normalize different field names. This does not rename or remove the original field
name. After you alias a field, you can search for it using any of its name aliases.
To alias a field name, you need to have access to props.conf. For information on
how to do this, see "Create aliases for fields" in the Knowledge Manager manual.
Search for tagged field values
There are two ways to search for tags. If you are searching for a tag associated
with a value on any field, you can use the following syntax:
tag=<tagname>
Or, if you are looking for a tag associated with a value on a specific field, you can
use the following syntax:
tag::<field>=<tagname>
Use wildcards to search for tags
You can use the asterisk (*) wildcard when searching keywords and field values,
including for eventtypes and tags.
For example, if you have multiple event-type tags for various types of IP
addresses, such as IP-src and IP-dst, you can search for all of them with:
tag::eventtype=IP-*
If you wanted to find all hosts whose tags contain "local", you can search for the
tag:
tag::host=*local*
Also, if you wanted to search for the events with eventtypes that have no tags,
you can search for the Boolean expression:
145
NOT tag::eventtype=*
Disabling and deleting tags
If you have a tag that you no longer want to use, or want to have associated with
a particular field, you have the option of either disabling it or removing it. You
can:
• Remove a tag association for a specific field value through the Search
app.
• Disable or delete tags, even if they are associated with multiple field
values, via Splunk Manager.
For more information about using Splunk Manager to manage tags, see "Define
and manage tags" in the Knowledge Manager manual.
Remove a tag association for a specific field value in search results
If you no longer want to have a tag associated with a specific field value in your
search results, click the arrow next to that field/value combination to open up the
dropdown menu. Select Tag [fieldname]=[value] to bring up the Tag This Field
popup window.
Erase the tag or tags that you want to disable from the Tags field and click Save.
This removes this particular tag and field value association from the system. If
this is the only field value with which a tag is associated, then the tag is removed
from the system.
Rename source types
When you configure a source type in props.conf, you can rename the source
type. Multiple source types can share the same name; this can be useful if you
want to group a set of source types together for searching purposes. For
example, you can normalize source type names that include "-too_small" to
remove the classifier. For information on how to do this, see "Rename source
types" in the Getting Data In Manual.
Extract and add new fields
As you learn more about your data, you may find more information that you want
to use. There are a variety of ways to extract this information from your events,
save it as a field, and use it to search and build reports. You can also look up
146
information from external sources (such as a CSV file or the output of a script)
and add it to your event data.
In this topic, you will:
• Learn how to extract and save fields interactively in Splunk Web.
• Learn about the search commands that extract fields from your events.
• Learn about using configuration files to define field extraction at
index-time.
• Learn about matching fields with lookup tables to add new fields to your
events.
Extract fields interactively in Splunk Web
You can create custom fields dynamically using the interactive field extraction
(IFX) feature of Splunk Web. To access the IFX, run a search and then select
"Extract fields" from the dropdown that appears left of the timestamps in the
search results. The IFX enables you to extract one field at a time, based on a
host, source, or source-type value. For more information, see the Interactive field
extraction example in this manual.
Extract fields with search commands
You can use a variety of search commands to extract fields in different ways.
Here is a list of those commands; for examples of how to use each of these
commands, see "Extract fields with search commands" in this manual.
• rex performs field extractions using Perl regular expressions named
groups.
• extract (or kv, for "key/value") explicitly extracts field/values using default
patterns.
• multikv extracts field/values on multi-line, tabular-formatted events.
• xmlkv extracts field/values on xml-formatted event data.
• kvform extracts field/values based on predefined form templates.
Define field extraction in conf files
All field extraction rules that you add using IFX get written to the configuration
files. You can also edit these files directly, if you have the permissions to access
them. For more information see "Add fields at search time through configuration
file edits" in the Knowledge Manager manual.
147
Look up fields from external data sources
You can match fields in your events to fields in external sources, such as lookup
tables, and use these matches to add more information inline to your events.
A lookup table can be a static CSV file or the output of a Python script. You can
also use the results of a search to populate the CSV file and then set that up as a
lookup table. For more information about field lookups, see "Add fields from
external data sources" in the Knowledge Manager manual.
After you configure a fields lookup, you can invoke it from the Search app with
the lookup command.
Example: Given a field lookup named dnslookup, referencing a Python script
that performs a DNS and reverse DNS lookup and accepts either a host name or
IP address as arguments -- you can use the lookup command to match the host
name values in your events to the host name values in the table, and then add
the corresponding IP address values to your events.
... | lookup dnslookup host OUTPUT ip
For a more extensive example using the Splunk script external_lookup.py, see
"Reverse DNS Lookups for Host Entries" in the Splunk blogs.
Extract fields with search commands
As mentioned in "Extract and add new fields", you can use a variety of search
commands to extract fields in different ways. Continuing reading for examples of
usage for the rex, extract, multikv, xmlkv, and kvform commands.
Extract fields using regular expressions
The rex search command performs field extractions using Perl regular
expression named groups that you include in the search string. It matches
segments of your raw events with the regular expression and saves these values
into a field.
In this example, Splunk matches terms that occur after the strings "From:" and
"To:" and saves these values into the "from" and "to" fields, respectively.
... | rex field=_raw "From: (?<from>.*) To: (?<to>.*)"
148
If a raw event contains "From: Susan To: Bob", then Splunk would extract the
field name/value pairs: "from=Susan" and "to=Bob".
For a primer on regular expression syntax and usage, see
Regular-Expressions.info. Splunk also maintains a list of useful third-party tools
for writing and testing regular expressions.
Force field value extractions on search results
Force field extractions defined in conf files
The extract (or kv, for "key/value") search command forces field/value extraction
on the result set. If you use extract without specifying any arguments, Splunk
extracts fields using field extraction stanzas that have been added to props.conf.
You can use extract to test any field extractions that you add manually through
conf files.
Extract fields from events formatted as tables
Use multikv to force field/value extraction on multi-line, tabular-formatted events.
It creates a new event for each table row and derives field names from the table
title.
Extract fields from events formatted in xml
The xmlkv command enables you to force field/value extraction on xml-formatted
tags in event data, such as transactions from web pages.
Extract fields from XML and JSON documents
The Documentation:Splunk:SearchReference:Spath command provides a
straightforward means for extracting information from structured data formats,
XML and JSON, and storing them in fields.
Extract fields from events based on form templates
The kvform command extracts field/value pairs from events based on form
templates that are predefined and stored in $SPLUNK_HOME/etc/system/local/, or
your own custom application directory in $SPLUNK_HOME/etc/apps/. For example,
if form=sales_order, Splunk would look for a sales_order.form, and Splunk
would match all processed events against that form, trying to extract values.
149
Extract fields interactively in Splunk Web
Use the interactive field extraction (IFX) feature of Splunk Web to create custom
fields dynamically on your local Splunk instance. IFX enables you to define any
pattern for recognizing one or more fields. IFX is especially useful if you are not
familiar with regular expression syntax and usage, because it will generate field
extraction regexes for you (and enable you to test them). Also, unless you hand
edit the regular expression, IFX learns to extract only one field at a time.
Splunk is very good at handling Web access logs, so there is really no
information that it hasn't already extracted for you. For the examples here, let's
just walk how to extract the IP addresses from events.
1. To access the IFX, first run a search that generates events containing the field
values that you want to extract.
Because we're interested in extracting IP addresses, we can search for Apache
access logs with:
sourcetype=access_combined
2. From the results of the search, find an event that contains the field value; in
this case, an IP address. Click on the arrow to the left of the timestamp of an
event and select Extract fields.
The IFX opens in a new window, Extract fields.
150
3. Choose sourcetype="access_combined" from the Restrict field extraction to
menu.
This dropdown is populated with the field values from the event that you selected
in step 2. If you want to choose a different host, source, or sourcetype value,
close the window and select a different event in your search results or run a new
search.
4. Type, or copy and paste, some values of IP addresses from your results into
the Example values text box. For best results, give multiple examples.
The list of Sample events is based on the event you selected from your search
results and the field restriction you specified. If you change the field restriction,
151
this list also changes; but it will still be based on the original event you selected.
5. When you think you have enough sample values, click Generate. Splunk
generates a regex pattern for your field, based on the information you gave it and
the general format of your events.
6. Review the Sample extractions and Sample events to see if there are any
values that you don't want or any values that you do what that aren't displayed in
the list.
If you see unwanted values, click the X next to the value to remove it. If you
notice a value that is left out, add it to the list of Sample events. The IFX will
update the generated pattern to reflect this change. To re-add any value and
reset the regex, just click the + icon next to it.
7. Before you save the new field, you can test the regex against a larger data set
or edit the pattern manually.
When you click Test from the field extractions page, Splunk takes you to the
Search view and runs a search:
• against your host, source, or sourcetype restriction, limited to first 10,000
results.
• using the rex command with the regex Splunk generated for your
FIELDNAME, removing any duplicate occurrences of the field value.
If you edit the search expression manually in the test window, you must
copy-paste your changes back to the IFX page.
If you're familiar with writing regexes, you can edit the pattern manually after
Splunk generates it; just click Edit in the IFX window.
152
Also, you'll notice that the name of the extracted field in the search or edit
window is "FIELDNAME". You do not need to rename this value because it will
be set with the name you enter when you save the extraction.
After testing or editing your regex, return to the IFX window.
8. If the expression looks like it's working, click Save.
This opens the Save Field Extraction window.
9. Name your extraction clientip and click Save.
Splunk only accepts field names that contain alpha-numeric characters or an
underscore:
• Valid characters for field names are a-z, A-Z, 0-9, or _ .
• Field names cannot begin with 0-9 or _ . (Leading underscores are
reserved for Splunk's internal variables).
Important: Extractions created by a user will be located in
$SPLUNK_HOME/etc/users and will be a function of the role a user has, with
relationship to the app.
Use field lookups to add information to your
events
Splunk's lookup feature lets you reference fields in an external CSV file that
match fields in your event data. Using this match, you can enrich your event data
by adding more searchable fields to them. You can base your field lookups on
any field, including a temporal field, or on the output of a Python script.
This topic discusses how to use the Lookups manager page, located in Splunk
153
Web, at Manager > Lookups, to:
• List existing lookup tables or upload a new file.
• Edit existing lookup definitions or define a new file-based or external
lookup.
• Edit existing automatic lookups or configure a new lookup to run
automatically.
For more details about lookups, see "Add fields from external data sources" in
the Knowledge Manager manual.
List existing lookup tables or upload a new file
View existing lookup table files in Manager > Lookups > Lookup table files, or
click "New" to upload more CSV files to use in your definitions for file-based
lookups.
To upload new files:
1. Select a Destination app.
This tells Splunk to save your lookup table file in the app's directory:
$SPLUNK_HOME/etc/users/<username>/<app_name>/lookups/.
2. Give your lookup table file a Name.
This will be the name you use to refer to the file in a lookup definition.
3. Browse for the CSV file to upload.
4. Click Save.
Edit existing lookup definitions or define a new file-based or
external lookup
Use the Manager > Lookups > Lookup definitions page to define the lookup
table or edit existing lookup definitions. You can specify the type of lookup
(file-based or external) and whether or not it is time-based. Once you've defined
the lookup table, you can invoke the lookup in a search (using the lookup
command) or you can configure the lookup to occur automatically.
Note: This is equivalent to defining your lookup in transforms.conf.
154
Configure a time-based lookup
File-based and external lookups can also be time-based (or temporal), if the field
matching depends on time information (a field in the lookup table that represents
the timestamp).
To Configure a time-based lookup, specify the Name of the time field. You can
also specify a strptime format for this time information and offsets for the time
matching.
Include advanced options
Under Advanced options, you can specify:
• The minimum number of matches for each input lookup value.
• The maximum number of matches for each input lookup value.
• A default value to output if fewer than the minimum number of matches
are present for a given input.
Edit existing automatic lookups or configure a new lookup to
run automatically
Instead of invoking the lookup command when you want to apply a fields lookup
to your events, you can set the lookup to run automatically. Use the Manager >
Lookups > Automatic lookups page to edit or configure automatic lookups:
1. Select the lookup table file that you want use in your fields lookup.
2. Select a host, source, or sourcetype value to apply the lookup.
3. Under lookup input fields, list one or more pairs of lookup field name and local
field name.
4. Under lookup output fields, list one or more pairs of lookup field name and
local field name.
5. You can also choose to overwrite the field values each time the lookup runs.
Note: This is equivalent to configuring your fields lookup in props.conf.
155
Example of HTTP status lookup
This examples walks through defining a static lookup that adds two informational
fields, status_description and status_type, into your Web access events. This
lets you search for the events you want when you might not know the specific
error code. For example, instead of searching for all the server error codes, you
can use status="Server Error".
Upload the lookup table to Splunk
1. Download the http_status.csv file:
http_status.csv
Here's a sampling of the file:
status,status_description,status_type
100,Continue,Informational
101,Switching Protocols,Informational
200,OK,Successful
201,Created,Successful
202,Accepted,Successful
203,Non-Authoritative Information,Successful
...
2. Go back to the Search app, and select Manager from the navigation menu on
the upper right.
3. In the Manager > Lookups view, select Add new for Lookup table files.
156
4. In Manager > Lookups > Lookup table files > Add new,
• Select search for the destination app.
• Browse for the CSV file that you downloaded earlier.
• Name the lookup table http_status.
• Click Save.
After Splunk saves the file, it takes you to the following view:
Now, let's go back to the Manager > Lookups view. To do this, click on the
Lookups link in the page's breadcrumb. You can always use this to navigate
back to a previous view.
157
Define the lookup
1. From Manager > Lookups, select Add new for Lookup definitions.
In the Manager > Lookups > Lookup definitions > Add new view:
2. Select search for the Destination app.
3. Name your lookup definition http_status.
4. Select File-based under Type.
5. Click Save.
After Splunk saves your lookup definition, it takes you to the following view:
Notice there are some actions you can take on your lookup definition.
158
Permissions lets you change the accessibility of the lookup table. You can
Disable, Clone, and Move the lookup definition to a different app. Or, you can
Delete the definition.
Once you define the lookup, you can use the lookup command to invoke it in a
search or you can configure the lookup to run automatically.
Set the lookup to run automatically
1. Return to the Manager > Lookups view and select Add new for Automatic
lookups.
In the Manager > Lookups > Automatic lookups view:
2. Select search for the Destination app.
3. Name the lookup http_status.
4. Select http_status from the Lookup table drop down.
5. Apply the lookup to the sourcetype named access_combined.
159
6. Lookup input fields are the fields in our events that you want to match with the
lookup table. Here, both are named status (the CSV column name goes on the
left and the field that you want to match goes on the right):
7. Lookup output fields are the fields from the lookup table that you want to add
to your events: status_description and status_type. The CSV column name goes
on the left and the field that you want to match goes on the right.
8. Click Save.
Identify transactions
A transaction is a meta-event, a collection of events that you want to group
together. Transactions can span multiple sources.
A transaction type is a configured type of transaction that is saved as a field in
Splunk.
160
A common transaction search use is to group multiple events into a single
meta-event that represents a single physical event. For example, an out of
memory problem could trigger several database events to be logged, and they
can all be grouped together into a transaction. Use the transaction command to
define a transaction or override transaction options specified in
transactiontypes.conf.
Example: Run a search that groups together all of the web pages a single user
(or client IP address) looked at, over a time range.
This search takes events from the access logs, and creates a transaction from
events that share the same clientip value that occurred within 5 minutes of
each other (within a 3 hour time span).
sourcetype=access_combined | transaction fields=clientip maxpause=5m
maxspan=3h
For more information, including use cases and examples, see the "Group events
into transactions" chapter of the Knowledge Manager manual.
Save searches and share search results
After you run a search that returns interesting or useful results, you may want to
save the search, so the search can easily be run again without having to retype
the search string. Or you may want to save the results of that search run so you
and others can review those results at a later time. This topic covers:
• Manually saving searches via the Splunk Web UI.
• Manually saving searches by updating savedsearches.conf.
• Actions that cause Splunk to automatically save searches.
• Sharing the results of searches with others.
• Managing saved search navigation.
Manually save a search
If you've just designed a search that returns useful results and you want to save
it, it's easy to do so through the Splunk Web UI once a search is running,
finalized, or completed. You can also define a new saved search manually in
savedsearches.conf. See the following subsections for details on these methods.
At minimum, a saved search definition includes the search string and the time
range associated with the search (expressed in terms of relative time modifiers).
161
It should also include a search name--this is what appears in the Searches &
Reports dropdown after the search is saved.
Note: You can change the navigation rules for your app so that searches are
saved to a location in the top-level navigation other than Searches & Reports.
For more information, see "Managing saved search navigation", below.
Save a running, completed, or finalized search from the timeline view
When you run a search in the timeline view, you can manually save it through
Splunk Web by clicking the Save... button that appears above the search bar and
then selecting Save search... to open the Save Search dialog.
When the Save Search dialog opens, it is populated with the Search string and
Time range (expressed with relative time modifiers) of the search you're
saving. You can modify that information before you save it. You must give the
saved search a unique Name. This name will appear in the "Searches &
Reports" list in the app navigation bar near the top of the page after you save the
search.
By default the saved search will be private and only available to you, but if your
permissions allow it, the Save search dialog enables you to reset the search
permissions so that every user in the app you're running the search in has "read"
access to it (which means that they can run the search from the Searches &
Reports list but they can't edit it or change its permissions).
However, if you have an Admin-level role, you can go into Manager > Searches
and reports and narrow or widen the potential usage of the saved search by
further redefining its permissions. For example, you could make it "globally"
available to everyone that uses your Splunk implementation. Or you could narrow
the saved search permissions so that only specific roles within the current app
can use it. You can also arrange for particular roles or users to have "write"
access to the saved search, enabling them to edit its definition.
162
Create a new saved search in Manager
When you are saving a new search, it's easiest to just run the search and then
use the "Save search" dialog box to save it. This method enables you to test the
search before you save it.
But you can also manually create new saved searches in Manager. Navigate to
Manager > Searches and reports and click New to define and add a new saved
search. To define the search you'll need to provide the same essential
information required by the Save search dialog: the Search name, the search
string (in the Search field), and the Time range (expressed with relative time
modifiers). You can optionally enter a search description that explains what the
search does and/or how it should be used.
You can also optionally select Schedule this search. This opens up a variety of
fields that enable you to schedule the search to run on a regular schedule, define
triggering conditions for an alert based on the search, and set up alerting actions
(what happens when the alert is triggered).
For more information about creating and defining alerts see "Create an alert," in
this manual. This topic also has information about alerting options that are only
available through the Searches and Reports detail page in Manager, such as the
capability to set expiration times for alert records in the Alert Manager or the "add
to RSS feed" alerting condition.
163
The Searches and reports detail page in Manager is also the only place in the
Splunk Web UI where you can enable summary indexing for a saved search
(you can also configure summary indexing for a search by modifying
savedsearches.conf). For more information about summary indexing, see the
topic "Enable summary indexing for a search," in the Knowledge Manager
Manual.
You can edit and update searches listed on the Searches and reports page if
you have "write" permissions for them. For more information about permissions,
see "Curate Splunk knowledge with Manager" in the Knowledge Manager
Manual.
Configure a saved search in savedsearches.conf
When you save a search via the Splunk Web UI or Manager, Splunk
automatically adds a configuration stanza for that search to savedsearches.conf.
The UI validates your changes, and you won't have to reboot the system to apply
searches created via UI methods. But if you prefer to work with saved searches
directly through configuration files, you certainly can.
For more information about configuring saved searches and alerts in
savedsearches.conf, see the spec file for savedsearches.conf and the "Set up
alerts in savedsearches.conf" topic in the Admin Manual.
When Splunk automatically saves your searches
The preceding sections show you how to manually save a search you've just run.
But there are also many actions you'll perform as a Splunk user that cause
Splunk to automatically save your search.
Splunk automatically saves searches when you create alerts, dashboard panels,
reports, and scheduled searches via the Splunk Web UI (these are options you
can select after clicking Create for a running, completed, or finalized search).
Note: When Splunk automatically saves a search as the result of the creation of
an alert, dashboard, report, or scheduled search, it does not add the name of that
search to the Searches & Reports list in the app navigation bar near the top of
164
the page after you save the search.
Creating dashboard panels
All dashboard panels are based on searches. If you run a search and then use
the Create Dashboard Panel dialog to create a new panel for a new or
preexisting dashboard, Splunk automatically saves the search that powers the
panel as well. After the panel is created, use the dashboard Edit search dialog
to choose a different saved search for the panel, or just edit the current search
inline. When you edit the panel's search inline, the original saved search is not
updated with those changes.
Note: In the Add to dashboard dialog, saved search permissions are managed
at the dashboard level (in the dialog's Dashboard step).
• If the dashboard panel you are creating is going on an existing dashboard,
the search you are associating with it takes on the same permissions as
that dashboard.
• If the dashboard panel that you are creating is going on a new dashboard,
and you have admin-level permissions, you can keep the dashboard
private, or share the dashboard as read-only with all users of the current
app. (If you do not have admin-level permissions the new dashboard will
be private--viewable only by you--by default. The search you are
associating with the dashboard panel will take on the permissions of the
new dashboard.)
For more information about creating panels for dashboards, see the topic "Create
simple dashboards," in this manual.
Creating alerts and scheduled searches
Alerts are based on saved searches; they can be either real-time searches or
scheduled searches depending on the type of alert that you define. Splunk
saves the search and determines whether it runs in real-time or is a historical,
scheduled search during the alert creation process.
Scheduled searches are essentially scheduled alerts that are designed to
trigger each time they run. They're useful for things like sending reports via email
to a set of recipients on a regular schedule, like "every day at midnight" or "every
Monday, Wednesday, and Friday."
Note: You can also manually set up an existing saved search as an alert or
scheduled search via Manager > Searches and Reports.)
165
Defining reports
When you use the Report Builder to create a report based on a search, Splunk
automatically saves the base search.
Note: This is the only method of saving a search that includes chart formatting
parameters with the search. If your search includes reporting commands, and
you want the chart that the search produces to include custom formatting (so that
it displays a pie chart rather than the default bar chart and has specific text for
the title, x-axis, and y-axis, for example) be sure to save it as a report from the
Report Builder. If you save it as a search, any formatting you set up for the chart
in the report builder will be lost. This is especially important if you intend to
display the chart in a specific way on a dashboard.
For more information about defining and saving reports with the Report Builder,
see "Define reports" and "Save reports and share them with others," in this
manual.
Save search results
Saving search results is different from saving the search itself. When you save a
search, you're saving the search string and time range (as well as any chart or
table formatting associated with the search), so it can easily be run again in the
future. When you save the results of a search, you are saving the outcome of a
specific search job.
If you just want to save the results of a search, click Save and then select Save
results.
When you select Save results, Splunk saves the search job. "Saving a search
job" means that Splunk prevents the search job from expiring--by default all
search jobs are set to expire (self delete) after a certain amount of time. You can
save results for both historical searches and currently running real-time
searches. You can examine the results later by finding the job on the Jobs page.
You get to the Jobs page by clicking the Jobs link in the upper-right hand corner
of the Splunk interface.
166
For more information on managing search jobs through the Job Manager, see
"Supervise your search jobs" in this manual.
Share search results
Sharing search results is different from sharing a saved search. When you share
search results you are making the results of a particular search job available to
other people. If you would like to do this, you have two options: you can save &
share your search job, or you can export the results to a file and send that file to
others.
Saving and sharing results. To do this, click Save and then select Save &
share results... When you do this, Splunk saves the search job just as it does
when you select Save results. In addition, Splunk gives you a URL. You can
share this URL with other interested parties, who can use it to view the search
results for the job it links to as long as they have access to your instance of
Splunk and the job exists in the system.
Export the event data to a file. You can export the event data from your search
job to a csv, xml, json, or raw data file, and then archive it or use it with a
third-party charting application. To do this, run the search, and then select the
Export link that appears above your search results:
You can set a limit for the number of events you want to export, or you can go
ahead and export all the events in your search. Keep in mind that some searches
return enormous numbers of events, so take precautions as necessary for your
situation.
167
Managing saved search navigation
When you save a search, it should appear in one of the drop-down lists in the
top-level navigation menu. In the Search app, for example, new searches appear
in the Searches & Reports list by default.
If you have write permissions for an app, you can change this default location,
and even set things up so that searches with particular keywords in their names
are automatically placed in specific categories in the navigation menu. For
example, you can set things up so that Splunk automatically places saved
searches with the word "website" in their name into a list of website-related
searches in the navigation menu. You can also move searches from the default
list to different locations in the top-level navigation menu.
For an overview of the navigation setup options that are available for saved
searches and reports, see "Define navigation for saved searches and reports" in
the Knowledge Manager manual. For the app navigation setup details, see "Build
navigation for your app" in the Developer manual.
Answers
Have questions? Visit Splunk Answers and see what questions and answers the
Splunk community has around saved searches.
Supervise your search jobs
Each time you run a search or generate a report, Splunk creates a job that
contains the event data returned by that search or report. The Job Manager
enables you to review and oversee your recently dispatched jobs, as well as
those you may have saved earlier.
Just to be clear, jobs are not the same as saved searches and saved reports.
Saved searches and saved reports contain data used to run those searches and
168
reports, such as the search string and the time arguments used to dispatch
searches. Jobs are artifacts of previously run searches and reports. They contain
the results of a particular run of a search or report. Jobs are dispatched by
scheduled searches as well as manual runs of searches and reports in the user
interface.
For more information about saving searches see "Save searches" in this manual.
For more information about saving reports, see "Save reports and share them
with others" in this manual.
You access the Job Manager by clicking the Jobs link in the upper right hand
corner of the screen.
Note: When backgrounded searches are in progress, the Jobs link appears with
the number of running jobs in parentheses.
Use the Job Manager to:
• See a list of the jobs you've recently dispatched or saved for later review,
and use it to compare job statistics (run time, total count of events found,
and so on).
• View the results of any job listed in the Job manager.
♦ If the job is related to a search, you'll see the results in the Search
view.
♦ If the job is related to a report, you'll see the results in the Format
Report page of the Report Builder.
♦ Note: If a job is canceled while you have the Job Manager window
open it can still appear in the Job Manager list, but you won't be
able to view it. If you close and reopen the Job Manager, the
canceled job should disappear.
• Check on the progress of ongoing backgrounded jobs or jobs dispatched
by scheduled searches and pause or stop them if necessary.
• Save or delete any search or report job displayed on the Job Manager (if
you have permissions to see and manage them).
Note: The Job Manager only displays search jobs that you have permission to
see and manage.
Keep in mind that unsaved search jobs expire within a set period of time after
they complete. The default lifespan for manually run search jobs is 10 minutes
(search jobs resulting from scheduled searches typically have much shorter
lifespans). The Expires column tells you how much time each list job has before
it is deleted from the system. If you want to be able to review a search job after
169
that expiration point, or share it with others, save it.
In most views you can save the last search or report job you ran without
accessing the Job Manager page, as long as the job hasn't already expired.
• If you want to save a search job, select Save results from the Actions
dropdown menu in the Search view.
• If you want to save a report job, select Save results only from the Save
menu on the Report formatting page of the Report Builder.
For more information, see "About jobs and jobs management" in the Admin
manual.
170
Automate Monitoring
Monitor recurring situations
If you've read the preceding chapters you have a pretty good idea of how to use
Splunk's powerful search capabilities to learn all kinds of things about the event
data in your system. But this doesn't help you with the myriad of recurring
situations that everyone in IT is faced with on a regular basis. You can't be
running searches yourself all of the time.
This is why we've designed Splunk to be the most flexible monitoring tool in your
arsenal. Every search you design can be set up to run automatically on a regular
schedule. And any scheduled or real-time search can be configured to send alert
messages to you and other interested parties when specific circumstances are
met. You can base these alerts on a wide range of threshold and trend-based
scenarios, including empty shopping carts, brute force firewall attacks, and
server system errors.
In this chapter you'll find:
• A nuts-to-bolts explanation of alert creation, for both scheduled and
real-time searches.
• A variety of alert use case examples.
• A guide to the Alert Manager, which enables you to manage recently
triggered alerts.
Create an alert
Splunk alerts are based on saved searches that run either on a regular interval
(if the saved search is a standard scheduled search) or in real time (if the saved
search is a real-time search). When they are triggered, different actions can
take place, such as the sending of an email with the results of the triggering
search to a predefined list of people.
Splunk enables you to design three broad categories of alerts:
Base
Type of alert search is
a...
Description
171
Alert examples
Real-time
alerts that are
triggered
every time the
base search
returns a
result.
Real time
search
(runs over
all time)
Alerts based
on historical
searches that Historical,
scheduled
run on a
search
regular
schedule.
Real-time
alerts that
monitor
events within
a rolling time
"window".
Real-time
search
Use this alert type if you need to
know the moment a matching result
comes in. Useful if you need to
design an alert for machine
consumption (such as a
workflow-oriented application). You
can also throttle these alerts to
ensure that they aren't triggered too
frequently. Referred to as a
"per-result alert."
This alert type triggers whenever a
scheduled run of a historical search
returns results that meet a particular
condition that you have configured in
the alert definition. Best for cases
where immediate reaction to an alert
is not a priority. You can use
throttling to reduce the frequency of
redundant alerts. Referred to as a
"scheduled alert."
Use this alert type to monitor events
in real time within a rolling time
window of a width that you define,
such as a minute, 10 minutes, or an
hour. The alert is triggered when its
conditions are met by events as they
pass through this window in real
time. You can throttle these alerts to
172
• Trigger an
alert for every
failed login
attempt, but
alert at most
once an hour
for any given
username.
• Trigger an
alert when a
"file system
full" error
occurs on any
host, but only
send
notifications
for any given
host once per
30 minutes.
• Trigger an
alert
whenever the
number of
items sold in
the previous
day is less
than 500.
• Trigger an
alert when the
number of
404 errors in
any 1 hour
interval
exceeds 100.
• Trigger an
alert
whenever
there are
three
consecutive
ensure that they aren't triggered too
frequently. Referred to as a
"rolling-window alert."
failed logins
for a user
between now
and 10
minutes ago,
but don't alert
for any given
user more
than once an
hour.
For more information about these alert types, see the sections below.
You can also create scheduled searches that fire off an action (such as an email
with the results of the scheduled search) each time they are run, whether or not
results are received. For example, you can use this method to set up a "failed
logins" report that is sent out each day by email and which provides information
on the failed logins over the previous day. For more information, see "Set up alert
actions" in this manual.
Note: When Splunk is used out-of-the-box, only users with the Admin role can
run and save real-time searches, schedule searches, or create alerts. In addition
you cannot create saved searches unless your role permissions enable you to do
so. For more information on managing roles, see "Add and edit roles" in the
Admin Manual.
For a series of alert examples showing how you might design alerts for specific
situations using both scheduled and real-time searches, see "Alert use cases"
Get started
If you run a search, like the results it's giving you, and decide that you'd like to
base an alert on it, then click the Create button that appears above the search
timeline.
Select Alert... to open the Create alert dialog on the Schedule step. Give the
alert a Name and then select the alert Schedule. Use Schedule to determine
the type of alert you want to configure. Your choice depends upon what you want
173
to do with your alert.
You can choose:
• Trigger in real-time whenever a result matches
• Run on a schedule once every...
• Monitor in real-time over a rolling window of...
Select the option that best describes the kind of alert you'd like to create.
Define alerts that trigger in real-time whenever a result
matches
If you want an alert that is triggered whenever a matching result comes in, select
a Schedule of Trigger in real-time whenever a result matches from the Schedule
step of the Create alert dialog. Then click Next to go to the Actions step.
This "per-result alert" is the most common alert type. It runs in real-time over an
"all-time" timespan. It is designed to always alert whenever the search returns a
result.
Keep in mind that "events" are not exactly the same as "results": an event is a
type of result. If the underlying search for the alert is designed to return individual
events, that's fine--the alert will trigger each time a matching event is returned.
But you can also design searches that return other kinds of results.
For example, say you're tracking logins to an employees-only section of the store
and you've been having problems with people trying to guess employee logins.
You'd like to set up an alert that is triggered whenever it finds a user that has
made more than two login attempts. This search would return not events, but
usernames of people who fit the search criteria. Each time the search returns a
result (a username) is returned, Splunk triggers the alert, which sets off an
action, such as the sending of an email with the username to a set of recipients.
174
Enable actions for a per-result alert
On the Actions step for a per-result alert, you can enable one or more alert
actions. These actions are set off whenever the alert is triggered.
There are three kinds of alert actions that you can enable through the Create
alert dialog. For Enable actions you can select any combination of:
• Send email - Select to have Splunk send an email to a list of recipients
that you define. You can opt to have this email contain the results of the
triggering search job (the result that triggered the alert, in other words).
• Run a script - Select to have Splunk run a shell script that can perform
some other action, such as the sending of an SNMP trap notification or the
calling of an API. You determine which script is run.
• Show triggered alerts in Alert manager - Have triggered alerts display
in the Alert Manager with a severity level that you define. The severity
level is non-functional and is for informational purposes only. (Note: In
Manager > Searches and Reports, to have trigger records for an alert
display in the Alert Manager, you enable the Tracking alert action.)
You can enable any combination of these alert actions for an individual alert.
Note: You can also arrange to have a triggered alert post its results to an RSS
feed. To enable this option, go to Manager > Searches and Reports and click
the name of the saved search that the alert is based upon. Then, in the Alert
actions section, click Enable for Add to RSS.
Important: Before enabling actions, read "More on alert actions," in this manual.
This topic discusses the various alert actions at length and provides important
information about their setup. It also discusses options that are only available via
the Searches and reports page in Manager, such as the ability to send reports
with alert emails in PDF format, RSS feed notification, and summary indexing
175
enablement.
Set up throttling for a per-result alert
On the Actions step for a per-result alert, you can define its throttling rules. You
use throttling to reduce the frequency at which an alert is triggered. For example,
if your alert is being triggered by very similar events approximately 10 times per
minute, you can set up throttling rules that cut that frequency down to a much
more manageable rate. Throttling rules are especially important for per-result
alerts, because they are based on real-time searches and are triggered each
time they find a matching result.
Splunk's alert throttling rules enable you to throttle results that share the same
field value for a given number of seconds, minutes, or hours. For example, say
you have a search that returns results with username=cmonster and
username=kfrog every 2-3 minutes or so. You don't want to get these alerts every
few minutes; you'd rather not see alerts for any one username value more than
once per hour. So here's what you do when you define an alert for this search:
You select Throttling, enter username under Suppress for results with the
same field value, and select 60 minutes for the throttling interval.
Now, say that after this alert is saved and enabled, the alerting real-time search
matches a result where username=cmonster. The alert is triggered by this result
and an alert email is sent to you. But for the subsequent hour, all following
matching results with username=cmonster are ignored. After 60 minutes are up,
the next matching result with username=cmonster triggers the alert again and
another alert email goes out to you--and then it won't be triggered a third time for
that particular username value until another hour has passed. The Throttling
setting ensures you're not swamped by alert emails from results with
username=cmonster (or any other username value, for that matter).
You can use the Throttling setting to suppress on more than one field. For
example, you might set up a per-result alert that throttles events that share the
same clientip and host values.
For example, you could have a real-time search with a 60 second window that
alerts every time an event with "disk error" event appears. If ten events with the
"disk error" message come in within that window, five disk error alerts will be
176
triggered--ten alerts within one minute. And if the alert is set up so that an email
goes out to a set of recipients each time it's triggered (see "Specify alert actions,"
below), those recipients probably won't see the stack of alert emails as being
terribly helpful.
You can set the Throttling controls so that when one alert of this type is
triggered, all successive alerts of the same type are suppressed for the next 10
minutes. When those 10 minutes are up, the alert can be triggered again and
more emails can be sent out as a result--but once it is triggered, another 10
minutes have to pass before it can be triggered a third time.
In general, when you set up throttling for a real-time search it's best to start with a
throttling period that matches the length of the base search's window, and then
expand the throttling period from there, if necessary. This prevents you from
getting duplicate notifications for a given event.
Note: Throttling settings are not usually required for scheduled searches,
because only one alert is sent out per run of a scheduled search. But if the
search is scheduled to run on a very frequent basis (every five minutes, for
example), you can set the throttling controls to suppress the alert so that a much
larger span of time--say, 60 minutes--has to pass before Splunk can send out
another alert of the same type.
Share per-result alerts with others
On the Sharing step for a per-result alert, you can determine how the alert is
shared. Sharing rules are the same for all alert types: you can opt to keep the
search private, or you can share the alert as read-only to all users of the app
you're currently using. For the latter choice, "read-only" means that other users of
your current app can see and use the alert, but they can't update its definition via
Manager > Searches and reports.
If you have edit permissions for the alert, you can find additional permission
settings in Manager > Searches and reports. For more information about
managing permissions for Splunk knowledge objects (such as alert-enabled
searches) read "Curate Splunk knowledge with Manager" in the Knowledge
177
Manager Manual, specifically the section titled "Share and promote knowledge
objects."
Define alerts that are based on scheduled, historical searches
Scheduled alerts are the second most common alert type. If you want to set up
an alert that evaluates the results of a historical search that runs over a set range
of time on a regular schedule, you would select a Schedule of Run on a
schedule once every... on the Schedule step of the Create alert dialog. Then
you'd select an interval for the schedule and define the alert triggering conditions.
This schedule can be of any duration that you define. For example, say you
handle operations for an online store, and you'd like the store administrators to
receive an alert via email if the total sum of items sold through the store in the
previous day drops below a threshold of 500 items. They don't need to know the
moment this happens, they just want to be alerted on a day by day basis.
To meet these requirements, you'd create an alert based on a search that runs
on a regular schedule. You would schedule the search to run every day at
midnight, and configure it to be triggered whenever the result returned by a
scheduled run of the search--the sum of items sold over the past day--is a
number below 500. And you'd set up an email alert action for the search. This
ensures that when the search is triggered, Splunk sends out an email to every
email address in the alert action definition, which in this case would be the set of
store administrators. Now your administrators will be informed when any midnight
run of the search finds that less than 500 items were purchased in the previous
day.
178
Schedule the alert
You can schedule a search for a scheduled alert on the Schedule step of the
Create Alert dialog. After you select Run on a schedule once every... for the
Schedule field, select the schedule interval from the list that appears. By default
the schedule will be set to Hour but you can change this to Day, Week, Month, or
select Cron schedule to set up a more complicated interval that you define using
standard cron notation.
Note: Splunk only uses 5 parameters for cron notation, not 6. The parameters (*
* * * *) correspond to minute hour day month day-of-week. The 6th parameter
for year, common in other forms of cron notation, is not used.
Here are some cron examples:
*/5 * * * *
*/30 * * * *
0 */12 * * *
*/20 * * * 1-5
0 9 1-7 * 1
:
:
:
:
:
Every
Every
Every
Every
First
5 minutes
30 minutes
12 hours, on the hour
20 minutes, Monday through Friday
Monday of each month, at 9am.
If you set choose Cron schedule, you also need to enter a Search time range
over which you want to run the search. What you enter here will override the time
range you set when you first designed and ran the search. It is recommended
that the execution schedule matches the search time range so that no overlaps
or gaps occurs - for example if you choose to run a search every 20 minutes then
it is recommended that the search's time range be 20 minutes too (-20m)
Alert scheduling: Best practices
• Coordinate the alert's search schedule with the search time range.
This prevents situations where event data is accidentally evaluated twice
by the search (because the search time range exceeds the search
schedule, resulting in overlapping event data sets), or not evaluated at all
(because the search time range is shorter than the search schedule).
• Schedule your alerting searches with at least 60 seconds of delay.
This practice is especially important in distributed search Splunk
implementations where event data may not reach the indexer precisely at
the moment when it is generated. A delay ensures that you are counting
179
all of your events, not just the ones that were quickest to get indexed.
The following example sets up a search that runs every hour at the half hour, and
which collects an hour's worth of event data, beginning an hour and a half before
the search is actually run. This means that when the scheduled search kicks off
at 3:30pm, it is collecting the event data that Splunk indexed from 2:00pm to
3:00pm. In other words, this configuration builds 30 minutes of delay into the
search schedule. However both the search time range and the search schedule
span 1 hour, so there will be no event data overlaps or gaps.
• Select Run on a schedule once every... for Schedule
• Select Cron schedule from the interval list.
• In the cron notation field, enter 30 * * * * to have your search run every
hour on the half hour.
• Set the time range of the search using relative time modifier syntax. Enter
an Earliest time value of -90m and a Latest time value of -30m. This
means that each time the search runs it covers a period that begins 90
minutes before the search launch time, and ends 30 minutes before the
search launch time.
For more information about the relative time modifier syntax for search time
range definition, see "Syntax for relative time modifiers" in this manual.
Alert scheduling: Manage the priority of concurrently scheduled searches
Depending on how you have your Splunk implementation set up, you may only
be able to run one scheduled search at a time. Under this restriction, when you
schedule multiple searches to run at approximately the same time, Splunk's
search scheduler works to ensure that all of your scheduled searches get run
consecutively for the period of time over which they are supposed to gather data.
However, there are cases where you may need to have certain searches run
ahead of others in order to ensure that current data is obtained, or to ensure that
gaps in data collection do not occur (depending on your needs).
You can configure the priority of scheduled searches through edits to
savedsearches.conf. For more information about this feature, see "Configure the
priority of scheduled searches" in the Knowledge Manager manual.
Set up triggering conditions for a scheduled alert
An alert based on a scheduled search is triggered when the results returned by a
scheduled run of the base search meet specific conditions such as passing a
numerical threshold.
180
These triggering conditions break scheduled alerts into two subcategories: basic
conditional scheduled alerts and advanced conditional scheduled alerts. You set
these triggering conditions when you set values for the Trigger if field on the
Schedule step of the Create Alert dialog.
A basic conditional alert is triggered when the number of events in the results
of a scheduled search meet a simple alerting condition (for example, a basic
conditional alert can be triggered when the number of events returned by its
search are greater than, less than, or equal to a number that you provide).
Note: If you define or edit your alert at Manager > Searches and Reports, the
Condition field enables you to additionally set up basic conditional alerts that
monitor numbers of hosts or sources amongst the events reviewed by the
search.
An advanced conditional alert uses a secondary "conditional" search to
evaluate the results of the scheduled or real-time search. With this setup, the
alert is triggered when the secondary search returns any results.
Triggering conditions: Define a basic conditional alert
On the Schedule step of the Create Alert dialog, follow this procedure to define
a basic conditional alert that notifies you when a simple alerting condition is met
by the number of events returned by the search. Schedule must be set to Run
on a schedule once every... in order for you to see the fields described in this
procedure.
1. Set Trigger if to Number of results. This is the basic condition that triggers the
result.
Note: If you are defining or updating your alert at Manager > Searches
and reports the Condition field additionally enables you to select
Number of hosts and Number of sources.
2. Choose a comparison operation from the list below the Trigger if field. You
can select Is greater than, Is less than, Equals to, or Is not equal to depending on
how you want the alerting condition to work.
Note: If you are defining or updating your alert at Manager > Searches
and reports you can additionally select rises by and drops by for
181
comparison operations. These operations compare the results of the
current run of the search against the results returned by the last run of the
search. Rises by and drops by are not available for alerts based on
real-time searches.)
3. In the field adjacent to the comparison operation list, enter an integer to
complete the basic conditional alert. This integer represents a number of events.
The alert is triggered if the results for a scheduled run of the search meet or
exceed the set condition. For example, you can set up an alert for a scheduled
search that sends out a notification if the number of results returned by the
search is less than a threshold of 10 results.
Note: Basic conditional alerts work differently for scheduled searches (which use
a historical, scheduled search) and rolling-window alerts (which use a real-time
search with a rolling time window of a specified width).
When you define a rolling-window alert as a basic conditional alert, the alert is
triggered when the set condition occurs within the rolling time window of the
search. For example, you could have a rolling-window alert that triggers the
moment that the rolling 60 second window for the search has 5 or more results
all at the same time.
Just to be clear, this means that if the real-time search returns one result and
then four more results five minutes later, the alert is not triggered. But if all five
results are returned within a single 60-second span of time, the alert is triggered.
Triggering conditions: Define an advanced conditional alert
In an advanced conditional alert, you define a secondary conditional search that
Splunk applies to the results of the scheduled search. If the secondary search
returns any results, Splunk triggers the alert. This means that you need to use a
secondary search that returns zero results when the alerting conditions are
unmet.
By basing your alert conditions on the result of a secondary conditional search,
you can define specific conditions for triggering alerts and reduce the incidence
of false positive alerts.
182
Follow this procedure to define an advanced conditional alert:
1. In the Trigger if list, select Custom condition is met. The Custom condition
field appears.
2. Enter your conditional search in the Custom condition field.
3. Complete your alert definition by defining alert actions, throttling rules, and
sharing (see below).
Every time the base search runs on its schedule, the conditional search runs
against the output of that search. Splunk triggers the alert if the conditional
search returns one or more results.
Note: If you have set up a Send email action for an alert that uses a conditional
search, and you've arranged for results to be included in the email, be aware that
Splunk will include the results of the original base search. It does not send the
results of the secondary conditional search.
Triggering conditions: Advanced conditional alert example
Lets say you're setting up an alert for the following scheduled search, which is
scheduled to run every 10 minutes:
failed password | stats count by user
This search returns the number of incorrect password entries associated with
each user name.
What you want to do is arrange to have Splunk trigger the alert when the
scheduled search finds more than 10 password failures for any given user. When
the alert is triggered, Splunk sends an email containing the results of the
triggering search to interested parties.
Now, it seems like you could simply append | search count > 10 to the original
scheduled search:
failed password | stats count by user | search count > 10
Unfortunately, if you create a basic conditional alert based on this search, where
an alert is triggered when the number of results returned by the base search is
greater than 10, you won't get the behavior you desire. This is because this new
search only returns user names that are associated with 10+ failed password
entries--the actual count values are left out. When the alert is triggered and the
results are emailed to stakeholders, you want the recipients to have a listing that
183
matches each user name to the precise number of failed password attempts that
it is associated with.
What you want to do is set Condition to If custom condition is met and then
place search count > 10 in the Custom condition search field (while removing
it from the base search). This conditional search runs against the results of the
original scheduled search (failed password | stats count by user). With this,
the alert is triggered only when the custom condition is met--when there are 1 or
more user names associated with 10 failed password entries. But when it is
triggered, the results of the original search--the list of user names and their failed
password counts--is sent to stakeholders via email.
Note: Advanced conditional alerts work slightly differently when you are
designing them for rolling-window alerts, which run in in real-time rather than on
a schedule. In the case of the above example, you could design a rolling-window
alert with the same base search and get similar results with the custom condition
search as long as the rolling window was set to be 10 minutes wide. As soon as
the real-time search returns 10 failed password entries for the same user within
that 10-minute span of time, the alert is triggered.
For more examples of scheduled alerts, see "Alert examples," in this manual.
Enable actions for an alert based on a scheduled search
On the Actions step for a scheduled alert, you can enable one or more alert
actions. These actions are set off whenever the alert is triggered.
There are three kinds of alert actions that you can enable through the Create
alert dialog. For Enable actions you can select any combination of:
• Send email - Send an email to a list of recipients that you define. You can
opt to have this email contain the results of the triggering search job.
• Run a script - Run a shell script that can perform some other action, such
as the sending of an SNMP trap notification or the calling of an API. You
determine which script is run.
• Show triggered alerts in Alert manager - Have triggered alerts display
in the Alert Manager with a severity level that you define. The severity
level is non-functional and is for informational purposes only. (Note: In
Manager > Searches and Reports, to have trigger records for an alert
display in the Alert Manager, you enable the Tracking alert action.)
You can enable any combination of these alert actions for an individual alert.
184
Note: You can also arrange to have Splunk post the result of the triggered alert
to an RSS feed. To enable this option, go to Manager > Searches and Reports
and click the name of the search that the alert is based upon. Then, in the Alert
actions section, click Enable for Add to RSS.
Important: Before enabling actions, read "More on alert actions," in this manual.
This topic discusses the various alert actions at length and provides important
information about their setup. It also discusses options that are only available via
the Searches and reports page in Manager, such as the ability to send reports
with alert emails in PDF format, RSS feed notification, and summary indexing
enablement.
Determine how often actions are executed when scheduled alerts are
triggered
When you are setting up an alert based on a scheduled, historical search, you
use the last two settings on the Actions step--Execute actions on and
Throttling--to determine how often Splunk executes actions after an alert is
triggered.
Execute actions on enables you to say that once an alert is triggered, the alert
actions are executed for All results returned by the triggering search, or Each
result returned by the triggering search. In other words, you can set it up so that
actions are triggered only once per search, or so that actions are triggered
multiple times per search: once for each result returned.
After you choose that setting, you can choose whether or not those actions
should be throttled in some manner.
If you select All results, you can say that later alert actions should be
suppressed for a specific number of seconds, minutes, or hours.
185
For example, say you have an alert based on a scheduled search that runs every
half hour.
• It has All results selected and throttling set to suppress actions for two
hours, and on the Actions step it has Send email and Show triggered
results in Alert manager set as alert actions.
• It runs on its schedule, and the alerting conditions are met, so it is
triggered.
• Alert actions are executed once for all results returned by the alert, per the
All results setting. Splunk sends alert emails out to the listed recipients
and shows the triggered alert on the Alert manager page.
• Then the alert runs again on its schedule, a half-hour later, and it's
triggered again. But because the alert's throttling controls are set to
suppress alert actions for two hours, nothing happens. No more alert
actions can be executed until two hours (or three more runs of the
scheduled search upon which the alert is based) have passed.
If the alert is triggered again after the two hours are up, the alert actions are
executed again, same as they were last time. And then they are suppressed
again for another two hours.
If you select Each result, the throttling rules are different, because when the
alert is triggered, multiple actions can be executed, one for each result returned
by the search. You can throttle action execution for results that share a particular
field value.
Here's an example of a scheduled alert that performs actions for every result
once it's triggered:
Say you're a system administrator who is responsible for a number of network
servers, and when these servers experience excessive amounts of errors over a
24-hour period, you'd like to run a system check on them to get more information.
Servers are identified in your logs with the servername field. Here's what you do:
186
1. Start by designing a script that performs a system check of a network server
when it's given a value for the servername field, and which subsequently returns
the results of that check back to you.
2. Then design a search that returns the servername values of machines that
have experienced 5 or more errors over the past 24 hours, one value per result.
3. Next, open the Create Alert dialog for this search. In the Schedule step, use
cron notation to schedule the search so it runs once each day at midnight.
Because its defined time range is the past 24 hours, this means it'll return results
for the previous day.
4. Set the search up so that it's triggered whenever more than 0 results are
returned.
5. On the Actions step, enable the Run a script action and assign your system
check script to it.
6. Finally, set up the alert so that when it's triggered, it executes the "run script"
action for each result received.
This is a case where you'd likely keep throttling off, since your search is set up to
return error sums by servername, and only for those servers that experience > 5
errors in the 24 hour time range of the search. You won't have to worry about
getting multiple results with the same servername value, and there probably isn't
much value in suppressing events when the search is run on a daily basis.
Share scheduled alerts with others
On the Sharing step for an alert based on a scheduled search, you can
determine how the alert is shared. Sharing rules are the same for all alert types:
you can opt to keep the search private, or you can share the alert as read-only to
all users of the app you're currently using. For the latter choice, "read-only"
means that other users of your current app can see and use the alert, but they
can't update its definition via Manager > Searches and reports.
187
If you have edit permissions for the alert, you can find additional permission
settings in Manager > Searches and reports. For more information about
managing permissions for Splunk knowledge objects (such as alert-enabled
searches) read "Curate Splunk knowledge with Manager" in the Knowledge
Manager Manual, specifically the section titled "Share and promote knowledge
objects."
Define alerts that monitor matching results in real-time within
a rolling window
The third alert type enables you to set up alerts that monitors and evaluates
events in real time within a rolling window. The moment that alert conditions are
met by the events that are returned within this window, the alert is triggered.
The rolling-window alert type is in some ways a hybrid of the first two alert types.
Like the per-result alert type, it is based on a real-time search. However, it isn't
triggered each time a matching result is returned by the search. Instead, it
evaluates all of the events within the rolling window in real time, and is triggered
the moment that specific conditions are met by the events passing through that
window, just like a scheduled alert is triggered when specific conditions are met
by a scheduled run of its search.
When you define a real-time rolling window search, you first set the length of the
real-time window, and then you define the triggering conditions. Then you enable
the alert actions and define action execution and throttling rules.
For example, you could up an alert that is triggered whenever there are three
failed logins for the same username value over the last 10 minutes (using a
real-time search with a 10 minute window). You can also arrange to throttle the
alert so that it is not triggered for the same username value more than once an
hour.
188
Set the width of the rolling window
When you define a rolling-window alert, the first thing you do is set the width of
the real-time window. Real-time search windows can be set to any number of
minutes, hours or days. In the 'Schedule step, select Monitor in real-time over a
rolling window of... for the Schedule field. Then, in the fields that appear below
the Schedule field define the width of the real-time search window by entering a
specific number of minutes, hours, or days.
The alert will monitor events as they pass through this window in real-time. For
example, you might have an alert that is triggered whenever any particular user
fails to login more than 4 times in a 10 minute span of time. After the alert is set
up, various login failure events will pass through this window, but the alert is only
triggered when 4 login failures for the same user exist within the span of the 10
minute window at the same time.
If a user experiences three login failures in quick succession, then waits 11
minutes, and then has another login failure, the alert won't be triggered, because
the first three events will have passed out of the window by the time the fourth
one took place.
Set up triggering conditions for a rolling-window alert
Rolling-window alerts are triggered when the results within their rolling window
meet specific conditions such as passing a numerical threshold.
These triggering conditions break rolling-window alerts into two subcategories:
basic conditional rolling-window alerts and advanced conditional rolling-window
alerts. You define these triggering conditions when you set values for the Trigger
if field on the Schedule step of the Create Alert dialog.
The definition of these triggering conditions is handled in exactly the same
manner for rolling-window alerts as for scheduled alerts, except that in this case
the alert is triggered whenever results within the rolling window meet the
specified triggering conditions.
For example, in the case of a basic conditional alert setup, where the triggering
condition involves the search result count being greater than, less than, equal to,
or unequal to a specific number, this condition must exist within the rolling
real-time window for the alert to be triggered. If the alert is triggered when the
number of results becomes greater than 100, then the alert won't be triggered
until 101 results exist within the rolling window at the same time.
189
Advanced conditional searches also work in much the same way for
rolling-window alerts as they do for scheduled alerts. The only difference is that
in this case the secondary, conditional search runs in real time as well. It
continuously evaluates the results returned in the time range window of the
original real time search. The alert is triggered at the moment when a single
result is returned by the conditional search.
Note: How do you deal with a situation where an alert would continue to be
triggered with each new result received? To take the basic conditional alert
example, what if there's a rush of matching results and the "greater than 100"
condition is met by all of them? It could potentially lead to a corresponding rush
of alert emails--something that wouldn't be appreciated by their recipients. That's
why you use throttling to keep alerts from being triggered too frequently. See the
section on configuring throttling for rolling-window alerts, below.
For a full explanation of triggering condition set up and the differences between
basic and advanced conditional alerts, see the section "Set up triggering
conditions for a scheduled alert," above and the three "Triggering conditions"
topic sections that follow.
Enable actions for a rolling-window alert
On the Actions step for a rolling-window alert, you can enable one or more alert
actions. These actions are set off whenever the alert is triggered.
There are three kinds of alert actions that you can enable through the Create
alert dialog. For Enable actions you can select any combination of:
• Send email - Send an email to a list of recipients that you define. You can
opt to have this email contain the results of the triggering search job.
• Run a script - Run a shell script that can perform some other action, such
as the sending of an SNMP trap notification or the calling of an API. You
determine which script is run.
• Show triggered alerts in Alert manager - Have triggered alerts display
in the Alert Manager with a severity level that you define. The severity
level is non-functional and is for informational purposes only. (Note: In
Manager > Searches and Reports, to have trigger records for an alert
display in the Alert Manager, you enable the Tracking alert action.)
You can enable any combination of these alert actions for an individual alert.
190
Note: You can also arrange to have Splunk post the result of the triggered alert
to an RSS feed. To enable this option, go to Manager > Searches and Reports
and click the name of the search that the alert is based upon. Then, in the Alert
actions section, click Enable for Add to RSS.
Important: Before enabling actions, read "More on alert actions," in this manual.
This topic discusses the various alert actions at length and provides important
information about their setup. It also discusses options that are only available via
the Searches and reports page in Manager, such as the ability to send reports
with alert emails in PDF format, RSS feed notification, and summary indexing
enablement.
Determine how often actions are executed when rolling-window alerts are
triggered
When you are setting up an alert based on a real-time search with a rolling
window, you use the last two settings on the Actions step--Execute actions on
and Throttling to determine how often Splunk executes actions after an alert is
triggered.
This functionality works for rolling-window alerts in exactly the same way that it
does for scheduled alerts, except that in this case you're dealing with alerts that
are being triggered in real time.
You can use Execute actions on to say that once the results in the rolling
window meet the conditions required to trigger the alert, the alert actions are
carried out once for All results triggering the alert or Each result. You might
choose the latter if your search is triggered by a small number of results, or if you
are using a script to feed information about each individual result into a machine
process.
191
Execute actions on enables you to say that once an alert is triggered, the alert
actions are executed for All results returned by the triggering search, or Each
result returned by the triggering search. And then you can choose whether or not
these actions should be throttled, and if so, how.
If you select All results, you can say that later alert actions should be throttled
for a specific number of seconds, minutes, or hours.
If you select Each result, the throttling rules are different, because when the
alert is triggered, multiple actions can be executed, one for each result returned
by the search. You can throttle action execution for results that share a particular
field value.
For example, say you have an rolling-window alert with a 10-minute window that
is set to alert whenever any user has more than 10 password failures within that
timeframe. The essentially performs a running count of password fail events per
user, and then uses a conditional search to look through those events for users
with > 10 password failures.
• On the Actions step it has Send email and Show triggered results in Alert
manager selected.
• It's set to execute actions on Each result. In this case there should be a
single result: a username with a corresponding failed password event
count.
• For Throttling it's set to suppress for results that have the same value of
username for an hour. This means that even if a user keeps making failed
password attempts every few seconds you won't see more alerts triggered
for that same person for another hour.
So you start the alert and eventually user mpoppins makes more than 10
password attempts within the past 10 minutes. This triggers the alert, which
sends out an email with his name and the event count to the list of recipients.
The alert is also recorded in the Alert manager. Even though mpoppins keeps on
making failed password attempts the throttling setting ensures that the alert won't
be triggered again by matching events featuring mpoppins for an hour.
192
For more examples of alerts that use the All results and Each result settings in
conjunction with various throttling settings, see the corresponding discussion for
scheduled alerts, above.
Share rolling-window alerts with others
On the Sharing step for rolling-window alert, you can determine how the alert is
shared. Sharing rules are the same for all alert types: you can opt to keep the
search private, or you can share the alert as read-only to all users of the app
you're currently using. For the latter choice, "read-only" means that other users of
your current app can see and use the alert, but they can't update its definition via
Manager > Searches and reports.
If you have edit permissions for the alert, you can find additional permission
settings in Manager > Searches and reports. For more information about
managing permissions for Splunk knowledge objects (such as alert-enabled
searches) read "Curate Splunk knowledge with Manager" in the Knowledge
Manager Manual, specifically the section titled "Share and promote knowledge
objects."
Use Manager to update and expand alert functionality
Alerts are essentially saved searches that have had extra settings configured for
them. If you want to add or change alert settings for a preexisting saved search,
go to Manager > Searches and Reports and locate the search you'd like to
update (if you're updating an existing alert, look for a search with the same name
as the alert). Click the search name to open the search detail page. This page
contains all of the settings that you would otherwise see in the Create Alert
dialog, plus a few additional settings that are only available there. You may need
to select Schedule this search to expose the scheduling and alert setup
controls if the search hasn't been defined as an alert already.
When you are in Manager, keep in mind that you can only edit existing searches
that you have both read and write permissions for. Searches can also be
associated with specific apps, which means that you have to be using that app in
193
order to see and edit the search. For more information about sharing and
promoting saved searches (as well as other Splunk knowledge objects), see
"Curate Splunk knowledge with Manager" in the Knowledge Manager manual.
Define the alert retention time
You can determine how long Splunk keeps a record of your triggered alerts. You
can manage alert expiration for preexisting alerts in Manager > Searches and
Reports. On the detail page for an alerting search, use the Expiration field to
define the amount of time that an alert's triggered alert records (and their
associated search artifacts) are retained by Splunk.
You can choose a preset expiration point for the alert records associated with
this search, such as after 24 hours, or you can define a custom expiration time.
Note: If you set an expiration time for the alert records, be sure to also set the
alert up so that Splunk keeps records of the triggered alerts on the Alert Manager
page. To do this in the Alert Manager dialog, select Show triggered alerts in Alert
Manager under Enable actions on the Actions step. To set this up in Manager
> Searches and Reports, go to the detail page for the alerting search and
enable the Tracking alert action.
To review and manage your triggered alerts, go to the Alert manager by clicking
the Alerts link in the upper right-hand corner of the Splunk interface. For more
information about using it, see the "Review triggered alerts" topic in this manual.
Specify fields to show in alerts through search language
When Splunk provides the results of the alerting search job (in an alert email, for
example), it includes all the fields in those results. To have certain fields included
in or excluded from the results, use the fields command in the base search for
the alert.
• To eliminate a field from the search results, pipe your search to fields $FIELDNAME.
• To add a field to the search results, pipe your search to fields +
$FIELDNAME.
194
You can specify multiple fields to include and exclude in one string. For example,
your Search field may be:
yoursearch | fields - $FIELD1,$FIELD2 + $FIELD3,$FIELD4
The alert you receive will exclude $FIELD1 and $FIELD2, but include $FIELD3 and
$FIELD4.
Set up alert actions
This section provides more information about the various kinds of alert actions
that you can enable for an alert. Your alert action choices are the same for all
three alert actions.
You can enable email notification, the running of scripts, and the display of
triggered alerts in Alert manager via the Actions step of the Create Alert dialog.
There are additional actions available for alerts in Manager. If you go to Manager
> Searches and Reports and either define a new alert or open the detail page
for an existing saved search upon which an alert is based, you will find that you
can additionally enable RSS notification and turn on summary indexing for alerts.
For more information on how these alert actions work, see the sections below.
Note: This topic does not explain how to set up alerts. For a full overview of the
alert creation process, see "Create an alert," in this manual.
Send an email
If you want Splunk to contact stakeholders when the alert is triggered, select
Send email under Enable actions.
Under Addresses, enter a comma-separated list of email addresses to which the
alert should be sent. Under Subject, supply a subject header for the email. By
default it is set to be Splunk Alert: $name$. Splunk will replace $name$ with the
saved search name.
Note: For your email notifications to work correctly, you first need to have your
email alert settings configured in Manager. See the subsection "Configure email
alert settings in Manager," below.
195
Send results in alert emails
When you're defining an alert, you can optionally arrange to have email alert
notifications contain the results of the searches that trigger them. This works best
when the search returns a single value, a truncated list (such as the result of a
search that returns only the top 20 matching results) or a table.
In the Actions step of the Create Alert dialog, select Include results as and
select either as CSV or inline. Splunk delivers inline results as part of the body of
the alert email. If you select as CSV, Splunk will put the results in .CSV format
and attach the file to the alert notification email.
The result inclusion method is controlled via alert_actions.conf (at a global
level) or savedsearches.conf (at an individual search level); for more information
see "Set up alerts in savedsearches.conf" in the Admin Manual.
If you have the PDF Report Server app set up you can alternatively arrange to
have results sent as .PDF attachments. To arrange this go to Manager >
Searches and Reports and open the detail page for the underlying search. In
the Alert Actions section see that Enable is selected for Send email and then
select Include PDF version of results. This setting will be unavailable if your
PDF Report Server app is not installed.
Important: You cannot configure alerts to send results as PDF attachments until
you install the PDF Report Server app on a central Linux host. If you aren't
running this app, the as PDF option for Include search results will be
unavailable. To get PDF printing working, contact a system administrator. For
more information see "Configure PDF printing for Splunk Web" in the Installation
manual.
196
You can also arrange to have PDF printouts of dashboards delivered by email on
a set schedule. For more information, see "Schedule delivery of dashboard PDF
printouts via email" in this manual.
The following is an example of what an email alert looks like when results are
included inline (in the body of the email):
Configure email alert settings in Manager
Email alerting will not work if the email alert settings in Manager are not
configured, or are configured incorrectly. You can define these settings at
Manager > System settings > Email alert settings. Here you can define the
Mail server settings (the mail host, username, password, and so on) and the
Email format (link hostname, email subject and format, include inline results,
and so on).
If you don't see System settings or Email alert settings in Manager, you do not
have permission to edit the settings. In this case, contact your Splunk Admin.
You can also use configuration files to set up email alert settings. You can
configure them for your entire Splunk implementation in alert_actions.conf,
and you can configure them at the individual search level in savedsearches.conf.
For more information about .conf file management of saved searches and alert
settings see "Set up alerts in savedsearches.conf" in the Admin Manual.
Note: If you are sending search results as PDF attachments (see above), the link
hostname field must be the search head hostname for the instance sending
requests to a PDF Report Server. Set this option only if the hostname that is
autodetected by default is not correct for your environment.
Run a script
If you want Splunk to run an alert script when the alert is triggered, select Run a
script under Enable actions and enter the file name of the script that you want
197
Splunk to execute.
For example, you may want an alert to run a script that generates an SNMP trap
notification and sends it to another system such as a Network Systems
Management console when its alerting conditions are met. Meanwhile, you could
have a different alert that, when triggered, runs a script that calls an API, which in
turn sends the triggering event to another system.
Note: For security reasons, all alert scripts must be placed in
$SPLUNK_HOME/bin/scripts or $SPLUNK_HOME/etc/<AppName>/bin/scripts. This is
where Splunk will look for any script triggered by an alert.
For detailed instruction on alert script configuration using savedsearches.conf in
conjunction with shell script or batch file that you create, see "Configure scripted
alerts" in the Admin Manual.
If you are having trouble with your alert scripts, check out this excellent topic on
troubleshooting alert scripts on the Splunk Community Wiki.
Show triggered alerts in the Alert manager
If you want to have the Alert manager keep records of the triggered alerts related
to a particular alert configuration, select the Show triggered alerts in Alert
manager checkbox. The Alert manager will keep records of triggered alerts for
the duration specified in the Expiration field on the Set Up Alert step of the
Create Alert dialog box.
For more information about the Alert manager and how it is used, see the
"Review triggered alerts" topic in this manual.
Give tracked alerts a severity level
On the Alert manager page, each alert is labeled with a Severity level that helps
people know how important each alert is in relation to other alerts. For example,
an alert that lets you know that a server is approaching disk capacity could be
given a High label, while an alert triggered by a "disk full" error could have a
Critical label.
You can choose from Info, Low, Medium, High, and Critical. The default is
Medium.
198
Severity labels are informational in purpose and have no additional functionality.
You can use them to quickly pick out important alerts from the alert listing on the
Alert manager page. Get to the Alert manager page by clicking the Alerts link in
the upper right-hand corner of the Splunk interface.
Alert action functionality available in Manager
If you create or update your alert in Manager > Searches and Reports you'll
find addtional alert action options. For example, you can opt to have
alert-triggering results sent to an RSS feed.
Create an RSS feed
If you want Splunk to post this alert to an RSS feed when it is triggered, select
Enable next to Add to RSS on the detail page for the alerting search in Manager
> Searches and Reports.
When an alert with the Add to RSS action enabled is triggered, Splunk sends a
notification out to its RSS feed. The feed is located at
http://[splunkhost]:[port]/rss/[saved_search_name]. So, let's say you're
running a search titled "errors_last15" and have a Splunk instance that is located
on localhost and uses port 8000, the correct link for the RSS feed would be
http://localhost:8000/rss/errors_last15.
You can also find links to the RSS feeds for alerting searches at Manager >
Searches and reports. Searches that have Add to RSS enabled display an
RSS symbol in the RSS feed column:
Click on this symbol to go to the RSS feed.
Note: An RSS feed for an alerting search won't display anything until the alert
has been triggered at least once. If the alert is based on a scheduled search that
is set to alert each time it is run (it has Perform actions to always), you'll see
search information in the RSS feed after first time the search runs on its
schedule.
Warning: The RSS feed is exposed to any user with access to the webserver
that displays it. Unauthorized users can't follow the RSS link back to the Splunk
application to view the results of a particular search, but they can see the
199
summarization displayed in the RSS feed, which includes the name of the search
that was run and the number of results returned by the search.
Here's an example of the XML that generates the feed:
<?xml version="1.0" encoding="UTF-8"?>
<rss version="2.0">
<channel>
<title>Alert: errors last15</title>
<link>http://localhost:8000/app/search/@go?sid=scheduler_Z2d1cHRh</link>
<description>Saved Searches Feed for saved search errors
last15</description>
<item>
<title>errors last15</title>
<link>http://localhost:8000/app/search/@go?sid=scheduler_Z2d1cHRh</link>
<description>Alert trigger: errors last15,
results.count=123 </description>
<pubDate>Mon, 01 Feb 2010 12:55:09 -0800</pubDate>
</item>
</channel>
</rss>
Enable summary indexing
Summary indexing is an alert action that you can configure for any alert via
Manager > Searches and Reports. You use summary indexing when you need
to perform analysis/reports on large amounts of data over long timespans, which
typically can be quite time consuming, and a drain on performance if several
users are running similar searches on a regular basis.
With summary indexing, you base an alert on a search that computes sufficient
statistics (a summary) for events covering a slice of time. The search is set up so
that each time it runs on its schedule, the search results are saved into a
summary index that you designate. You can then run searches against this
smaller (and thus faster) summary index instead of working with the much larger
dataset from which the summary index receives its events.
To set up summary indexing for an alert, go to Manager > Searches and
Reports, and either add a new saved search or open up the detail page for an
existing search or alert. (You cannot set up summary indexing through the
Create Alert window.) To enable the summary index to gather data on a regular
interval, set its Alert condition to always and then select Enable under
Summary indexing at the bottom of the view.
200
Note: There's more to summary indexing--you should take care how you
construct the search that populates the summary index and in most cases
special reporting commands should be used. Do not attempt to set up a
summary index until you have read and understood "Use summary
indexing for increased reporting efficiency" in the Knowledge Manager
manual.
Alert examples
This topic presents a variety of alerting use cases that show you how alerts can
help provide operational intelligence around network security, system
administration, SLA compliance, and more.
Alerting when an event occurs - "File system full" error
Imagine that you're a system administrator who needs prompt notification when a
file system full error occurs on any host--but you don't want to get more than
one alert per 10 minute period.
Here's an example of the sort of events that you're on the lookout for:
Jan 27
Jan 27
system
Jan 27
system
Jan 27
Jan 27
system
Jan 27
system
03:21:00
03:21:00
full
03:21:49
full
03:22:00
03:22:00
full
03:22:56
full
MMPAD last message repeated 3 times
MMPAD ufs: [ID 845546 kern.notice] NOTICE: alloc: /:file
MMPAD ufs: [ID 845546 kern.notice] NOTICE: alloc: /:file
MMPAD last message repeated 3 times
MMPAD ufs: [ID 845546 kern.notice] NOTICE: alloc: /:file
MMPAD ufs: [ID 845546 kern.notice] NOTICE: alloc: /:file
Now, you can easily set up a simple search to find these events:
file system full
It's pretty easy to define a basic conditional alert that sends out an alert when
the search returns one or more file system full error events. When you create the
alert, just set the Condition to If number of events is greater than 0.
201
However, you also need to determine whether the alert should be scheduled as a
scheduled alert or a real-time alert. The deciding factor here is: How quickly do
you feel that you need to know about the "file system full" error? Do you want to
know the moment the error occurs, or is it ok if you are notified on a "timely"
basis (in other words, when the alert is triggered by a search running on a
particular schedule).
Using a real-time search to catch the "file system full" error event
If you want to be alerted shortly after the first "file system full" error is received,
you'll want to set up a real-time alert with a one minute window (by giving it a
Time range of rt-1m to rt). We suggest you use a one minute window rather than
a shorter window (such as 30 seconds) for alerts because the real-time search
only finds events that occur within the real-time window. A 30 second window
might be fine if there is no latency in your system, but all too often search loads
and other issues can cause certain events to come in late and be "missed" by the
real-time search because its window is too brief.
If you find that a one minute window is too long for your purposes (because the
alert has to be suppressed for at least that length of time) you have another
option: you can keep the window short, but offset it by a minute. A Time range of
rt-90s to rt-60s sets up a one minute buffer that allows all events to come in
before they are captured by the 30 second real-time search window.
But remember, you only want to get one alert every 10 minutes, and as you can
see from the event listing excerpt above, you can get numerous "file system full"
errors in the space of just a few minutes. To deal with that, set Throttling to 10
minutes. This ensures that once the first "file system full" error alert is triggered,
successive "file system error" events won't trigger another alert until 10 minutes
have passed.
202
With a 10-minute Throttling setting, you might get an alert email shortly after you
start the search, with information on the "file system error" event that triggered it,
as well as any other events that were captured within the one minute time
window at the time the triggering event came in. But after that first alert is
triggered, the 10 minute throttling period kicks in. During the throttling period,
subsequent "file system error" events do not trigger the alert. Once the 10 minute
throttling period is up, the alert can be triggered again when a new "file system
error" event is received. When the alert is triggered, another email goes out, and
the throttling period is enforced again for another 10 minutes. And so on. Each
time the alert is triggered, the email that goes out only provides information on
the one event that triggered it, plus any others that happen to fit within its
30-second time window.
Using a scheduled search to catch the "file system full" error event
On the other hand, if you just want to get timely notification for a "file system full"
error event, you can base the alarm on a scheduled search that runs every 10
minutes over the past 10 minutes. Because the search is run on a 10 minute
interval, you won't get alerts the moment a "file system full" event is received;
instead you'll get an alert after the search runs on its schedule. If an alert is
triggered by this scheduled search it returns a list all of the "file system error"
events that were received during that 10 minute period (although only one event
needs to be received to trigger the alert).
You don't need to set up a 10 minute throttling period for this search because the
search already runs on a 10 minute interval. However, if you would prefer there
be a longer interval between triggered alert actions, you could throttle
subsequent alerts for whatever period over 10 minutes you deem appropriate.
For example, you could choose to set a throttling period of 60 minutes, 2 hours,
or even 1 day. It's up to you.
Use a custom search to alert when a statistical threshold is
reached
In this example, you want to get an alert if Splunk detects an sshd brute force
attack. This could be indicated by 5 or more failed ssh attempts within one
minute, from the same ip address and targeted against a single host.
Here's an example of the events that you're on the lookout for:
Jun 26 22:31:04 victim sshd[15384]:
from ::ffff:w.x.y.z port 30937 ssh2
203
Failed password for root
Jun 26 22:31:06 victim sshd[15386]:
Illegal user network
from ::ffff:w.x.y.z
Jun 26 22:31:06 victim sshd[15386]:
error: Could not get
information for NOUSER
Jun 26 22:31:06 victim sshd[15386]: Failed password
for
network from ::ffff:w.x.y.z port 30951 ssh2
Jun 26 22:31:08 victim sshd[15388]:
Illegal user word
from ::ffff:w.x.y.z
Jun 26 22:31:08 victim sshd[15388]:
error: Could not get
information for NOUSER
Jun 26 22:31:08 victim sshd[15388]: Failed password
for
word from ::ffff:w.x.y.z port 30963 ssh2
Jun 26 22:31:10 victim sshd[15390]: Failed password
for
from ::ffff:w.x.y.z port 30980 ssh2
Jun 26 22:31:11 victim sshd[15392]: Failed password
for
from ::ffff:w.x.y.z port 30992 ssh2
Jun 26 22:31:13 victim sshd[15394]: Failed password
for
from ::ffff:w.x.y.z port 31007 ssh2
Jun 26 22:31:15 victim sshd[15396]: Failed password
for
from ::ffff:w.x.y.z port 31021 ssh2
Jun 26 22:31:17 victim sshd[15398]: Failed password
for
from ::ffff:w.x.y.z port 31031 ssh2
Jun 26 22:31:19 victim sshd[15400]: Failed password
for
from ::ffff:w.x.y.z port 31049 ssh2
Jun 26 22:31:20 victim sshd[15403]: Failed password
for
from ::ffff:w.x.y.z port 31062 ssh2
Jun 26 22:31:22 victim sshd[15405]: Failed password
for
from ::ffff:w.x.y.z port 31073 ssh2
shadow
illegal user
shadow
illegal user
root
root
root
root
root
root
root
root
How do you set up this alert? You might begin by basing it on a fairly simple
search:
Failed password sshd
This search finds the failed ssh attempts, and if that was all you were looking for,
you could set a basic Condition like greater than 4 to alert you when 5 such
events come in within a given time window (if you base the alert on a real-time
search) or search interval (if you base the alert on a scheduled search).
But this doesn't help you set up an alert that triggers when 5 or more matching
events that come from the same ip address and are targeted against a single
host come in within a one minute window. To do this you need to define an
advanced conditional alert that uses a secondary custom search to sort
through the events returned by the base search. But before you design that, you
should first fix the base search.
204
Base search - Refine to provide better, more useful results
The base search results are what gets sent in the alert email or rss feed update
when the alert is triggered. You should try to make those results as informative
as possible.
The following search goes through the "failed password sshd" events that it finds
within a given one minute window or interval, groups the events together
according to their destip and srcip combination, generates a count of each
combination, and then arranges this information in an easy-to-read table.
Failed password sshd | stats count by srcip,destip | table srcip destip
count
The table below gives you an idea of the results that this search would return. It
shows that four different groups of events were found, each with a specific
scrip/destip combination, and it provides a count of the events in each group.
Apparently, there were eight failed ssh password attempts from someone at
<srcip1> that targeted <destip2>, all within a one minute timeframe.
srcip
destip
count
<srcip1>
<destip1>
3
<srcip1>
<destip2>
8
<srcip2>
<destip2>
2
<srcip2>
<destip3>
3
Custom conditional search - Alert when more than 5 events with the same
destip-srcip combination are found
Then you set up an advanced conditional custom search that analyzes the
results of the base search to find results where the count of any destip/srcip
combination exceeds 5 in a 60 second timespan.
search count > 5
This custom search would trigger an alert when the results described in the table
above come in, due to that set of 8 events.
205
Should it be a real-time or scheduled alert?
You'll probably want to set this up as a real-time search. Scheduled searches can
cause performance issues when they run over intervals as short as 1 minute.
They can also be a bit inaccurate in situations where, for example, 2 qualifying
events come in towards the end of one interval and 4 more come in at the start of
the subsequent interval.
To set the alert up as a real-time alert, you would give its base search a start
time of rt-60s and an end time of rt.
You'll likely also want to set up a throttling period for this search to avoid being
overwhelmed by alerts. The setting you choose largely depends on how often
you want to get notified about alerts of this nature. For example, you might set it
up so that once an alert is triggered, it can't be triggered again for a half hour.
Alerting when a set of IDS solutions report a network attack
more than 20 times within a 10 minute period
In this example, you're using a set of intrusion detection systems (IDS), such as
Snort, to identify attacks against your network. You want to get an alert when
three of these IDS technologies report an attack more than 20 times in 10
minutes. After you get the alert, you don't want another one until at least 10
minutes have passed.
Base search - Get the IDS types with more than 20 attack events in a given
10-minute span of time
To begin with, let's assume that you have set things up so that all of your IDS
error events are grouped together by the ids_violation source type and
ids_attack event type, and the IDS type is indicated by the idstype field. You
can then create a base search for the alert that creates a table that matches
206
each value of idstype found with the actual count of events for each ids type.
Finally, it filters this table so that only IDS types with 20 or more events are
displayed:
sourcetype=ids_violation eventtype=ids_attack | stats count by idstype
| search count >= 20
This base search gives you a table that could look something like this:
idstype
count
snort
12
ossec
32
fragrouter
27
BASE
26
You can set this base search up as a real-time search or a scheduled search, but
either way it needs to capture data over 10 minute interval or window. The Time
Range for the real-time search would be rt-10m to rt. The Time Range for the
scheduled search would be -10m@m to now and its interval would be "every 10
minutes."
Custom conditional search - Alert when there are 3 or more IDS types with
20+ events in a given 10-minute span of time
Now that you've set up a a base search that returns only those IDS types that
have more than 20 attack events in a 10-minute span, you need to define a
conditional search that goes further by insuring that the alert is only triggered
when the results of the base search return 20 or more events and include 3 or
more IDS types.
To do this, set Condition to if custom condition is met and then enter this
conditional search, which looks at the events returned by the base search and
triggers an alert if it finds more than 3 IDS types with 20 or more events each:
stats count(idstype) as distinct | search distinct >= 3
This custom search would trigger an alert if it evaluated the results represented
by the table above, because 3 IDS types reported more than 20 attacks in the
10-minute timespan represented by the base search.
If you're setting this up as a real-time search, set Throttling to 10 minutes to
ensure that you don't get additional alerts until at least 10 minutes have passed
since the last one. If you're running this as a scheduled search you don't need to
set a throttling value since the search will only run on a 10 minute interval to
begin with.
207
Review triggered alerts
You can see records of your recently triggered alerts in the Alert Manager. The
Alert Manager displays records of triggered alerts that have Show triggered alerts
in Alert manager enabled as an alert action in the Actions step of the Create
alert dialog:
Alternatively, if you are creating or updating an alert in in Manager > Searches
and Reports, you can enable the Tracking alert action to have that alert's
triggered alert records appear in the Alert Manager:
Open the Alert Manager by clicking the Alerts link at the upper right-hand corner
of the Splunk UI. It opens in a separate window.
Note: The Alert Manager displays records for triggered alerts that are based on
existing saved searches. They will continue to appear even if you disable the
alerting aspect of those searches after the alerts were triggered. The Alert
Manager will not display records of triggered alerts that are based on deleted
208
saved searches, however.
For more information about alerts and alert definition, see"Create an alert" in this
manual.
Setting alert expiration
Triggered alert records are designed to expire (be automatically deleted from the
Alert Manager) after a set period of time. You define triggered alert record
expiration periods at the individual alert level.
For example, say you have a Firewall breach alert with an Expiration setting of 2
days. If the Firewall breach alert is triggered at 3pm, the related alert record will
be deleted from the Alert Manager at 3pm the two days later.
When an alert is first created it has a default expiration time of 24 hours. This
means that the triggered alert records for a new alert will disappear a day after it
appears in the Alert Manager unless you give it a different expiration period.
To change the default expiration period for an alert's triggered alert records, go to
the detail page for the base saved search in Manager > Searches and Reports
and set Expiration to your desired number of seconds, minutes, hours, or days
(or just select one of the pre-defined time ranges from the list).
Using the Alert Manager
You can filter the Alert Manager listing by app, alert severity, and alert type. You
can also search for specific keywords using the search box. The keyword search
applies to fired alert names (which are the same as the names of the searches or
reports upon which the alerts are based) and the alert severity (so you can
search specifically for alerts of Critical severity, if necessary).
Additionally, the Alert Manager enables you to manually delete individual alert
records.
209
Note that the Severity column enables you to quickly spot those alert records
that have been given a higher severity level (such as High or Critical). When you
define or update your alert definition, use the Severity field to set the alert
severity level. The severity label is for informational purposes only; there is no
additional functionality associated with it.
The Type column indicates whether the alert is running in Real-time or is
Scheduled to run on a regular interval. The Mode column indicates whether the
alert represents a set of events (Digest) or a single event (Per Result).
Click View results for a specific alert record to see the results captured by that
alert in another browser tab. This is a search job artifact; it won't contain any
events that weren't returned by the search job that originally triggered the alert.
Click Edit search for a specific alert record to edit the underlying search for the
alert. You can change the search string and/or redefine the alert definition.
Setting up Alert Manager tracking when upgrading from a
pre-4.2 Splunk version
If you're upgrading from a 4.1.x version of Splunk, be aware that by default
existing alerts do NOT show up in the Alert Manager. To quickly update your
existing alerts so that they show up in the Alert Manager, edit the relevant copy
of savedsearches.conf. Add alert.track = true to the stanzas of each saved
search that you have set up as an alert and want to see tracked in the Alert
Manager. Review "About configuration files" in the Admin Manual for details
about configuration files.
210
Analyze and Report
About reports, dashboards, and data visualizations
Using Splunk's powerful IT search capabilities to investigate issues and gather
important knowledge about your enterprise is only the first part of the overall
equation. Draw on Splunk's ability to swiftly analyze the information you uncover
through your searches and use it to create compelling visualizations in the form
of reports and charts.
This chapter contains a variety of topics around the creation of useful search
data visualizations with Splunk, as well as the methods you can use to ensure
that others see your creations (via dashboards, emailed PDFs, and more).
Using reporting commands
• See a primer on the use of reporting commands (commands that generate
data structures that form the basis of tables and charts).
• Learn how to design reports and charts that are updated in real time.
Understanding Splunk data visualizations
• Learn about the different kinds of visualizations (tables, charts, event
listings, and more) that you can create.
• Familiarize yourself with the data structure requirements for the different
visualization types, to better understand how to design searches for them.
• Get a better understanding of how chart and table drilldown works.
Building reports
• Discover how Splunk's report builder makes the definition, generation, and
formatting of sophisticated reports a snap.
• Learn how to save your reports and share them with others.
Creating and maintaining dashboards
• Learn how your enterprise can design dashboard views containing charts
that display data critical to your day-to-day business processes.
• Find out how to create and maintain dashboards with the Splunk Web UI.
• Learn how to change and format dashboard panel visualizations with the
Visualization Editor.
211
• Find out how to have PDF printouts of dashboards emailed to interested
parties on a regular schedule.
Use reporting commands
You can add reporting commands directly to a search string to help with the
production of reports and the summarizing of search results.
A reporting command primer
This subsection covers the major categories of reporting commands and
provides examples of how they can be used in a search.
The primary reporting commands are:
• chart: used to create charts that can display any series of data that you
want to plot. You can decide what field is tracked on the x-axis of the
chart.
• timechart: used to create "trend over time" reports, which means that
_time is always the x-axis.
• top: generates charts that display the most common values of a field.
• rare: creates charts that display the least common values of a field.
• stats, eventstats, and streamstats: generate reports that display
summary statistics
• associate, correlate, and diff: create reports that enable you to see
associations, correlations, and differences between fields in your data.
Note: As you'll see in the following examples, you always place your reporting
commands after your search commands, linking them with a pipe operator ("|").
chart, timechart, stats, eventstats,
and streamstats are all designed to work
in conjunction with statistical functions. The list of available statistical functions
includes:
• count, distinct count
• mean, median, mode
• min, max, range, percentiles
• standard deviation, variance
• sum
• first occurrence, last occurrence
212
To find more information about statistical functions and how they're used, see
"Functions for stats, chart, and timechart" in the Search Reference Manual.
Some statistical functions only work with the timechart command.
Note: All searches with reporting commands generate specific structures of data.
The different chart types available in Splunk require these data structures to be
set up in particular ways. For example not all searches that enable the
generation of bar, column, line, and area charts also enable the generation of pie
charts. Read the "Chart data structure requirements" subtopic of the "Chart
gallery" topic in this manual to learn more.
Creating time-based charts
Use the timechart reporting command to create useful charts that display
statistical trends over time, with time plotted on the x-axis of the chart. You can
optionally split data by another field, meaning that each distinct value of the "split
by" field is a separate series in the chart. Typically these reports are formatted as
line or area charts, but they can also be column charts.
For example, this report uses internal Splunk log data to visualize the average
indexing thruput (indexing kbps) of Splunk processes over time, broken out by
processor:
index=_internal "group=thruput" | timechart avg(instantaneous_eps) by
processor
Creating charts that are not (necessarily) time-based
Use the chart reporting command to create charts that can display any series of
data. Unlike the timechart command, charts created with the chart command
use an arbitrary field as the x-axis. You use the over keyword to determine what
field takes the x-axis.
Note: The over keyword is specific to the chart command. You won't use it with
timechart, for example, because the _time default field is already being used
as the x-axis.
For example, the following report uses web access data to show you the average
count of unique visitors over each weekday.
index=sampledata sourcetype=access* | chart avg(clientip) over
date_wday
You can optionally split data by another field, meaning that each distinct value of
the "split by" field is a separate series in the chart. If your search includes a "split
213
by" clause, place the over clause before the "split by" clause.
The following report generates a chart showing the sum of kilobytes processed
by each clientip within a given timeframe, split by host. The finished chart
shows the kb value taking the y-axis while clientip takes the x-axis. The delay
value is broken out by host. You might want to use the Report Builder to format
this report as a stacked bar chart.
index=sampledata sourcetype=access* | chart sum(kb) over clientip by
host
Another example: say you want to create a stacked bar chart that splits out the
http and https requests hitting your servers. To do this you would first create
ssl_type, a search-time field extraction that contains the inbound port number
or the incoming URL request, assuming that is logged. The finished search would
look like this:
sourcetype=whatever | chart count over ssl_type
Again, you can use the Report Builder to format the results as a stacked bar
chart.
Visualizing the highs and lows
Use the top and rare reporting commands to create charts that display the most
and least common values.
This set of commands generates a report that sorts through firewall information
to show you a list of the top 100 destination ports used by your system:
index=sampledata | top limit=100 dst_port
This string, on the other hand, utilizes the same set of firewall data to generate a
report that shows you the source ports with the lowest number of denials. If you
don't specify a limit, the default number of values displayed in a top or rare is
ten.
index=sampledata action=Deny | rare src_port
A more complex example of the top command
Say you're indexing an alert log from a monitoring system, and you have two
fields:
• msg is the message, such as CPU at 100%.
• mc_host is the host that generates the message, such as log01.
214
How do you get a report that displays the top msg and the values of mc_host that
sent them, so you get a table like this:
Messages by mc_host
CPU at 100%
log01
log02
log03
Log File Alert
host02
host56
host11
To do this, set up a search that finds the top message per mc_host (using limit=1
to only return one) and then sort by the message count in descending order:
source="mcevent.csv" | top limit=1 msg by mc_host | sort -count
Create reports that display summary statistics
Use the stats and eventstats reporting commands to generate reports that
display summary statistics related to a field.
To fully utilize the stats command, you need to include a "split by" clause. For
example, the following report won't provide much information:
sourcetype=access_combined | stats avg(kbps)
It gives you the average of kbps for all events with a sourcetype of
access_combined--a single value. The resulting column chart contains
only one
column.
But if you break out the report with a split by field, Splunk generates a report that
breaks down the statistics by that field. The following report generates a column
chart that sorts through the access_combined logs to get the average thruput
(kbps), broken out by host:
sourcetype=access_combined | stats avg(kbps) by host
Here's a slightly more sophisticated example of the stats command,
in a report
that shows you the CPU utilization of Splunk processes sorted in descending
order:
index=_internal "group=pipeline" | stats sum(cpu_seconds) by processor
| sort sum(cpu_seconds) desc
215
The eventstats command works in exactly the same manner as the stats
command, except that the aggregation results of the command are added inline
to each event, and only the aggregations that are pertinent to each event.
You specify the field name for the eventstats results by adding the as argument.
So the first example above could be restated with "avgkbps" being the name of
the new field that contains the results of the eventstats avg(kbps) operation:
sourcetype=access_combined | eventstats avg(kbps) as avgkbps by host
When you run this set of commands, Splunk adds a new avgkbps field to each
sourcetype=access_combined event that includes the kbps field. The value of
avgkbps is the average kbps for that event.
In addition, Splunk uses that set of commands to generate a chart displaying the
average kbps for all events with a sourcetype of access_combined, broken out by
host.
Look for associations, statistical correlations, and differences in search
results
Use the associate, correlate and diff commands to find associations, similarities
and differences among field values in your search results.
The associate reporting command identifies events that are associated with each
other through field/field value pairs. For example, if one event has a
referer_domain of "http://www.google.com/" and another event has a
referer_domain with the same URL value, then they are associated.
You can "tune" the results gained by the associate command with the supcnt,
supfreq, and improv arguments. For more information about these arguments
see the Associate page in the Search Reference.
For example, this report searches the access sourcetypes and identifies events
that share at least three field/field-value pair associations:
sourcetype=access* | associate supcnt=3
The correlate reporting command calculates the statistical correlation between
fields. It uses the cocur operation to calculate the percentage of times that two
fields exist in the same set of results.
The following report searches across all events where eventtype=goodaccess,
and calculates the co-occurrence correlation between all of those fields.
216
eventtype=goodaccess | correlate type=cocur
Use the diff reporting command to compare the differences between two search
results. By default it compares the raw text of the search results you select,
unless you use the attribute argument to focus on specific field attributes.
For example, this report looks at the 44th and 45th events returned in the search
and compares their ip address values:
eventtype=goodaccess | diff pos1=44 pos2=45 attribute=ip
Real-time reporting
You can use Splunk's real-time search to calculate metrics in real-time on large
incoming data flows without the use of summary indexing. However, because
you are reporting on a live and continuous stream of data, the timeline will update
as the events stream in and you can only view the table or chart in preview
mode. Also, some search commands will be more applicable (for example,
streamstats and rtorder) for use in real-time.
For a primer of reporting commands, see "Use reporting commands" in this
manual.
Real-time reporting is accessible through Splunk Web and the CLI. For more
information, read "About CLI searches" in the Search reference manual.
This feature is discussed in more detail and with examples in the User manual's
"Search and Investigate" chapter. Refer to the topic "Real-time search and
reporting".
Visualization reference
Splunk provides a number of options for search result visualization. Along with
the straightforward "event listing" visualization, you can see your event data
presented in the form of tables and charts (such as column, line, area, and pie
charts). And if you're working with a search that results in a single, discrete,
numerical value, you can visualize it with a variety of gauge and single value
displays.
In this topic, we provide examples of Splunk's visualization options. But we'll
begin by pointing out the different ways that you can access Splunk's
visualization functionality.
217
It's important to note that your visualization options can be limited if the
search you're using doesn't return data in a structure that they support. For
example, you need a reporting command (such as stats, timechart, or top) to
return search results in a data structure that supports both tables and chart
visualizations (like column, bar, line, area, and pie charts). For more information,
see "Data structure requirements for visualizations," in this manual.
For more information about building searches with reporting commands, see
"Use reporting commands" in this manual.
Accessing Splunk's visualization definition features
It's easy to access Splunk's visualization definition functionality through the
Splunk Web UI. You have four options; the option you choose depends on your
needs at that time and the use to which you'd like to put the visualization, if any.
You can:
• Change how Splunk displays search results in the timeline view of
the Search app. After you run a search in the Search app, you can
change how Splunk displays the results with the visualization icons that
appear at the top of the results section. You have three visualization types
to choose from: events list, table, and results chart (which includes chart
types such as column, line, and pie charts, as well as gauges and single
value visualizations).
Keep in mind that the table and chart options may be unavailable if the
search is not returning data in a structure that they support (see the note
about data structures, above).
• Base a dashboard panel visualization on the search. When you base a
new dashboard panel on a search, you'll choose the visualization that best
represents the data returned by the search--it can display as an event
listing, a table, a chart (such as a column, line, or pie chart), a gauge, or a
single value visualization. You'll then use the Visualization Editor to
fine-tune the way the panel visualization displays. After you run a search
that you'd like to base a dashboard panel upon, click Create and select
Dashboard panel... to access the Create Dashboard Panel dialog.
218
For more information about dashboard creation and editing, see the
"Create and edit simple dashboards" and "Edit dashboard panel
visualizations" topics in this Manual. Note: This method of visualization
design may give you more charting options than the others in this list.
• Use the Report Builder to design a visualization-friendly search and
package its results as a report. This option is especially useful if you are
unfamiliar with the reporting commands necessary to design a search
that returns table- and chart-friendly results. The Report Builder can guide
you through the process of creating this kind of search. After you run a
search that you'd like to base a report on, click Create and select Report...
to access the Report Builder.
For more information about building reports with the Report Builder, see
"Define reports," in this manual.
• Use the Advanced Charting view to design a visualization quickly.
Use it if you are confident in your ability to create searches with reporting
commands, know exactly what you want to report on, and just want to get
going quickly. Get to it by selecting Advanced Charting from the
Dashboards & Views menu.
For more information about this view, see "Use report-rich dashboards
and views," in this manual.
219
Events
Events visualizations are essentially raw lists of events.
You can get events visualizations from any search that does not include a
transform operation, such as a search that uses reporting commands like stats,
chart, timechart, top, or rare. For example, if you just search for a set of terms
and field values, you'll end up with a list of events:
error OR failed OR severe OR ( sourcetype=access_* ( 404 OR 500 OR 503
) )
But if you add a reporting command to that search, you instead get statistical
results that can be presented either as a table or a chart, but not an event list:
error OR failed OR severe OR ( sourcetype=access_* ( 404 OR 500 OR 503
) ) | stats count by host
The following events visualization lists indexing errors over all time. It is based on
this search:
index=_internal NOT( source=*searches.log ) (ERROR OR FATAL OR CRIT)
AND (STMgr OR HotDBManager OR databasePartitionPolicy OR MPool OR TPool
OR timeinvertedIndex OR StreamGroup OR IndexableValue )
You can find this dashboard panel in the "Index health" status dashboard; it is
delivered with Splunk.
With event listing visualizations, you can:
• determine the number of events listed.
• determine whether numbers appear to the left of each event.
• have event text wrap to fit within the page (or dashboard panel).
220
Tables
You can pick table visualizations from just about any search, but the most
interesting tables are generated by searches that include transform operations,
such as a search that uses reporting commands like stats, chart, timechart,
top, or rare.
Here's an example of a table that MyFlowerShop, a hypothetical flower company,
has designed to track price differences between its products and those of its
hypothetical competitor, Flowers R Us. The actual search used is:
sourcetype=access_* | stats values(product_name) as product by price,
flowersrus_price | eval difference = price - flowersrus_price | table
product, difference
Note that in this example table, the cells in the difference column are shaded.
This is because we have chosen a Data overlay of heat map for the table, which
means that the high values are shaded red, while the low values are shaded
blue. In this example, products that have a higher price at MyFlowerShop than
they do at their competitor are shaded red, while products that are cheaper at
MyFlowerShop are shaded blue.
For tables, you can:
• set the number of table rows that are displayed.
• optionally display row numbers.
• add data overlays that provide additional visual information, such as heat
maps or high/low value indicators.
If you are formatting tables in dashboards with the Visualization Editor you can
additionally determine how drilldown works for them. You can enable drilldown
by row or by cell, or disable drilldown for the table entirely. For more information
221
about drilldown functionality, see "Understand basic table and chart drilldown
actions", in this Manual.
Sparklines in tables
You can arrange to have your tables display sparkline visualizations. Sparklines
can increase the usefulness and overall information density of tables in reports
and dashboards; they show hidden patterns in your data that might otherwise be
hard to identify in your table results.
To use sparklines, your underlying search has to use the stats or chart
reporting command. You add the sparklines function of those commands to tell
Splunk to add a sparkline column to this table. For details on how this works, see
"Add Sparklines to your search results" in the User Manual.
The following sparkline example runs off of this search, which looks at USGS
earthquake data (in this case a CSV file that presents all magnitude 2.5+ quakes
recorded over a given 7-day period, worldwide):
source=eqs7day-M2.5.csv | stats sparkline(avg(Magnitude),6h) as
magnitude_trend, count, avg(Magnitude) by Region | sort count
The search displays the top 10 regions according to the total count of quakes
experienced per region over that period. The sparkline in the resulting table
illustrates the trend in earthquake magnitude over the course of that week for
each of the top earthquake regions:
This example also demonstrates how you can mouse over the sparkline to get a
read of the values at specific points along its length.
Charts
Splunk provides a variety of chart visualizations, such as column, line, area,
scatter, and pie charts. These visualizations require transforming searches
(searches that use reporting commands) whose results involve one or more
222
series.
A series is a sequence of related data points that can be plotted on a chart. For
example, each line plotted on a line chart represents an individual series. You
can design transforming searches that produce a single series, or you can set
them up so the results provide data for multiple series.
It may help to think of the tables that can be generated by transforming searches.
Every column in the table after the first one represents a different series. A
"single series" search would produce a table with only two columns, while a
"multiple series" search would produce a table with three or more columns.
All of the chart visualizations can handle single-series searches, though you'll
find that bar, column, line, and pie chart visualizations are usually best for such
searches. In fact, pie charts can only display data from single series searches.
On the other hand, if your search produces multiple series, you'll want to go with
a bar, column, line, area, or scatter chart visualization.
For a detailed discussion of the data structure requirements for the different kinds
of chart visualizations, see the topic "Data structure requirements for
visualizations," in this manual.
Column and bar charts
Use a column chart or bar chart to compare the frequency of values of fields in
your data. In a column chart, the x-axis values are typically field values (or time,
especially if your search uses the timechart reporting command) and the y-axis
can be any other field value, count of values, or statistical calculation of a field
value. Bar charts are exactly the same, except that the x-axis and y-axis values
are reversed. (See the "Visualization data structure requirements" topic, in this
manual, for more information.)
The following bar chart presents the results of this search, which uses internal
Splunk metrics. It finds the total sum of CPU_seconds by processor in the last 15
minutes, and then arranges the processors with the top ten sums in descending
order:
index=_internal "group=pipeline" | stats sum(cpu_seconds) as
totalCPUSeconds by processor | sort 10 totalCPUSeconds desc
223
Note that in this example, we've also demonstrated how you can roll over a
single bar or column to get detail information about it.
When you define the properties of your bar and column charts, you can:
• set the chart titles, as well as the titles of the x-axis and y-axis.
• set the minimum y-axis values for the y-axis (for example, if all the y-axis
values of your search are above 100 it may improve clarity to have the
chart start at 100).
• set the unit scale to Log (logarithmic) to improve clarity of charts where
you have a mix of very small and very large y-axis values. See "Edit
dashboard panel visualizations" for more information on this setting.
• determine whether charts are stacked, 100% stacked, and unstacked. Bar
and column charts are always unstacked by default. See the following
subsection for details on stacking bar and column charts.
If you are formatting bar or column charts in dashboards with the Visualization
Editor you can additionally:
• set the major unit for the y-axis (for example, you can arrange to have tick
marks appear in units of 10, or 20, or 45...whatever works best).
• determine the position of the chart legend and the manner in which the
legend labels are truncated.
• turn their drilldown functionality on or off. For more information about
drilldown, see "Understand basic table and chart drilldown actions", in this
Manual.
Stacked column and bar charts
When your base search involves more than one data series, you can use
stacked column charts and stacked bar charts to compare the frequency of field
values in your data.
224
In an unstacked column chart, the columns for different series are placed
alongside each other. This may be fine if your chart is relatively simple--total
counts of sales by month for two or three items in a store over the course of a
year, for example--but when the series count increases it can make for a
cluttered, confusing chart.
In a column chart set to a Stack mode of Stacked, all of the series columns for a
single datapoint (such as a specific month in the chart described in the preceding
paragraph) are stacked to become segments of a single column (one column per
month, to reference that example again). The total value of the column is the sum
of the segments.
Note: You use a stacked column or bar chart to highlight the relative weight
(importance) of the different types of data that make up a specific dataset.
The following chart illustrates the customer views of pages in the website of
MyFlowerShop, a hypothetical web-based flower store, broken out by product
category over a 7 day period:
Here's the search that built that stacked chart:
sourcetype=access_* method=GET | timechart count by categoryId | fields
_time BOUQUETS FLOWERS GIFTS SURPRISE TEDDY
Note the usage of the fields command; it ensures that the chart only displays
counts of events with a product category ID; events without one (categorized as
null by Splunk) are excluded.
The third Stack mode option, Stacked 100%, enables you to compare data
distributions within a column or bar by making it fit to 100% of the length or width
of the chart and then presenting its segments in terms of their proportion of the
225
total "100%" of the column or bar. Stacked 100% can help you to better see data
distributions between segments in a column or bar chart that contains a mix of
very small and very large stacks when Stack mode is just set to Stacked.
Line and area charts
Line and area charts are commonly used to show data trends over time, though
the x-axis can be set to any field value. If your chart includes more than one
series, each series will be represented by a differently colored line or area.
This chart is based on a simple search that reports on internal Splunk metrics:
index=_internal | timechart count by sourcetype
The shaded areas in area charts can help to emphasize quantities. The following
area chart is derived from this search, which also makes use of internal Splunk
metrics (you can find a version of this dashboard panel in the "Search activity
overview" dashobard which is delivered with Splunk):
index=_internal source=*metrics.log group=search_concurrency "system
total" NOT user=* | timechart max(active_hist_searches) as "Historical
Searches" max(active_realtime_searches) as "Real-time Searches"
When you define the properties of your line and area charts, you can:
• set the chart titles, as well as the titles of the x-axis and y-axis.
226
• determine what Splunk does with missing (null) y-axis values. You can
have the system leave gaps for null datapoints, connect to zero
datapoints, or just connect to the next positive datapoint.
• set the minimum y-axis values (for example, if all the y-axis values of your
search are above 100 it may improve clarity to have the chart start at 100).
• set the unit scale to Log (logarithmic) to improve clarity of charts where
you have a mix of very small and very large y-axis values. See "Edit
dashboard panel visualizations" for more information on this setting.
• determine whether charts are stacked, 100% stacked, and unstacked. Bar
and column charts are always unstacked by default. See the following
subsection for details on stacking bar and column charts.
If you are formatting line or area charts in dashboards with the Visualization
Editor you can additionally:
• set the major unit for the y-axis (for example, you can arrange to have tick
marks appear in units of 10, or 20, or 45...whatever works best).
• determine the position of the chart legend and the manner in which the
legend labels are truncated.
• turn their drilldown functionality on or off. For more information about
drilldown, see "Understand basic table and chart drilldown actions", in this
Manual.
Stacked line and area charts
Stacked line and area charts operate along the same principles of stacked
column and row charts (see above). Stacked line and area charts can help
readers when several series are involved; it makes it easier to see how each
data series relates to the entire set of data as a whole.
The following chart is another example of a chart that presents information from
internal Splunk metrics. The search used to create it is:
index=_internal per_sourcetype_thruput | timechart sum(kb) by series
useother=f
227
Pie chart
Use a pie chart to show the relationship of parts of your data to the entire set of
data as a whole. The size of a slice in a pie graph is determined by the size of a
value of part of your data as a percentage of the total of all values.
The following pie chart presents the views by referrer domain for a hypothetical
online store for the previous day. Note that you can get metrics for individual pie
chart wedges by mousing over them.
When you define the properties of pie charts you can set the chart title. If you are
formatting pie charts in dashboards with the Visualization Editor you can
additionally:
• determine the position of the chart legend.
• turn pie chart drilldown functionality on or off. For more information about
drilldown, see "Understand basic table and chart drilldown actions", in this
Manual.
Scatter chart
Use a scatter chart ( or "scatter plot") to show trends in the relationships between
discrete values of your data. Generally, a scatter plot shows discrete values that
do not occur at regular intervals or belong to a series. This is different from a line
graph, which usually plots a regular series of points.
Here's an example of a search that can be used to generate a scatter chart. It
looks at USGS earthquake data (in this case a CSV file that presents all
magnitude 2.5+ quakes recorded over a given 7-day period, worldwide), pulls out
just the Californian quakes, plots out the quakes by magnitude and quake depth,
and then color-codes them by region. As you can see the majority of quakes
228
recorded during this period were fairly shallow--10 or fewer meters in depth, with
the exception of one quake that was around 27 meters deep. None of the quakes
exceeded a magnitude of 4.0.
To generate the chart for this example, we've used the table command, followed
by three fields. The first field is what appears in the legend (Region). The second
field is the x-axis value (Magnitude), which leaves the third field (Depth) to be the
y-axis value. Note that when you use table the latter two fields must be numeric
in nature.
source=eqs7day-M2.5.csv Region=*California | table Region Magnitude
Depth | sort Region
For more information about the data structures that scatter charts require, see
the " Visualization data structure requirements" topic, in this manual.
When you define the properties of your scatter charts, you can:
• set the chart titles, as well as the titles of the x-axis and y-axis.
• set the minimum y-axis values for the y-axis (for example, if all the y-axis
values of your search are above 100 it may improve clarity to have the
chart start at 100).
• set the unit scale to Log (logarithmic) to improve clarity of charts where
you have a mix of very small and very large y-axis values. See "Edit
dashboard panel visualizations" for more information on this setting.
If you are formatting bar or column charts in dashboards with the Visualization
Editor you can additionally:
• set the major unit for the y-axis (for example, you can arrange to have tick
marks appear in units of 10, or 20, or 45...whatever works best).
• determine the position of the chart legend and the manner in which the
legend labels are truncated.
229
• turn their drilldown functionality on or off. For more information about
drilldown, see "Understand basic table and chart drilldown actions", in this
Manual.
Single-value visualizations
Single value displays and gauges are designed to interpret the results of a
transforming search that returns a single value whenever it is run, such as a
search that returns the total count of events fitting a specific set of search criteria
over a specific time range (or within a real-time window, in the case of real-time
searches).
For example, this search presents the total number of Splunkd errors over the
past hour:
index=_internal source="*splunkd.log" log_level="error" | stats count
as errors
There are numerous ways to make searches arrive at single values, such as
combining the top command with head=1.
For more information on the data structure requirements of single value
visualizations, see the "Chart gallery" topic in this manual.
Note: When you design dashboard visualizations, you'll see that you can select
single value visualizations even when you're working with a search that doesn't
return a single value. In the case of dashboards, when a single value
visualization is based on a transforming search that returns multiple values, it
works with the value in the first cell of the resulting table. It doesn't matter
whether the search involves a single series or multiple series. The other
visualization setup options (the Search app timeline view, the Report Builder, and
the Advanced Charting view) do not allow this when searches that return more
than one value are involved.
Single value dashboard display
The single value display is available for dashboards only. When you base it on a
search that returns a single numerical value, it displays the current result for that
search. If you base the visualization on a real-time search that returns a single
value, the number displayed changes as the search interprets incoming data.
230
You can arrange to have a single value display visualization change color
depending on where the value it's displaying fits within a defined range, but to do
so you'll have to include a special search command in the a underlying search
and work with the XML underneath the panel just a bit. To activate this
functionality, follow these steps:
1. Design a search that returns a single value and which uses the rangemap
command to define the range. By default, Splunk associates the color green with
word low, the color yellow with elevated, and red with severe. The example
single value display panel above is based on this search:
index=_internal source="*splunkd.log" log_level="error" | stats count
as errors | rangemap field=errors low=1-3 elevated=4-15 default=severe
2. Create the panel for the dashboard, selecting Single value as the visualization
type. For more information about creating dashboards and panels, see "Create
and edit simple dashboards," in this manual.
3. Set Edit: to On to put the dashboard in editing mode. Click Edit XML to see
the view XML for the dashboard in the XML editor.
4. Locate the module XML for the single value display panel that you want to edit.
You can locate it by looking for the <searchstring> and <label> lines that have
the search and title of the panel in question. Once you find it, add this below the
<title> line:
<option name="classField">range</option>
5. Click save to return to the normal dashboard view. Your single value panel
should now display either green, yellow, or red, depending on the number
presented and the range you've defined for it.
For more information about working with the XML code behind single value
display dashboard panels, see "Add a single value" in the Developer Manual.
Single value dashboard display formatting options
When you define a single value dashboard display with the Visualization Editor,
you can:
• Provide a panel title.
• Set up text that goes before and after the displayed number. For example:
231
Gauges
Splunk provides three types of gauge visualizations: radial, filler, and marker.
Gauge visualizations map a single numerical value against a range of colors that
may have particular business meaning or logic. As the value changes over time,
the gauge marker changes position within this range. Gauges are designed to
provide an especially dynamic visualization for real-time searches, where the
value returned fluctuates as events are returned, causing the gauge marker to
visibly bounce back and forth within the range as you watch it.
The various gauge examples below have the same base search. It is:
index=_internal source="*splunkd.log" log_level="error" | stats count
as errors
Radial gauge
The radial gauge type looks essentially like a speedometer or pressure valve
gauge. It has an arced range scale and a rotating needle. The current value of
the needle is displayed at the bottom of the gauge (in the case of the example
below, the value is 915). If the value falls below or above the specified minimum
or maximum range, the needle "flutters" at the upper (or lower) boundary, as if it
is straining to move past the limits of the range.
Here's an example of the "shiny" version of the radial gauge:
And here's what the "minimal" version of the radial gauge looks like:
232
Filler gauge
The filler gauge is similar in appearance to a thermometer, with a liquid-like filler
indicator that changes color as it rises and passes gauge range boundaries. So
imagine you have set up three ranges. The lower colored green , yellow, and red,
the liquid will appear to be green when it is near the bottom, yellow when it
reaches the midpoint boundary, and red when it gets to the top. The current
value of the gauge fill is displayed at the left side of the filler indicator.
The filler gauge is oriented vertically by default but can be oriented horizontally
through custom charting configuration.
Marker gauge
The marker gauge is a linear version of the filler gauge. It is already "filled"; a
gauge marker rests at the value returned by the search. If the gauge is displaying
the results of a real-time search, the marker can appear to slide back and forth
across the range as the returned value fluctuates over time. If the returned value
falls outside of the upper or lower ranges of the marker gauge, the marker
appears to vibrate at the upper (or lower boundary), as if it is straining to move
past the limits of the range.
233
The marker gauge is oriented vertically by default but can be oriented
horizontally through custom charting configuration.
Marker gauges have display issues with numbers exceeding 3 digits in length. To
manage this, you can set up a search that divides a large number by a factor that
reduces it to a smaller number. For example, if the value returned is typically in
the tens of thousands, set your search up so the result is divided by 1000. Then
a result of 19,100 becomes 19.1.
You can also deal with large numbers by setting the chart configuration options
so the range is expressed as a percentage. For more about that, see the next
subsection.
Formatting gauge visualizations via Splunk Web
All of Splunk's UI-based visualization definition options enable you to define how
your gauges appear. You have the most formatting options when you use the
dashboard Visualization Editor to set up a gauge in a dashboard panel. The
Visualization Editor enables you to:
• Provide a title for the panel.
• Define the size and number of the ranges that make up the overall gauge.
For example, you could have a gauge that starts at 0, ends at 100, and is
made up of four ranges that span 0-25, 26-50, 51-75, and 76-100. Or you
could have a gauge that starts at 1000, ends at 3000, and is made up of
several smaller ranges.
• Set the colors for each range. By default the first three ranges are green,
yellow, and red, but you can change them to whatever you want, and add
or subtract ranges as you see fit.
• Determine whether the gauge style is shiny or minimal. For example, the
shiny version of the radial gauge is designed to look something like a real
radial machine gauge, with a metallic-looking dial and black background.
The minimal radial gauge, on the other hand, is a stripped-down, "flat"
version of the radial gauge design.
234
Note: When you are formatting gauge visualizations through the Visualization
Editor, you can have it define color ranges automatically (by using values defined
in the search string in conjunction with the gauge command--see below) or
manually (by using settings defined in the Visualization Editor).
For more information about using the Visualization Editor to format dashboard
panel visualizations, see the topic "Edit dashboard panel visualizations," in this
Manual.
Splunk's other visualization definition options--the Report Builder, the Advanced
Charting view, and the results area of the Search App only provide the ability to
give titles to gauge visualizations. By default they'll create a gauge with three
ranges: 1-30, 31-70, and 71-100. These ranges are colored green, yellow, and
red, respectively. To set up different gauge ranges with these visualization
definition options, you'll need to update the underlying search with the gauge
search command, as defined in the following subtopic.
Setting gauge ranges with the gauge command
When you're using a visualization definition option other than the dashboard
Visualization Editor, you'll need to use the gauge command to set custom ranges
for a gauge visualization.
The gauge command only enables you to set the gauge ranges; Splunk assigns
colors to each range automatically. With gauge, you indicate the field whose
value will be tracked by the gauge. Then you add "range values" to the search
string that indicate the beginning and end of the range as well as the relative
sizes of the color bands within it.
For example, to set up a gauge that tracks a hitcount field value with the ranges
100-119, 120-139, 140-159, 160-179, and 180-200 you would add this to your
search string:
...| gauge hitcount 100 120 140 160 180 200
Splunk chooses default colors for these ranges (the first three are always green,
yellow, and red).
Note: If you do not include the gauge command in your search (or do use it but
fail to include range values along with it), Splunk inserts default range values of 0
30 70 100 when it generates the gauge visualization.
235
Additional visualization options
Splunk offers visualization options that are unavailable via Splunk Web tools like
the Report Builder and the Visualization Editor for dashboard panels. You can set
these additional visualization options up in dashboard panels using Splunk's view
XML and the custom charting configuration controls.
These additional visualization options include:
• Bubble charts
• Histograms
• Range marker charts
• Ratio bar charts
• Value marker charts
You can use bubble charts to show trends and the relative importance of discrete
values in your data. The size of a bubble indicates a value's relative importance.
It represents a third dimension on top of the x-axis and y-axis values that plot the
bubble's position on the chart. This dimension determines the bubble's size
relative to the others in the chart.
Range marker charts and value marker charts are designed to work as overlays
on top of bar, column, line, or area charts.
For more information about these chart types, the data structures required to
support them, and their view XML properties, see the Custom charting
configuration reference chapter in the Developer Manual.
Data structure requirements for visualizations
In this topic we cover the data structure requirements of the different types of
visualizations offered for our reports and dashboards. If you're trying to generate
a visualization, and are wondering why certain visualizations are unavailable, this
is the topic for you.
236
If you're getting the above error when you change the underlying search for an
existing dashboard panel, or if you're creating a new panel and are finding that
the visualization you want is unavailable, it's likely because the underlying search
doesn't return data that will work for that visualization. In most cases, it's easy to
tweak the search to get the visualization you want.
For example, most charting visualizations (column charts, line charts, area
charts, bar charts, and so on) require search results that are structured as tables
with at least two columns, where the first column provides x-axis values, and the
subsequent columns provide y-axis values for each series represented in the
chart (pie charts only provide information for single-series reports, while the other
chart types can represent multiple series). To get these tables you need to set up
the underlying search with reporting search commands like stats, chart, or
timechart.
For a high-level overview of Splunk's visualization options, see the "Visualization
reference," in this manual.
• For more information about building searches with reporting commands,
see "Use reporting commands."
• For more information about building reports with the Report Builder, see
""Define reports and generate charts" in this manual.
• For more information about using the Visualization Editor to design
visualizations for dashboard panels, see "Define and edit dashboard
panels."
Column, line, and area charts
It's important to understand that column, line, and area charts are
two-dimensional charts supporting one or more series. They plot data on a
Cartesian coordinate system, working off of tables that have at least two
columns, where the first column contains x-axis values and the subsequent
columns contain y-axis values (each column represents a series). This is why
"Values over time" searches and searches that include splitbys are among those
that are available as column, line, and area charts.
If you want to generate a column, line, or area chart from a search, that search
must produce a table matching the description provided in the preceding
paragraph. For example, any search using the timechart reporting command will
generate a table where _time is the first column (and therefore the x-axis of any
column, line, or area chart generated from those results). You'll get the same
result with most basic searches involving reporting commands.
237
For example, a search like this, where the over operator indicates that source is
the x-axis:
...| chart avg(bytes) over source
produces a two-column, single-series table like this:
In this table, the x-axis is source, and the y-axis is avg(bytes). With it you can
produce a column chart that compares the average number of bytes passed
through each source.
Say you change up the search a bit by adding clientip as a splitby field:
...| chart avg(bytes) over source by clientip
This produces a table that features multiple series:
In this table, the x-axis is still source, and the y-axis is still avg(bytes), but it now
breaks out the avg(bytes) by clientip, creating a table with multiple series. You
might generate a stacked column chart to represent this data.
You run into trouble when you design a complex search that returns a result table
that lacks a valid x-axis or y-axis value. This can happen when you use the eval
and fields commands to force a particular arrangement of columns in the
finished table, for example.
Bar charts
Bar charts have the same data structure requirements as column, line, and area
charts, except that the x- and y-axes are reversed. So they are working off of
238
tables that have at least two columns, where the first column contains y-axis
values and the subsequent columns contain x-axis values.
Pie charts
Pie charts are one dimensional and only support a single series. They work off of
tables with just two columns, where the first column contains the labels for each
slice of the pie, and the second column contains numerical values that
correspond to each label, determining the relative size of each slice. If the table
generated by the search contains additional columns, those extra columns have
no meaning in the terms of the pie chart and are ignored.
Of the two "column, line, and area charts" search examples noted above, the first
is the only one that could be used to make a pie chart. The source column would
provide the wedge labels, and the avg(bytes) column would provide the relative
sizes of the wedges (as percentages of the sum of avg(bytes) returned by the
search).
Scatter charts
Scatter charts are cartesian charts that render data as scattered markers. They
help you visualize situations where you may have multiple y-axis values for each
x-axis value, even when you're not charting multiple series. Their data set can be
in one of two forms:
• A single series setup, where the chart is structured on a 2-column data
table, where the first column (column 0) contains the values to be plotted
on the x-axis, and the second column (column 1) contains the values to be
plotted on the y-axis.
• A multiple series setup, where the chart is structured on a data table that
contains 3 columns. The first column (column 0) contains the series
names, and the next two columns contain the values to be plotted on the
x- and y-axes, respectively.
To generate a scatter chart you need to graph events directly with a search like:
* | fields - _* | fields clientip bytes
This search finds all of the packets received from various client IP addresses and
then orders them according to the number of bytes in each packet.
• Note that the search removes all fields with a leading underscore, such as
the _time field.
239
• The second fields command isolates the two fields that you want for the
x- and y-axis of the chart, respectively. The y-axis value should be
numerical for best results. (So in this case, the x-axis is clientip while the
y-axis is bytes.)
Note: To create a scatter plot chart with a search like this, you need to enter the
reporting commands directly into the Report Builder by clicking Define report
data using search language in the Report Builder. You can run this report from
the search bar, but when you open up Report Builder, it adds a timechart
command that you should remove before formatting the report.
More complex scatter charts can be set up in dashboards using Splunk's view
XML. For more information see the Custom charting configuration reference
chapter in the Developer manual.
Gauges and single value visualizations
Gauges and single value visualizations are designed to represent searches that
return a single numerical field value. Gauges show where this value exists within
a defined range, while single value visualizations just display the number.
A simple example is a search that returns a count of the number of events
matching a set of search criteria that come in within a specific time period, or a
real-time window, if you are using a real-time search. If you base a gauge on a
real-time search, the chart's range marker will appear to fluctuate as the value
displayed within the real-time search window changes over time.
If you base a single value visualization on this same search, you'll see the value
increase and decrease as the value returned by the real-time search changes
over time. If you've used the rangemap command in conjunction with the search,
the single value visualization will change color depending on the value returned.
Understand basic table and chart drilldown actions
Splunk's table and chart 'drilldown actions enable you to delve deeper into the
details of the information presented to you in tables and charts. With a simple
click on a table row or a bar in a bar chart, you can kick off searches that drill
down to provide more information about those discrete selections.
This topic provides some examples of this functionality as configured with simple
XML via the visual dashboard designer. It also briefly goes over some of the
240
drilldown functionality that can be configured through the advanced XML.
When you click on drilldown-enabled tables or charts, Splunk opens a separate
window for the search.
Note: Drilldown functionality does not work for simple XML dashboard panels
that are based on searches of summary indexes. To set up drilldown for
dashboards utilizing these types of searches, you need to perform "custom
wiring" with the advanced XML. For more information, see "Advanced drilldown
behavior" in this topic.
For a general overview of Splunk visualization options, see "Visualization
Reference," in this manual.
Overview of drilldown functionality for table and chart
visualizations
Drilldown functionality enables you to click on the table or chart to set off a
search that drills down for more detail on that table or chart. For example, say
you have a panel based on this simple search, which runs over the past 24
hours:
sourcetype=apache 404 | top referrers
From this search, you can get the following table visualization:
referrer
http://prettypwnny.com
count
243
http://deepthaduke.com 65
If this table is set up for row drilldown, when you click on the first row of the
panel, Splunk will move to the Search view and run the following search:
search sourcetype=apache 404 referrer="http://prettypwnny.com"
...which provides detail information on the 404 error events associated with the
PrettyPwnny referrer over the specified search duration.
Setting drilldown options for tables and charts in dashboard panels
Splunk's four search result visualization options produce tables and charts that
have drilldown functionality enabled by default. But the Visualization Editor for
dashboard panel visualizations gives you the ability to determine the granularity
of the functionality for tables, and enables you to turn the functionality on or off
for both tables and charts.
241
For more information about using the Visualization Editor, see "Edit dashboard
panel visualizations," in this manual.
Table visualizations in dashboard panels have three drilldown options in the
Visualization Editor. They are:
• Row, which means that a click on a row sets off a search across the x-axis
value represented by that row. For example, if the row represents a
specific period of time, then a click on that row sets off a search that is
identical to the search that generated the chart, except that it only covers
the time range that the row represents.
• Cell, which sets off a search that is restricted to the x-axis value (the row)
and the y-axis value (the column) represented by the cell, when the
originating search includes a "split by" clause.
• Off, which turns off the drilldown functionality for the table.
For example, you could use a cell-click in a table resulting from a "timechart
count by clientip" search, where the columns are values of clientip, like
192.168.0.14. The timeline for the resulting search shows when those events
occurred during that period.
Note: Tables produced by the Report Builder, Advanced Charting view, and the
the Search app timeline view have cell-level drilldown functionality by default.
Tables produced for dashboard panels have row-level drilldown functionality by
defualt.
Dashboard chart visualizations such as bar, column, line, area, and pie charts
have two drilldown options in the Visualization Editor. They are:
• Yes, which enables drilldown functionality for the visualization. This lets
you drill down on a particular part of a chart or legend by clicking on it. For
example, when you click on a particular column of a column chart
generated by a timechart command, Splunk runs a search (based on the
original search used to generate the bar chart) that covers only the block
of time represented by that column.
• No, which turns off the drilldown functionality for the visualization.
For more information about how table and data series visualization drilldown
actions actually work, see the following subtopics.
You can specify much more complex drilldown actions when you design them
using advanced XML. For more information about designing drilldown actions for
dashboards and views see the Developer manual.
242
Basic table drilldown functionality
As we explain above, you have three basic drilldown options when you define
chart visualization types with the Visualization Editor:
• None - Drilldown functionality is turned off.
• Row - A click on a row launches a drilldown search on the x-axis value
(the value in the first column of the table) for that row.
• Cell - A click on a cell launches a drilldown search on both the x-axis and
y-axis values represented in that cell.
In general, when the search involved in the creation of the original table uses
transforming commands, the drilldown wipes out the final transforming
command and replaces it with arguments that drill down on the specific x-axis
value or x- and y-axis value combination caught by the click. See the subsections
below for examples of how this works.
Row drilldown
When a table in a dashboard panel has a Drilldown value of Row, you can
initiate drilldown searches along whole rows by clicking on them.
Imagine that you have a dashboard table that is based on this search:
index="_internal" group="per_sourcetype_thruput" | chart sum(kbps) over
series
In this table, a "row click" drilldown search would concentrate on the x-axis value
of the selected row, which in this case would be a value of the series field, such
as fs_notification:
243
This click sets off the following search in the Search app, which finds six results:
index="_internal" group="per_sourcetype_thruput"
series="fs_notification"
Note that the drilldown search is basically the same as the original search,
except that the transforming command has been removed and replaced with a
drilldown search term of series="fs_notification".
Cell drilldown
When a table has a Drilldown value of Cell, you can initiate drilldown searches
for specific cells by clicking on them.
Say you have a table generated by the following search:
index="_internal" source="*metrics.log" group="per_sourcetype_thruput"
| timechart sum(kb) by series
In this table, a "cell click" drilldown search would concentrate on a combination of
the x-axis value (the value in the first column for the cell's row) and the y-axis
value (the value of the cell's column).
In this example, the clicked on cell initiates the following drilldown search over
the 4:40:00pm to 4:40:59pm time range on 12/15/09 (the x-axis value) and adds
a focus on the audittrtail value of the series field (the y-axis value):
index="_internal" source="*metrics.log" group="per_sourcetype_thruput"
series="audittrail"
Note that this drilldown search removes the last transforming command from
the originating search.
244
Note: The y-axis value will not come into play in all cell drilldown searches.
Cell-click interactions are designed to work with tables and charts generated by
searches containing a "split by" clause. Cell clicks in charts based on reporting
commands like timechart max(eps) min(eps) avg(eps) will always behave like
row clicks. Such tables should always be configured for row-click drilldown; this
approach is less confusing for users of the table.
Basic chart drilldown functionality
As we explain in "Create simple dashboards with the visual dashboard editor,"
you have two basic drilldown options when you define chart panel types with the
visual dashboard editor:
• Off - Drilldown functionality is turned off.
• On - A click on a portion of a chart launches a drilldown search into the
values that that portion of the chart represents.
In general, when the search involved in the creation of the original table uses
transforming commands, the drilldown wipes out the final transforming
command and replaces it with arguments that drill down on the specific x-axis
value or x- and y-axis value combination caught by the click. See the subsections
below for examples of how this works.
Bar, column, line, and area chart drilldown
Drilldown searches on dashboard bar, column, line, and area charts behave
differently depending on whether you click in the body of the chart or in the chart
legend, if a legend is displayed.
In general, no matter what you click in the body of a row, column, line, or area
chart, Splunk creates a drilldown search that:
• duplicates the search that originated the chart, except with the final
transforming commands removed.
• adds a new search term based on the "x-axis" value that you select in the
chart.
• possibly adds a "y-axis" value, depending on whether a meaningful y-axis
value exists in the originating search. For example, most split-by values
work as "y-axis" values. But things like avg(eps) will not.
Say you have a bar chart based on the following search:
245
index="_internal" source="*metrics.log" group="pipeline" | chart
sum(cpu_seconds) over processor | sort 10 - sum(cpu_seconds)
In this chart, the x-axis is the processor value, while the y-axis is the cpu_seconds
sum over the given time range (the last 60 minutes).
If you click in the body of this chart, the drilldown search drills down on the x-axis
value represented by that bar:
index="_internal" source="*metrics.log" group="pipeline"
processor="indexer"
Note that the drilldown search is identical to the original search except that the
final set of transforming commands has been removed and a focus has been
added on the aggregator value of processor.
Drilldown searches on legend items are different. Drilldown searches for
chart legends only work when there is a split-by (or y-axis) field in the chart. For
example, legend items for a line chart based on timechart avg(eps) by series
are values of series, such as audittrail. A click on the audittrail item results
in a drilldown search in which series=audittrail is added to the originating
search. Legend item drilldown searches always run over the same time range as
the originating search.
Note: Sometimes the legend element is something that can't really be drilled
down into, like avg(eps). Clicks on such legend items return an error message.
246
Pie chart drilldown
Pie charts provide identical drilldown behavior whether you click in the body of
the chart--a pie slice, in other words--or the label pointing to that slice. Either
way, the drilldown focuses on the value represented by the slice or label you click
on.
So if the pie chart displays the top processors being utilized over the past 24
hours, and you click on the chart portion or legend item representing the indexer
processor, then the drilldown search will be the same as the original, only with
the transforming command removed and processor=indexer added. You'll get
the same result if you click on the indexer label.
Advanced drilldown behavior
The default table and chart drilldown functionality that you can get out of
dashboards created with simple XML is just the start. When you create
dashboards using advanced XML, you have a range of table/chart drilldown
customization options that can greatly enhance your users' dashboard
experience.
For example, you can set up dashboards that:
• Open the search in a view other than the default "flash timeline" search
view.
• Have a drilldown click open up a new table or chart beneath the initial
panel. Click on a table cell, and see a line chart open up underneath that
table that displays the drilldown results.
• Include a nested series of drilldown searches. A click in a bar chart opens
a table. A click in that table opens a line chart. And click in that line chart
opens a search in a separate window.
• Launch a different search than the search that generates the data in the
table or chart. For example, if you've built many charts and tables on
searches of a particular summary index, you might want to send your
users to a search that isn't based on that summary index.
For more information about setting up advanced drilldown actions like the ones
described above, see "How to customize drilldown options" in the Developer
manual.
247
Define reports
The Splunk Report Builder makes it easy to generate sophisticated reports using
the results from any completed or finalized search. It offers a wide range of
reporting options, both in terms of reporting parameters and chart types.
With the Report Builder, you don't need to have an advanced understanding of
reporting commands like stats, top, chart, and timechart in order to build
robust, information-rich reports. However, you can still use these commands in
your search if you're more comfortable with them.
For examples of how reporting commands are used, see "Use reporting
commands" in this manual.
The Report Builder is broken up into two stages: Define report content and
Format report. Use the Define report content page to set up your initial report
parameters, such as the type of report and the fields that you're reporting on.
Once you've defined these initial details, you can go to the Format report page,
where Splunk generates the chart and corresponding table. On this page you can
fine-tune the chart formatting, review the related table, and save, print, and
export the results.
Launching the Report Builder
You can launch the report builder at any time after you've run a search in the
timeline view.
Note: You can start building your report before the search completes. Splunk
dynamically updates generated charts as it gathers search results.
To launch the report builder, you can:
• Click the green Create button below the timeline and choose Report.
248
• Click a field in the search results sidebar to bring up the interactive menu
for that field. Depending on the type of field you've clicked, you'll see links
to charts in the interactive menu such as Average over time, Maximum
value over time, and Minimum value over time (if you've selected a
numerical field) or top values by time and top values overall (if you've
selected a non-numerical field). Click on one of these links, and Splunk
opens the Format report page of the Report Builder, where it generates
the chart described by the link.
You don't need to have a strong understanding of reporting commands to use the
Report Builder, but if you do have this knowledge the range of things you can do
with the Report Builder is increased.
To return to your search results page from the Report Builder, click the Back
button in your browser.
Note: Keep in mind that report jobs are only preserved in the system for a set
period of time. If you do not save them, they eventually expire, and you cannot
generate reports for expired report jobs. For more information about job
249
management, see "Supervise your search jobs" in this manual.
If you want to save a report job, click the green Save button at the top right of the
Format report page of the Report Builder and choose Save results.
Define report content
The Define report content page gives you the freedom to define your report
parameters in the manner that feels most comfortable to you. If you're familiar
with reporting commands and want to define your report contents using
sophisticated search language, you can do that.
But you should use the default form-based mode for report content definition if
you:
• are not that familiar with reporting commands.
• want to set up a report quickly and efficiently using drop-down lists and
don't necessarily know what fields you can report on.
Both modes of the Define report content page display a search bar with your
search loaded into it, and a time range picker list that lets you change the report
time range.
Note: If you use the time range picker to change the time range for your report,
take care to choose a range of time that includes the fields on which you plan to
report.
Set up report contents using the form-based mode
The default form-based design of the Define report content page helps you
quickly set up your reporting parameters through a set of list fields. In this mode,
you cannot manually update the language in the search bar, but as you use the
form to set up your reporting parameters you'll see that the search bar
automatically updates with equivalent reporting commands.
There are three basic report types to choose from:
• Values over time for reports that display trends in field values over a
selected time range. These reports use the timechart reporting command.
They can display as a bar, column, line, or area chart.
• Top values for reports that display the most common field values to turn
up in a search. These reports use the top command, and can display as a
bar, column, or pie chart.
250
• Rare values for reports that display the most uncommon field values to
turn up in a search. These reports use the rare command, and can
display as a bar, column, or pie chart.
Note: The grayed-out Distribution of values and Original values report types
are coming in a future Splunk release. They'll handle reports that you can
currently build with the Report Builder if you define your report directly using
reporting commands, such as chart.
If you choose Values over time you can define reports that involve multiple field
series or split-by fields. These report types also let you define the time span for
each bin.
After you define your Report type you can select the fields that you want to
report on. If you've chosen a Values over time report type you'll also associate a
statistical function (such as count, direct count, average, mode, median, and so
on) with your primary field. (For more information about statistical functions and
how they're used, see "Functions for stats, chart, and timechart" in the Search
Reference Manual.
Once you have your initial report parameters set up, click Next Step: Format
Report. Splunk takes you to the Format report page of the Report Builder,
where it generates a version of the report using default formatting parameters.
Note: At any point during your use of the form interface you can switch over to
the search language mode, to refine the reporting commands that have been
appearing there. For example, say you set a Report Type of Top Values with a
Fields value of Host. As you select these values, this search appears in the
search bar:
... | top host limit=1000
Splunk's default limit for a top report built through the Report Builder is 1000,
which means that Splunk captures the top thousand items found in the search in
the resulting table and report. If you're dealing with a search that is bringing back
a large number of results, you can change this default by going into search
language mode (see below) and manually changing the limit to a value that
better fits your needs (such as limit=20).
Set up report contents using search language
If you're on the Define report content page of the Report Builder and you want
to manually define the reporting language for your report, use the search
language mode for that page. Click Define report using search language to
251
enter this mode.
When you are in the search language mode, you can enter reporting commands
directly into the search bar, with the freedom to make them as simple or
sophisticated as your situation requires.
For examples of how reporting commands are used, see "Use reporting
commands" in this manual.
Note: If you include reporting commands in your initial search, the Show report
button that appears takes you straight to the Format report page of the Report
Builder, bypassing the Define report content page entirely.
As in the form-based mode, after you have your initial report parameters set up,
click Next Step: Format Report. Splunk takes you to the Format report page of
the Report Builder, where it generates a version of the report using default
formatting parameters.
Format reports
The Format report page enables you to fine-tune the default formatting of your
report. The report is broken up into two major sections:
• the Chart section, which displays your report results as a chart.
• the Table section, which displays your report results as a table.
When Splunk opens the Format report page, it generates a chart using default
reporting parameters that are associated with the report type, as well as the
statistical operators involved in the search. For example, if on the Define report
content page you chose a Report type of Trend over time and use a count or
distinct count statistical operator, Splunk renders it as a column chart by default
(if you use a different statistical operator, such as average, Splunk renders a line
chart instead).
Note: If you have a search that includes reporting commands and you want the
chart that is generated from that search to include custom formatting (such as a
pie chart in place of the default bar chart) be sure to save it as a report from the
Report Builder once you have it formatted to your liking. Saved searches do not
include chart formatting parameters--to get those you need a saved report. This
is especially important if you are planning to base a dashboard panel on the
saved report, and you expect that panel to display with your custom formatting
parameters.
252
At the top of the Chart section you'll find the Formatting options subsection,
which contains the formatting options for your chart.
In this section, you can redefine the chart type (change it from a column chart to
a bar chart, for example) and select a variety of other formatting options. Under
Format, toggle between General, Y-axis, and X-axis sets of formatting controls.
After you make changes, click the Apply button to have Splunk regenerate your
chart with your formatting changes applied to the design.
Note: When you try to fine-tune the formatting for a report after the report job that
it's based upon expires, Splunk draws an empty chart. You will not have this
problem if you are building a report based on a saved report job. For more
information about saving search and report jobs see Manage your search jobs in
this manual.
Choose a chart type
Use the Chart Type drop-down list to change how Splunk visualizes your report
data. The list includes the following chart types:
• column
• bar
• line
• area
• pie
• scatter
• radial gauge
• filler gauge
• marker gauge
The Chart Type options that are actually available to you at any given time
depend on the type of report that you've created. For example, if you've set up a
Values over time report type on the Define report content page, then the only
Chart Type values that are available to you are bar,, column, line, and area.
For more details about the types of charts that you can create with the Splunk
Report Builder, see the "Visualization reference" topic in this manual. It includes
visual examples of each chart type and information about the kinds of situations
that each chart type is best suited for. It also tells about the commands and
Report Builder steps that get you to each chart type.
For more information about why certain chart types work for some searches but
not others (why you can't always use the same search to generate both a bar
253
and a pie chart, for example), see the "Data structure requirements for
visualizations" topic, in this manual.
Update general chart formatting options
The General chart formatting options available to you differ depending upon the
type of chart you've selected. If you're working with a column, bar, line, or area
chart, you can update the Stack mode. If you're working with a line or area chart,
you can additionally adjust the way the chart displays Null values.
You can update the Chart title and Legend placement no matter what chart
type you're working with.
Update X-axis and Y-axis formatting options
With the X-axis and Y-axis formatting option you can:
• Redefine the X- and Y-axis titles for the chart.
• Change the maximum and minimum values of the Y-axis for column, line,
and area charts.
• Change the maximum and minimum values of the X-axis for bar charts.
• Turn display markers on and off for line and area charts.
• Switch the Y-axis scale from linear to log (as in "logarithmic") for column,
line, area, scatter, and bubble charts (and do the same for the X-axis
scale of bar charts).
You might decide you want to adjust the maximum and minimum values of the
Y-axis (or X-axis, for bar charts) to focus on the differences between an
otherwise fairly similar group of results.
For example, say you're looking at a column chart where all of the Y-axis values
are between 114 and 145. You can set the minimum Y-axis value to 110, and the
maximum Y-axis value to 150. This creates a chart that focuses the viewer's
attention on the differences between each column while leaving out the
nonessential similarities.
Similarly, putting the chart on a logarithmic scale can be handy for situations
where values have wide variances. For example, you might have a column chart
where most of the values come between 10 and 50, but a handful are as high as
1000. You can use the logarithmic scale to better see the differences between
the lower values.
254
Save reports and share them with others
If you're happy with a report that you've created, in the Report Builder, you have
multiple options for saving that report and sharing it with others.
Save reports or report results
You have three choices when you click the green Save button in the Format
reports page of the Report Builder. You can:
• save the report search string, time range, and associated formatting
parameters, so that you can run new reports based on those settings.
• save the search results as a report job, so you can review the results of
this specific run of the report at a later time.
• save the report results as a report job and create a URL to share, so that
other Splunk users can see the results.
Create a saved report
From the Format report page of the Report Builder, click Save and then select
Save report... to open the Save Report dialog. Save Report enables you to save
the report search string and associated content and formatting parameters with a
unique name. You can also change the time range for the report if necessary.
After you save the report, it will appear under Searches & Reports in the
top-level navigation bar, using the unique name that you assigned to it.
Note: To make it easier to find your report in the Searches & Reports list, you
might include the word "report" or "chart" in its title to distinguish it from searches.
If you are saving a large number of reports, consider developing a naming
strategy to make individual saved reports easy to find.
255
When you run a saved report, it creates a new report using the search string,
time range, and chart formatting parameters (the chart type, chart title, legend
placement, and so on) that are associated with the original report. This is
important to keep in mind, especially if you are planning to share the saved
report with others or base dashboard panels on it . (Saved searches do not
include chart formatting parameters--to capture these, generate a report based
on the search, and save it instead.)
Note: Saved reports are a type of Splunk knowledge object, along with saved
searches, event types, tags, and other items that enrich your Splunk data and
make it easier to do what you need to do with Splunk. When you first save a
Splunk knowledge object, it is only available to you in the app that you're using
when you create it. If you have the privileges to do so Save > Save report
enables you to share the report with all the users of the app you're currently
using, with read-only access.
If you have the ability to set search and report object permissions, you can
enable other kinds of access to your saved reports through Manager > Searches
and reports, including sharing them with users in multiple apps and giving users
write access so they can update saved report definitions. For more information,
see "Curate Splunk knowledge with Manager" in the Knowledge Manager
Manual.
Edit a saved report
You might find that you need to update a report after you've saved it. For
example, you might want to fine-tune the search language that the report is
based on. Or you may not like the way the report's chart displays, in which case
you can adjust the chart formatting parameters for the report.
To edit a saved report:
1. First, rerun the saved report by choosing it from the Searches & Reports
menu in the top navigation bar in Splunk Web. When you rerun a saved report,
Splunk opens it in the Report Builder and generates a chart that is based on a
new search job but is constructed using the chart formatting parameters that
were saved as part of the report definition. 2. To update the report's search
string, or update its chart formatting parameters, click Edit report near the top
left of the page:
256
3. The Report Builder opens with the Format report page displayed. If you want
to edit the search itself, click Define report content at the top left. 4. When
you're done, click Save > Save report (to update the original saved report with
your changes) or Save report as... (to capture your updates in a new saved
report with a different name). You can also select Save results only to just save
the results of this particular run of the report (see "Save report results only,"
below, for more information).
Note: If you run a saved report and it doesn't open in the Report Builder, but
rather runs as a search using the search timeline, then it wasn't actually saved as
a report with specific report formatting parameters. You'll need to save it as a
report following the instructions in the subtopic above.
Save report results only
When you're on the Format results page of the Report Builder, you can click
Save > Save results if you want to save the results of a particular run of a report,
so you can review them at a later time. When you do this, you're saving a report
"job," which you can access through the Jobs page.
For more information on managing search and report jobs on the Jobs page see
"Supervise your search jobs" in this manual.
Managing saved report navigation
When you save a report, it should appear in one of the menus in the top-level
navigation bar in Splunk Web. In the Search app, for example, saved reports
appear in the Searches & Reports menu by default.
If you have write permissions for an app, you can change this default location,
and even set things up so that reports with particular keywords in their names are
automatically placed in specific categories in the navigation menu (for example,
so that Splunk automatically places reports with the word "website" in their name
in a list of website-related searches and reports in the navigation menu). You can
also move reports that have already been saved to the default list to different
locations in the top-level navigation menu.
257
For more information, see "Define navigation for saved searches and reports" in
the Knowledge Manager manual and "Customize navigation menus" in the
Developer manual.
Share reports with others
There's no need to keep your completed reports to yourself if they contain useful
information that others should see. Splunk gives you a variety of ways to share
them.
• Export the event data to a file. You can export the event data from your
report to a CSV, XML, or JSON file. You can then archive this raw tabular
data or input it into a third-party application such as MS Excel. To export
event data, click Export in the Table section of the report.
• Print the report. Splunk can send an image of the report you've created
and its corresponding table straight to a printer, or save the report as a
.pdf file depending upon available printer drivers. To print the report, click
the blue Print icon at the top right of the report.
• Set up delivery of .pdf report printouts with email alerts You can also
arrange to have .pdf report printouts delivered with alert emails. For more
information, see "Create an alert" in this manual.
• Get (and share) a link to the results. Select Save > Save and share
results to get a URL link to the report results. You can share this link with
other interested parties, who can view it as long as they have access to
your instance of Splunk.
Add reports to views and dashboards
It's also possible to design specialized views and dashboards that include reports
that you've defined. Dashboards can be made up of multiple panels that each
display charts, lists, and other data that are generated by searches. You can
associate your saved reports with these dashboard panels.
Splunk provides a dashboard editor that enables you to quickly create simple
dashboards. For more information, see "Create simple dashboards with the
dashboard editor" in this manual. For information about creating views and more
sophisticated dashboards, see the Developer manual.
Splunk default dashboards
258
Splunk's Search app comes packaged with a set of useful dashboards and views
that also serve to demonstrate a few different configurations of our search and
reporting modules. As such, they could help you come up with some ideas of
how you might want to design some dashboards and views of your own.
Every page in a Splunk app is a view. For example, the core search page in the
Search app is a default view that ships with that app. You can construct your own
views as you design your own apps.
Dashboards are one of the most common types of views, and they are among
the easiest to build. Each dashboard is made up of panels that can contain
charts, tables, event lists, HTML, and text. Most panels are hooked up to
searches that kick off when the dashboard is loaded, providing you with
up-to-the-moment metrics and analysis. You can design dashboards to provide
insight into just about any aspect of your IT data, from real-time breakdowns of
online sales revenue to lists and charts detailing recent firewall attacks and other
security concerns.
You can easily make simple dashboards. Use the Dashboard Editor to create
new dashboards and edit existing ones. You can create dashboard panels that
are based on saved searches and reports, rearrange a dashboard's panel order,
and much more. For more information, see "Create and edit simple dashboards"
in this manual.
To learn how to create more sophisticated dashboards, see the "Build
dashboards" chapter of the Developer manual.
Summary dashboard
The Summary dashboard is the first thing you see as you enter the Search app.
It provides a search bar and time range picker which you can use to input and
run your initial search. Below that, you'll find some elemental indexing metrics for
this instance of Splunk, all of which are generated by inline searches and saved
searches linked to the dashboard. You'll find a count of the total amount of
events indexed, and the timestamps for the earliest and latest events indexed.
You'll also see lists displaying the various sources, sourcetypes, and hosts
indexed by your Splunk instance, ordered by the total amount of events indexed
for each field. Select a list item to kick off a search for occurrences of that
particular field.
259
Note: Keep in mind that index permissions are set at the role level. This means
that viewers of the Summary dashboard can only see indexing information for
indexes that they have permissions to see, according to their role. For more
information about users, roles, and role-based index permissions, see the "Add
and manage users" section of the Admin manual.
Not finding the events you're looking for?
When you add an input to Splunk, that input gets added relative to the app you're
in. Some apps, like the *nix and Windows apps, write input data to a specific
index (in the case of *nix and Windows, that is the os index). If you review the
summary dashboard and you don't see data that you're certain is in Splunk, be
sure that you're looking at the right index. You may want to add the index that an
app uses to the list of default indexes for the role you're using. For more
information about roles, refer to the topic about roles in the Admin Manual.
Status dashboards
The Search app includes five collections of dashboards that display different
kinds of Splunk status information. You can find them under Status in the
top-level navigation bar.
Note: These dashboards are only visible to users with Admin role permissions.
For more information about users and roles, see the "Add and manage users"
section of the Admin manual. the Admin manual. For more information about
setting up permissions for dashboards, see the Knowledge Manager manual.
• Search activity - This dashboard collection provides at-a-glance info
about search activity for your Splunk instance. You can find out when
260
searches are running, the amount of load they're putting on the system,
which searches are the most popular, which search views and dashboards
are getting the most usage, and more.
• Index activity - This collection of dashboards expands upon the basic
indexing statistics presented in the summary dashboard. You'll see the
total events indexed (broken out by index), the top five indexed
sourcetypes, the indexing rate by sourcetype over the past 24 hours, lists
of indexing errors, and a number of other useful stats.
• Server activity - This small collection of dashboards provides metrics
related to splunkd and Splunk Web performance. You'll find the numbers
of errors reported, lists of the most recent errors, lists of timestamping
issues and unhandled exceptions, a chart displaying recent browser
usage, and more.
• Inputs activity - This dashboard displays information about your Splunk
inputs. You can see your most recently processed files and your most
recently ignored files.
• Scheduler activity - This collection of dashboards gives you insight into
the work of the search scheduler, which ensures that both ad hoc and
scheduled searches are run in a timely manner.
Advanced charting view
In the top-level navigation bar's Dashboards & Views list, you can find the
Advanced Charting view. This example of view construction enables you to
build charts without opening up a separate Report Builder window. Enter a
search that uses reporting language into the search bar, and the resulting chart
appears in the results area.
Manage views
The Manage views link in the Views list takes you to the Views page in
Manager, where you can review and update the views that you have permission
to manage, change their permissions, and add new views. To create or update
views here you need to be familiar with XML and have an understanding of how
views are developed in Splunk. For more information see the Developers
manual.
Note: You can also get to the Views page by navigating to Manager > User
interface > Views.
261
Create and edit simple dashboards
Splunk makes it easy to interactively build and edit simple dashboards without
writing a single line of XML code.
• Add a search you've just run to a new or existing dashboard: You can
jump right into dashboard creation after running a search that produces a
visualization you like with the Create Dashboard Panel feature. It will
guide you through the process of creating a dashboard panel based on
the search and adding it to a new or preexisting dashboard. When you're
done, you're still in the Search view, ready to run more searches.
• Use the Dashboard Editor to create dashboards and populate them
with dashboard panels: You can also use the Dashboard Editor to edit
existing dashboards. This method of dashboard creation is useful if you
have a set of search strings that you want to quickly base a set of
dashboard panels upon.
Add a search you've just run to a new or existing dashboard
Say you design a search after a bit of trial and error that produces results that
you'd like to see in a new or preexisting dashboard. You can do this without
going to a dashboard and adding the panel manually. Simply click the Create
button below the search bar and click ...Dashboard Panel to open the Create
Dashboard Panel dialog box.
The Create Dashboard Panel dialog box is divided into three screens. In
Search, the first screen, enter the title of the panel that you wish to create. Keep
in mind that the search you're basing the panel on will be saved with this same
title.
Click Next to go to Dashboard, the second screen. On this screen, you'll
determine whether the dashboard is to be added to a new dashboard or a
dashboard that already exists.
262
• If you want to add this new panel to a new dashboard, on the Dashboard
screen you can give the new dashboard a title and determine its
permissions (you can keep the new dashboard private--available only to
you--or you can share it with other members of the app that you're
currently working in. Click Next to go on to the final screen.
Note: For more information about permissions setup see the "Share and promote
knowledge objects" subtopic of the "Curate Splunk knowledge with Manager"
topic in the Knowledge Manager Manual.
• If you want to add this panel to an existing dashboard, select Existing
dashboard and select the dashboard from the dropdown. The dropdown
will only display dashboards that you have edit permissions for. (If no
dashboards exist that you have permission to alter, this option will be
unavailable.)
Click Next to go to Panel, the third and final screen. On this screen you'll define
basic aspects of the panel. It carries over the Panel title from the search title you
provided on the Search screen but you can change it if you want.
You can choose the Visualization displayed by the panel. If your search does
not include reporting commands, only the Table and Event list options will be
available. If your search does include reporting commands, all options should be
263
available except Event list.
For the Schedule section you can determine how the underlying search works in
relation to the panel. Here you have a tradeoff: recency of data displayed versus
panel load speed.
If you want the most recent data available to appear in the panel, choose Run
search each time dashboard loads. When you load the dashboard, the panel
will run the search. If it's a slow-running search, you may have to wait a few
moments to see the results in the panel.
If you want your panels to load quickly and don't mind that the data is not fully
up-to-date, choose 'Run scheduled search instead. When you choose this option
you need to select an interval upon which the search will be run, such as every
hour or every day at midnight. You can also define a custom interval schedule
using standard cron notation..
Click Finish to save your dashboard panel. When you do this:
• The underlying search will be saved. You can review it at Manager >
Searches and Reports.
• A new dashboard will be created (if you selected that option).
• A new panel that uses the underlying search will be added to the selected
dashboard.
To edit the panel, or the dashboard as a whole, go to the dashboard you've
added the panel to (you should be able to find it in the Dashboards & Views
menu towards the top of the page}. You can change the underlying search with
the Search Editor and change the way the dashboard visualizes the search data
with the Visualization Editor. And you can update the dashboard layout with the
Dashboard Editor. See the following subtopic for more information about all of
these features.
Create and edit dashboards with the Dashboard Editor
The Dashboard Editor enables you to:
• Create dashboards and then populate them with panels.
• Rearrange dashboard panels through a simple drag-and-drop interface.
• Use a Search Editor to edit the base searches of dashboard panels.
• Use a Visualization Editor to reformat visualizations for dashboard panels.
264
To access the Dashboard Editor, click Dashboards & Views in the app
navigation bar towards the top of the page (when in the Search app) and then
click Create dashboard....
The Search Editor enables you to modify the search and includes an option to
test the search before saving your changes.
The Visualization Editor enables you to specify how returned data is displayed in
a dashboard. You can select the visualization type (such as tables, lists of
events, charts, and single-value displays) and you can specify how the
visualizations appear and behave. (To see a list of the available visualization
types and the formatting options associated with them, see the "Visualization
reference" topic in this manual.
If you want to create complex dashboards with features such as form inputs and
special drilldown actions, edit the XML implementing the dashboard. Refer to
"Forms: An Introduction" and "Introduction to advanced views" in the Developer
Manual for more information on creating and editing complex dashboards.
Note: A common workflow for creating complex dashboards is to first use the
Dashboard Editor to create and lay out the panels. Use the Search Editor and
Visualization Editor to fine tune the search and change or modify the visualization
of returned data. Then edit the XML as needed to implement any additional
functionality. Advanced features of the dashboard may require using Advanced
XML, as described in "Introduction to advanced views" in the Developer Manual.
The following sections provide examples of how to use the Dashboard Editor,
Search Editor, and Visualization Editor to create and edit a simple dashboard.
Use the Dashboard Editor to create a dashboard with two panels
This example shows you the basics of the Dashboard Editor. It shows how to
create a dashboard with two panels, one panel based on a saved search and the
other based on an inline search that you specify. It also shows how to rearrange
the panels in the dashboard using drag and drop.
The searches used in this example are based on the Flower Shop Tutorial
described earlier in this manaul. However, you can substitute the searches in this
example with any similar type of search.
1. Select Dashboards & Views > Create Dashboard. After providing an ID and
a name for the dashboard, the Dashboard Editor opens.
265
• Specify TestDashboard and "Test Dashboard" for the ID and the name,
then click Create....
• The initial dashboard is empty and the editing feature is Off.
2. Click Edit: On.
Next, click New Panel.
• Specify "Errors in the last 24 hours" for the Title
• Select the saved search, "Errors in the last 24 hours"
• Click Save, to add the panel to the dashboard
3. Click New Panel to add an additional panel to the dashboard:
• Specify "Flower Store Price Difference (Last 7 days)" for the Title
• Select inline search and specify the following for the search:
sourcetype=access_* | stats values(product_name) as product by
price, flowersrus_price | eval difference = price flowersrus_price | table product, difference
• Specify a time range of -7d to now.
266
Note: For information about defining search time ranges with relative time
syntax (a set start and end time) see "Change the time range to narrow
your search" in this manual. For information about setting up real-time
searches and real-time search windows, see "Search and report in real
time" in this manual.
• Click Save.
4. Click and drag the newly added panel, placing it to the right of the initial panel.
5. Click Edit: Off to turn off the editing feature.
The dashboard is now available for use. You can access the dashboard from the
Dashboard & Views menu.
Note: When in editing mode, the Dashboard Editor resizes a panel so it is
smaller than the actual size, showing only the top portion of the panel.
When you turn off editing mode, the entire panel is visible.
Modify the search in a panel
Use the Search Editor to modify the search for a panel. The Search Editor also
provides an option to test the search before you save it. The editing options
available to you differ for inline searches and saved searches.
Inline searches
For inline searches, the Search Editor provides the following options:
• Replace the inline search with a saved search (If you select this option,
the Search Editor displays the options for saved searches, listed below.)
• Modify the search string
• Modify the time range
267
• Run the search to preview the results
Saved searches
For saved searches, the Search Editor provides the following options:
• Select a different saved search
• Edit the search in Splunk Manager
• Replace the saved search with an inline search (If you select this option,
the Search Editor displays the options for inline searches.)
• Run the search to preview the results
Note: If you want to edit a saved search query, either change the search to an
inline search or edit the search query in Splunk Manager. You cannot edit a
saved search query directly in the Search Editor.
Search Editor example
1. If editing mode for the test dashboard is not enabled, click Edit: On.
2. In the Flower Store Price Difference panel, select Edit > Edit Search.
3. Edit the search string and specify a time range of -1mon to now.
4. Click Run search to test the new search, which opens in a new tab or window
of your browser.
5. Close the test run, click Save.
6. in the Errors in the Last 24 Hours panel, select Edit > Edit Search.
268
7. Click Edit in manager. The saved search opens in the Splunk Manager.
Modify the search and click Save.
Change dashboard panel visualizations
After you create a panel with the Dashboard Editor, use the Visualization Editor
to change the visualization type displayed in the panel, and to determine how
that visualization displays and behaves.
The Visualization Editor only allows you to choose from visualization types that
have their data structure requirements matched by the search that has been
specified for the panel. For example, if the search does not include reporting
commands such as such as stats, chart, timechart, top, or rare, it won't
enable you to choose a chart visualization type.
• For more information on reporting commands, see "Use reporting
commands" in this manual.
• For an overview of the various visualization types offered by Splunk and
their formatting/display options, see Visualization reference".
• For more information about the data structures required by of the various
visualization types see "Data structure requirements for visualizations" in
this manual.
You can find a detailed breakdown of the visualization definition options
presented by the Visualization Editor in "Edit dashboard panel visualizations," in
this manual.
Note: For information on the types of visualizations available, refer to the
"Visualization Reference" topic in this manual. For information on Splunk
drilldown features, refer to "Understand basic table and chart drilldown
actions."
Visualization Editor example
The following example shows how to modify the two panels in the Test
Dashboard created in the previous example. "Edit dashboard panel
visualizations" in this manual provides additional information and examples on
creating and editing visualizations.
1. If editing mode for the test dashboard is not enabled, click Edit: On.
2. In the Errors in Last 24 Hours Panel, click Edit > Edit Visualization.
269
3. Make the following edits in the Visualization Editor:
• For Visualizations, select Events.
• For Row numbers, select No.
• For Wrap results, select Yes.
Note: As you can see in the screenshot, these are the options that are available
for the Events visualization type. Other visualization types, such as tables,
charts, and single-value visualizations, will provide other options. See either the
"Visualization reference" or "Edit dashboards with the Visualization Editor" topics
in this manual for more information.
4. Click Save, then click Edit: Off.
The panel now displays errors as a wrapping list
5. In the dashboard, click Edit: On.
6. In the Flower Store Price Difference panel, select Edit > Visualization.
7. Make the following edits in the Visualization Editor:
• For Drilldown, select Cell.
• For Row numbers, select No.
• For Data overlay, select Heat Map.
8. Click Save, then click Edit: Off.
Notice your visualization changes, including that drilldown is enabled for the
Product cells.
270
Edit the XML configuration of a dashboard
You can also edit a dashboard and the panels it contains by editing the XML
configuration for the dashboard. This provides editing access to features not
available from the Dashboard Editor. For example, edit the XML configuration to
change the name of dashboard or specify a custom number of rows in a table.
1. If editing mode for the Test Dashboard is not enabled, click Edit: On.
2. Click Edit XML to open the Splunk XML Editor for the Test Dashboard.
Change the name of the dashboard to "My Dashboard" and specify 5 rows for
the Flower Store Price Table, as indicated in the code sample:
<?xml version='1.0' encoding='utf-8'?>
<dashboard>
<label>My Dashboard</label>
<row>
<event>
<searchName>Errors in the last 24 hours</searchName>
. . .
</event>
<table>
. . .
<title>Flower Store Price Difference (Last 7 days)</title>
<earliestTime>-7d</earliestTime>
<latestTime>now</latestTime>
<option name="count">5</option>
. . .
</table>
</row>
</dashboard>
For more information about editing XML for dashboards created with the
Dashboard Editor, see "Dashboards: An Introduction" in the Developer manual.
271
Change dashboard permissions
You can specify access to a dashboard from the Dashboard Editor. However,
your user role (and capabilities defined for that role) may limit the type of access
you can define.
For example, if your Splunk user role is user (with the default set of capabilities),
then you can only create dashboards that are private to you. You can, however,
provide read and/or write access to other users.
If your Splunk user role is admin (with the default set of capabilities), then you
can create dashboards that are private, visibile in a specific app, or visible in all
apps. You can also provide access to other Splunk user roles, such as user,
admin, and other roles with specific capabilities.
For additional information on user roles, capabilites, and permissions refer to
"Share and promote knowledge objects" in the Admin manual.
Edit permissions for an admin user
The following example shows how an admin user can specify permissions for a
dashboard.
Note: For other user roles, such as user, the choices for permissions in
the Dashboard Editor are a subset of the choices available to the admin
user.
1. If editing mode for the test dashboard is not enabled, click Edit: On.
2. In the Dashboard Editor, select Edit permissions
3. Specify the views in which the dashboard is visible. choose from the following:
• Keep private: The dashboard is only visible to the user who created it. In
this example, the admin user.
• This app only (app name): Dashboards can be visible to a specific app.
app name refers to the app that you were in when you created the
dashboard. From the Manager pages, you can change the app specific to
a dashboard.
• All apps: The dashboard is visible from all apps.
272
4. Specify the user roles that have access, and their type of access.
• You can specify that the dashboard is visible to all users, or you can select
a combination of different user roles.
• Specify the Read and Write permissions for each role you select.
5. Select Save and click Edit: off.
Manage dashboard navigation
Because dashboards are a type of view, by default any new dashboard appears
in the View drop-down list in the Splunk Web navigation menu. Edit the XML
behind the navigation menu to:
• Change the the location of unclassified dashboards. You can move
dashboards to existing lists (or "view collections") in the navigation menu,
or create new lists for them.
• Create nested collections (view collections within navigation bar lists) that
classify similar dashboards together. For example, under your
Dashboards dropdown, you could have a "Web Server" collection that
groups together a set of dashboards that display different kinds of firewall
information for your web server.
Note: Navigation is managed on an app by app basis. If your dashboard has
been promoted globally to all of the apps in your system, it initially appears in the
default drop-down list for "unclassified" views in those apps' top-level navigation
menus. Users with write permissions for those apps can move the dashboard to
its proper location in the app navigation menus as appropriate.
For an overview of navigation menu management see "Define navigation for
saved searches and reports" in the Knowledge Manager manual.
273
If you have write permissions for your app, you can access its navigation menu
XML by opening Manager, clicking Navigation Menus, and then clicking the
name of the navigation menu for your app. See the "Build navigation for your
app" topic in the Developer manual for details about working with the navigation
menu code.
Delete panels and dashboards
You can delete panels from a dashboard using the Dashboard Editor or editing
the XML configuration. You delete a dashboard from Splunk Manager. You must
be logged in as an admin and have permission to delete the dashboard.
Delete a panel from a dashboard
1. If editing mode for the dashboard is not enabled, click Edit: On.
2. For the panel, select Edit > Delete.
OR
2. Click Edit XML and delete the XML code implementing the panel.
Delete a dashboard
1. Login as an admin user and go to Manager > User interface > Views.
2. Locate the dashboard in the list of views. Locate the Delete link under Actions
(visible if you have permissions to delete the dashboard). Click Delete.
Edit dashboard panel visualizations
The Visualization Editor provides many features to help create and modify
visualizations in a panel. The visualization you choose to represent your data, of
course, depends on your search query.
The Visualization Editor is only available for dashboards that use the simplified
XML syntax (such as panels that have been created by the Dashboard Editor.
Dashboards that have been built with advanced XML syntax can only be edited
using an XML editor.
274
Caution: The Visualization Editor does not check if the visualization you
select is appropriate for your search. If you select an inappropriate
visualization, you can misrepresent the data returned. For example, if you
have a search that returns data in a table, the Visualization Editor allows
you to select Single Value to represent the results.
Note: The topics in this section assume familiarity with Splunk visualizations, as
described in the "Visualization Reference" in this manual.
About the Visualization Editor
You can only edit panels in dashboards for which you have "write" permissions.
If you have read-only access to a dashboard, you cannot change the appearance
of any panels in that dashboard. By default you have write permissions for any
dashboard that you create using the Dashboard Editor. However, an admin user
can change those permissions.
The Visualization Editor is only available for dashboards that have been
constructed with the simplified XML syntax. This includes dashboards that were
created Using the Splunk Dashboard Editor. For more information on creating
dashboards with the Dashboard Editor, see "Create and edit simple dashboards,"
in this manual.
To open the Visualization Editor for a panel in a dashboard:
1. Select Edit: On to enable editing for the dashboard.
2. Select Edit > Edit Visualization for the panel you want to edit.
Features available from the Visualization Editor
Each visualization contains a set of features that you can modify to change the
appearance of the visualization. Different charts share many of the same
features while other charts can contain a different set of features. This section
provides a brief description of the features that you are available for editing.
For details on these features, refer to the "Visualization Reference" in this
manual.
General
The General category includes a title for the visualization and other features
specific to that visualization. These include:
275
• Stack mode: (Column, Bar, and Area) How to place data in the chart.
Options are Not Stacked, Stacked, or Stacked 100%.
• Drilldown: (Table and all chart visualization types. Not applicable to event
lists, single-value visualizations, and gauges.) Enable drilldown
functionality for the visualization. In the case of tables, you can enable
drilldown for rows or for cells. For more information, see "Understand
basic table and chart drilldown actions," in this manual.
• Null value: (Area, Line) Specifies how Splunk should represent missing Y
axis values. Options are Leave gaps, Connect to zero, or Connect to next
data point.
X Axis and Y Axis
Many charts have both an X Axis and Y Axis. Some charts, such as Pie, have
only a Y Axis.
In the Visualization Editor, you can specify a title for each of these axes. Upi can
also specify the following:
• Major Unit: Specify the units for tick marks in the axis. For example, 10,
20, or 45... whatever works best.
• Unit Scale: Specify Linear or Log. Log provides a logarithmic scale which
is useful for minimizing the display of large peak values.
276
Legend
Charts typically color code returned results, using a legend to identify the data
represented by each color. In the Visualization Editor you can specify the
following for Legend:
• Position: Where to place the legend (or to not include the legend) in the
visualization.
• Truncation: How to represent names in the legend that are too long to
display entirely. Specify where to place an ellipsis to represent truncated
characters.
Single Value and Gauges
For data returned as a single value, Splunk provides a Single Value visualization
and various styles of gauges (Radial, Filler, and Marker). You can specify the
following features for these visualizations:
277
• Before and After labels: (Single Value) Specify text that appears before
or after the returned value.
• Style: (Radial, Filler, Marker) Specify whether to use minimal graphics to
display the gauge.
• Color ranges: (Radial, Filler, Marker) Specify Automatic or Manual. In
Automatic mode, Splunk determines the size and color of returned value
ranges. In Manual mode, you can specify colors and the value range they
represent.
Data series and visualizations
When creating visualizations for charts, it is useful to think of the returned data in
terms of series, a sequence of related data points that can be plotted on a chart.
The visualization you choose depends on the type of series.
Series
Description
Single series
Produces a table with only two columns.
Multiple series
Produces a table with three or more columns.
Single value
Returns a single value. (Technically, this is not an example of a series.)
Note: "Data structure requirements for visualizations" in this manual provides
details on how to select the appropriate visualization for your data and includes
discussions on data series.
The following sections describes the charts that best represent data for each of
these series. They also provide some examples of how to use the Visualization
Editor to create and modify the visualizations.
• Visualizations for single series
• Visualizations for multiple series
278
• Visualizations for single values
Visualizations for single series
A single series search is a transforming search that produces a table with only
two columns. All chart visualizations can represent a single series search
effectively. However, the following charts are usually best:
• Bar
• Column
• Line
• Pie (Pie charts are only suitable for single series searches)
The following examples use searches from the Flower Shop example, available
from the Splunk Tutorial.
Note: You can follow these examples using searches that return similar
results.
Column and Pie chart examples
1. Using the Dashboard Editor, create a dashboard with two panels that each
specify the following inline search. Specify a time range from -7d to now.The
dashboard displays the data in a table.
Views by product category, past week
sourcetype=access_* method=GET | timechart count by categoryId | fields
_time BOUQUETS FLOWERS
2. Open the Visualization Editor for the first panel. Select Column from the list of
visualizations.
3. Modify the panel title to say:
279
"Views by product category, past week (Stacked)"
4. For Stack mode, select Stacked. Leave Drilldown enabled.
5. Under General, specify the following:
• X Axis: Date
• Y Axis: Views
• Legend > Position: Bottom
• Legend > Truncation: A... (To specify how to truncate long labels)
Note: For Y Axis you could specify the units and minimum value, but
leave these blank for this visualization. If your data has unusually large
peaks, you can specify Log for the unit scale. This minimizes the
emphasis on the peaks.
6. Click Save and view the Column visualization.
Turn editing mode off to view the panel. Mouse over the columns to view the tips
that appear.
7. Return to editing mode and open the Visualization Editor for the second panel.
Select Pie from the list of visualizations.
8. Modify the panel title to say:
"Views by product category, past week (Pie Chart)"
9. For Legend, specify the position at the bottom. Save your edits and turn
editing mode off.
Tip: Modify the selections for both of these charts to see how you can change
visualizations for a panel.
280
Example using the wrong visualization
The Visualization Editor does not enforce the correct visualization for a search.
For example, for the search in the previous example for Column and Pie Chart,
you could have selected Single Value for the visualization even though this
cannot represent the returned data correctly. This example illustrates what
happens if you select the wrong visualization.
1. In the dashboard from the previous example, add another panel with the same
search and place it to the right of the other two panels.
2. For the third panel, select Single Value.
Note: The Panel title field indicates "Error." This is because Single Value
does not apply to tabular data.
3. Click Save. Turn off editing mode and view your panels.
The Single Value visualization picks one value to display. Here the error is
obvious, but in other examples that incorrectly specify visualizations, it may be
easy to overlook errors in the display.
4. Return to editing mode and delete this panel from your dashboard.
Visualizations for multiple series
A multiple series search is a transforming search that produces a table with three
or more columns. The following charts are best for a multiple series search:
• Bar
• Column
• Line
• Area
281
• Scatter
The following examples use the same search in the example for single series,
but modifies it to return a table with five columns.
Area and Scatter chart examples
1. In the dashboard you created for single series search, add two additional
panels that use the following search. Specify a time range of -7d to now</code>.
Place the panels side by side in a row beneath the other panels.
Views by product category, past week
sourcetype=access_* method=GET | timechart count by categoryId | fields
_time BOUQUETS FLOWERS GIFTS SURPRISE TEDDY
2. For the first panel, select Area from the list of visualizations. Modify the panel
title to say:
"Views by product category, past week (Area)"
3. Make the following specifications in the Visualization Editor, then select Save:
• For Stack mode select Stacked.
• For Null value select Connect
• For X Axis specify "Date"
• For Y Axis specify "Views"
4. For the second panel, select Scatter.
282
5. Modify the panel to say:
"Views by product category, past week (Scatter Chart)"
6. Select Save.
7. Click Save. Turn off editing mode and view your panels.
Mouse over areas in each panel to see how screen tips provide details for
various areas. Click on sections to drilldown to the underlying data.
Single value visualizations
For searches that return single values, Splunk provides the following
visualizations that you can specify with the Visualization Editor:
• Single Value
• Radial Gauge
• Filler Gauge
• Marker Gauge
The following example shows how to represent the value returned from a search
using each of these visualizations. It uses the following search, which returns the
number of log entries in a Splunk log file.
Splunk server log events
283
index=_internal source="*splunkd.log" ( log_level=ERROR OR log_level=WARN*
OR log_level=FATAL OR log_level=CRITICAL) | stats count as log_events
Note: You must be logged in as an admin user (or a user with admin privileges)
to return results from this search.
Single Value, Radial Gauge, Filler Gauge, and Marker Gauge examples
1. Log in as an admin user. In the Dashboard Editor, create a new dashboard
named "Displaying single values."
2. Add four panels that use the "log events" search listed above. Name each
panel "Splunk sever log events." Specify a range form -1d to now. Place the
panels in two rows, each with two panels.
3. In the first panel, open the Visualization Editor and make the following edits:
• For Visualizations, select Single Value. Change the panel title to "splunkd
errors logged (Single Value)."
• For Before label, specify "Only."
• For After label, specify "events."
284
Note: The Single Value visualization can display colors, based on the value
returned from the search. To display colors, modify the search and edit the
underlying XML, as explained in "Single value dashboard display" in this manual.
4. Modify the other panels similarly, selecting the following visualizations. Do not
specify labels for these.
• Radial Gauge
• Filler Gauge
• Marker Gauge
5. For the Radial Gauge, click Color ranges and make the following edits, then
click Save:
• Click Manual
• For Green specify a range from 0 to 200
• For Yellow specify up to 2000
• For Red specify up to 5000
Note: Modify the range according to the data returned by your search to give a
meaningful visualization.
285
6. Turn off editing mode and view the panels.
Schedule delivery of dashboard PDF printouts via
email
Splunk enables you to have .pdf printouts of dashboards generated and sent as
email attachments to project stakeholders on a regular schedule.
There are many situations that might warrant the scheduled delivery of
dashboard views via email. For example, you could have an executive team that
wants to receive an operations report in their inbox on a daily or weekly basis. To
address this, you would first set up a dashboard view that presents high-level
286
operations metrics in table and chart form. Then you would use this functionality
to generate and distribute it on a regular schedule to the stakeholders via email,
as a .pdf attachment.
To do this:
1. Go to the dashboard view that you want to share and click Schedule PDF
delivery at the top right of the dashboard.
2. Define a schedule for the report in much the same way that you schedule a
saved search, using standard cron notation or one of the predefined time
intervals in the Reporting Frequency list.
3. Identify one or more email recipients.
4. Click Schedule.
On the schedule that you set up, Splunk will run the selected dashboard,
generate a .pdf printout of it, and send that printout to the identified email
recipients.
Important: Use of this feature requires the setup of the PDF Report Server app
on a central Linux host. If you don't have this set up, contact a system
administrator. For more information see "Configure PDF printing for Splunk Web"
in the Installation manual.
For more information about dashboards in Splunk apps, start with "Use
report-rich dashboards and views" in this manual. From there you can get to
topics that show you how to create simple dashboards with the visual dashboard
editor and design more complex ones using XML.
Note: You can also send .pdf printouts of scheduled searches and reports as
email attachments. For more information on setting this up, see "Create an alert"
in this manual.
287
Search Examples and Walkthroughs
What's in this chapter
This chapter contains links to examples that walk you through constructing
searches and, in some cases, building reports and setting up alerts. Some of
these examples are in the following topics, others are throughout the manuals.
Reporting: Build a chart of multiple data series
Splunk's reporting commands do not support a direct way to define
multiple data series in your charts (or timecharts). This example
demonstrates how you can produce a chart of multiple data series using
the stats and xyseries commands.
Reporting: Compare hourly sums between multiple days
This is an example of how you might want to use chart to compare values
collected over several days.
Monitor and alert on Windows disk usage
This example walks you through setting up a basic conditional alert that
sends an email when the disk usage falls below a certain percentage.
Reporting: Build a chart of multiple data series
Splunk's reporting commands do not support a direct way to define multiple data
series in your charts (or timecharts). However, you CAN achieve this using a
combination of the stats and xyseries commands.
The chart and timechart commands both return tabulated data for graphing,
where the x-axis is either some arbitrary field or _time, respectively. When these
commands are used with a split-by field, the output is a table where each column
represents a distinct value of the split-by field.
In contrast, the stats command produces a table where each row represents a
single unique combination of the values of the group-by fields. You can then use
the xyseries command to redefine your data series for graphing.
For most cases, you can simulate the results of "... | chart n by x,y" with "... | stats
n by x,y | xyseries x y n". (For the timechart equivalent of results, x = _time.)
288
Scenario
Let's say you want to report on data from a cluster of application servers. The
events gathered from each server contain information such as counts of active
sessions, requests handled since last update, etc. and are placed in the
applications_servers index. You want to display each server instance and the
number of sessions per instance on the same timechart so that you can compare
the distributions of sessions and load.
Ideally, you want to be able to run a timechart report, such as:
index=application_servers | timechart sum(handledRequests)
avg(sessions) by source
However, timechart does not support multiple data series; so instead, you need
run a search similar to the following:
index=application_servers | stats sum(handledRequests) as hRs,
avg(sessions) as ssns by _time,source | eval s1="handledReqs sessions"
| makemv s1 | mvexpand s1 | eval
yval=case(s1=="handledReqs",hRs,s1=="sessions",ssns) | eval
series=source+":"+s1 | xyseries _time,series,yval
Walkthrough
... | stats sum(handledRequests) as hRs, avg(sessions) as ssns by
_time,source
This uses the stats command to calculate statistics for each source value: The
sum of handledRequests values are renamed as hRs, and the average number of
sessions are renamed as ssns.
... | eval s1="handledReqs sessions" | makemv s1 | mvexpand s1
This uses the eval command to add a single-valued field "s1" to each result
from
the stats command. Then, the makemv command converts sl into a multivalued
field, where the first value is "handleReqs" and the second value is "sessions".
The mvexpand then creates separate series for each value of s1.
... | eval yval=case(s1=="handledReqs",hRs,s1=="sessions",ssns)
This uses the eval command to define a new field, yval, and assign values to it
based on the case that it matches. So, if the value of s1 is "handledReqs", yval is
assigned the "hRs" value. And, if the value of s1 is "sessions", yval is assigned
the "ssns" value.
... | eval series=source+":"+s1
This uses the eval command to define a new field, series, which concatenates
the value of the host and s1 fields.
289
... | xyseries _time,series,yval
Finally, the xyseries command is used to define a chart with _time on the x-axis,
yval on the y-axis, and data defined by series.
Reporting: Compare hourly sums between multiple
days
While the timechart is great for creating charts that show trends over time, it has
strict boundaries limiting what it can do. There are times when you're better off
with the chart command, which can provide more flexibility.
This is an example of how you might want to use chart to compare values
collected over several days. This is something you can't do with timechart
Scenario
You have two searches that are nearly identical. They both show the hourly sum
of the P field over a 24-hour period. The only difference is that one search covers
a period ten days in the past, while the other covers a period nine days into the
past:
Search 1:
earliest=-10d latest=-9d | timechart span="1h" sum(P)
Search 2:
earliest=-9d latest=-8d | timechart span="1h" sum(P)
What you'd like to do is create a column chart that combines the results of these
two searches, so you can see the sum of P for 3pm, ten days ago side-by-side
with the sum of P for 3pm, nine days ago.
Solution
You can't pull this off with the timechart command. But you can do it with the
chart command, and it's pretty simple. Set up a search that covers both days,
and then have it create a "sum of P" column for each distinct date_hour and
date_day combination found in the search events.
290
The finished search looks like this:
earliest=-10d latest=-8d | chart sum(P) by date_hour date_day
This produces a single chart with 24 slots, one for each hour of the day. Each
slot contains two columns that enable you to compare hourly sums between the
two days covered by the time range of the report.
For a primer on reporting searches and how they're constructed, see "Use
reporting commands" in the User Manual.
For more information about chart> and timechart functions, see "Functions for
stats, chart, and timechart" in the Search Reference Manual.
Monitor and alert on Windows disk usage
This example discusses searches you can use to monitor and report on Windows
disk usage. It also walks through the steps for setting up a conditional alert that
sends an email when the disk usage falls below a certain percentage.
Scenario
I am setting up a search to alert me when a Windows host or Linux host runs
below a certain percentage of Diskspace.
I have tried to schedule alerts based upon Windows Event codes:
host="*" source="wineventlog:system"(\"EventID=4133\"OR
\"EventID=1082\")
However it is not as useful as measuring the disks usage and alerting when the
usage falls below say 10%:
index="os" sourcetype="df" host=* | multikv fields FileSystem, UsePct |
strcat host '@' Filesystem Host_FileSystem | convert rmunit(UsePct) |
search UsePct < 11 | timechart
Disk Utilization Report
source="wmi:localphysicaldisk" "Name=Total" | timechart avg (UsePct) as
"Disk Space", avg(DiskUsage) as "Disk Usage %"
291
Set up conditional alert
content coming soon!
292